

Viewing the Load Balancer tab
 Suggest changes
The Load Balancer tab includes performance and diagnostic graphs related to the operation of the Load Balancer service.
The Load Balancer tab is shown for Admin Nodes and Gateway Nodes, each site, and the entire grid. For each site, the Load Balancer tab provides an aggregate summary of the statistics for all nodes at that site. For the entire grid, the Load Balancer tab provides an aggregate summary of the statistics for all sites.
If there is no I/O being run through the Load Balancer service, or there is no load balancer configured, the graphs display “No data.”
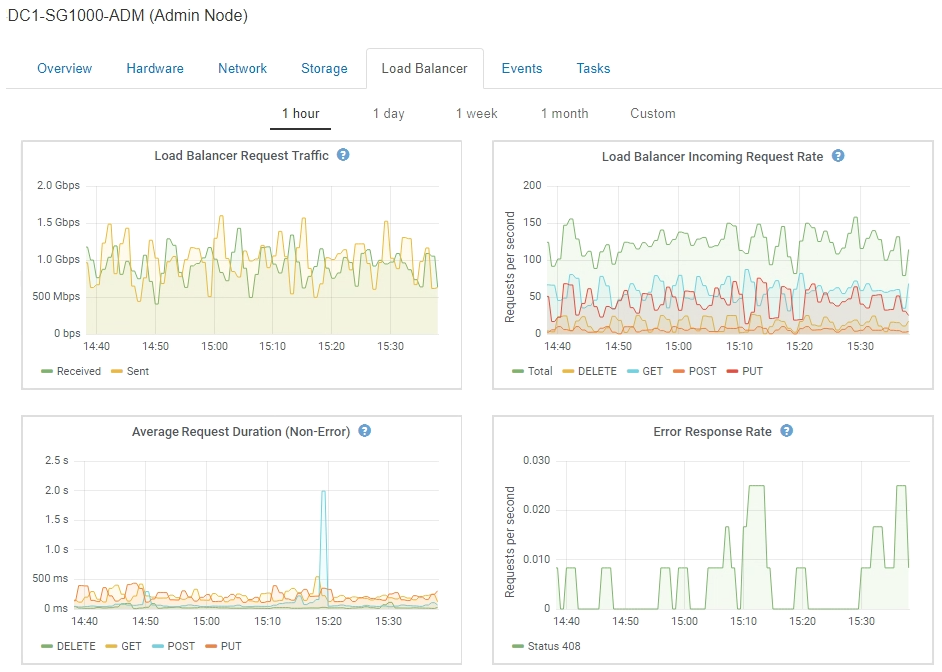
Load Balancer Request Traffic
This graph provides a 3-minute moving average of the throughput of data transmitted between load balancer endpoints and the clients making the requests, in bits per second.

|
This value is updated at the completion of each request. As a result, this value might differ from the real-time throughput at low request rates or for very long-lived requests. You can look at the Network tab to get a more realistic view of the current network behavior. |
Load Balancer Incoming Request Rate
This graph provides a 3-minute moving average of the number of new requests per second, broken down by request type (GET, PUT, HEAD, and DELETE). This value is updated when the headers of a new request have been validated.
Average Request Duration (Non-Error)
This graph provides a 3-minute moving average of request durations, broken down by request type (GET, PUT, HEAD, and DELETE). Each request duration starts when a request header is parsed by the Load Balancer service and ends when the complete response body is returned to the client.
Error Response Rate
This graph provides a 3-minute moving average of the number of error responses returned to clients per second, broken down by the error response code.