Viewing the Nodes page
 Suggest changes


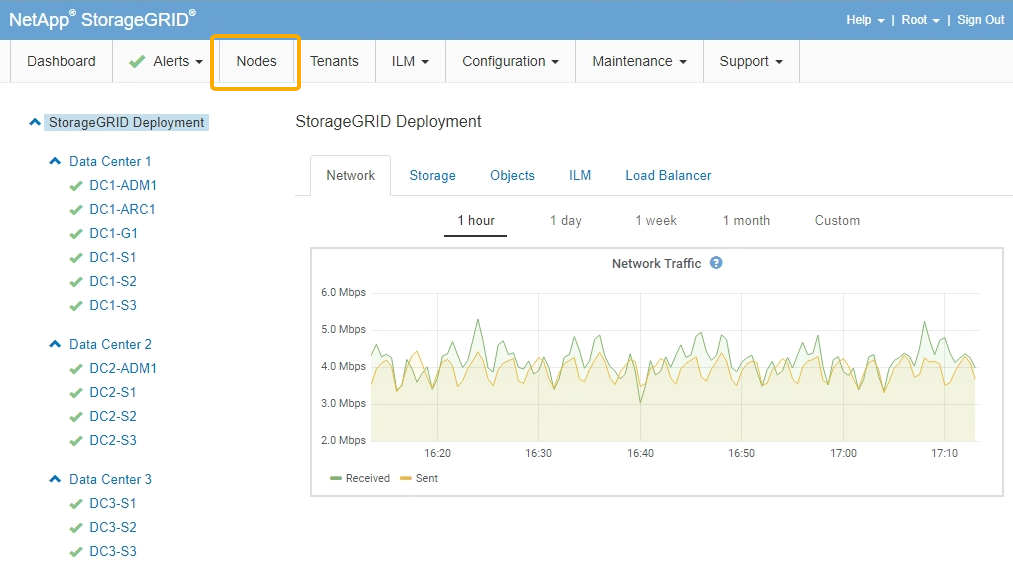
When you need more detailed information about your StorageGRID system than the Dashboard provides, you can use the Nodes page to view metrics for the entire grid, each site in the grid, and each node at a site.

From the tree view on the left, you can see all the sites and all the nodes in your StorageGRID system. The icon for each node indicates if the node is connected or if there are any active alerts.
Connection state icons
If a node is disconnected from the grid, the tree view shows a blue or gray connection state icon, not the icon for any underlying alerts.
-
Not connected - Unknown
 : The node is not connected to the grid for an unknown reason. For example, the network connection between nodes has been lost or the power is down. The Unable to communicate with node alert might also be triggered. Other alerts might be active as well. This situation requires immediate attention.
A node might appear as Unknown during managed shutdown operations. You can ignore the Unknown state in these cases. -
Not connected - Administratively down
 : The node is not connected to the grid for an expected reason. For example, the node, or services on the node, has been gracefully shut down, the node is rebooting, or the software is being upgraded. One or more alerts might also be active.
Alert icons
If a node is connected to the grid, the tree view shows one of the following icons, depending on if there are any current alerts for the node.
-
Critical
 : An abnormal condition exists that has stopped the normal operations of a StorageGRID node or service. You must address the underlying issue immediately. Service disruption and loss of data might result if the issue is not resolved.
 -
Major
 : An abnormal condition exists that is either affecting current operations or approaching the threshold for a critical alert. You should investigate major alerts and address any underlying issues to ensure that the abnormal condition does not stop the normal operation of a StorageGRID node or service.
 -
Minor
 : The system is operating normally, but an abnormal condition exists that could affect the system's ability to operate if it continues. You should monitor and resolve minor alerts that do not clear on their own to ensure they do not result in a more serious problem.
 -
Normal
 : No alerts are active, and the node is connected to the grid.
Viewing details for a system, site, or node
To view the available information, click the appropriate links on the left, as follows:
-
Select the grid name to see an aggregate summary of the statistics for your entire StorageGRID system. (The screenshot shows a system named StorageGRID Deployment.)
-
Select a specific data center site to see an aggregate summary of the statistics for all nodes at that site.
-
Select a specific node to view detailed information for that node.


