

View the Nodes page
 Suggest changes
When you need more detailed information about your StorageGRID system than the Dashboard provides, you can use the Nodes page to view metrics for the entire grid, each site in the grid, and each node at a site.
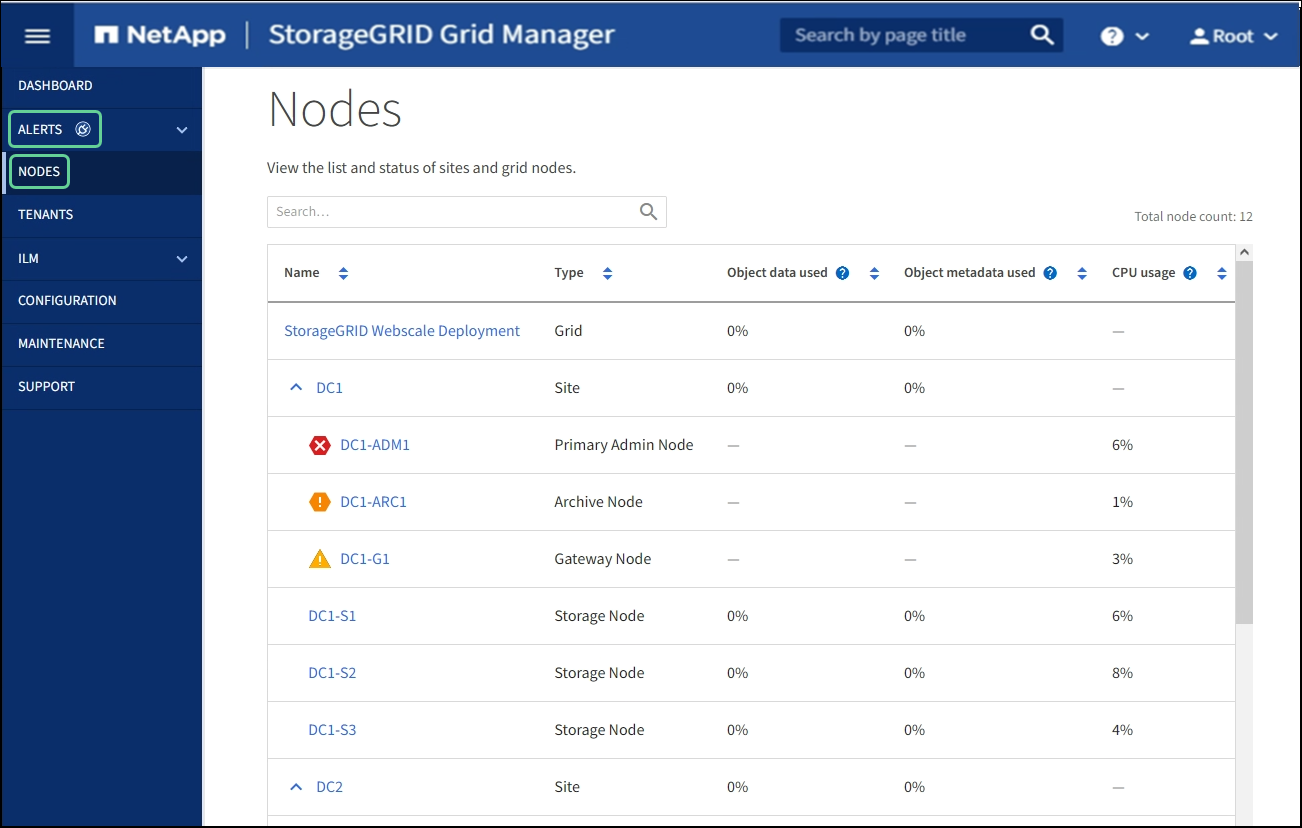
The Nodes table lists all the sites and nodes in your StorageGRID system. Summary information is displayed for each node. If a node has an active alert, an icon appears next to the node name. If the node is connected and has no active alerts, no icon is shown.
Connection state icons
-
Not connected - Unknown
 : The node is not connected to the grid for an unknown reason. For example, the network connection between nodes has been lost or the power is down. The Unable to communicate with node alert might also be triggered. Other alerts might be active as well. This situation requires immediate attention.
A node might appear as Unknown during managed shutdown operations. You can ignore the Unknown state in these cases. -
Not connected - Administratively down
 : The node is not connected to the grid for an expected reason. For example, the node, or services on the node, has been gracefully shut down, the node is rebooting, or the software is being upgraded. One or more alerts might also be active.
If a node is disconnected from the grid, it might have an underlying alert, but only the “Not connected” icon appears. To see the active alerts for a node, select the node.
Alert icons
If there is an active alert for a node, one of the following icons appears next to the node name:
-
Critical
 : An abnormal condition exists that has stopped the normal operations of a StorageGRID node or service. You must address the underlying issue immediately. Service disruption and loss of data might result if the issue is not resolved.
 -
Major
 : An abnormal condition exists that is either affecting current operations or approaching the threshold for a critical alert. You should investigate major alerts and address any underlying issues to ensure that the abnormal condition does not stop the normal operation of a StorageGRID node or service.
 -
Minor
 : The system is operating normally, but an abnormal condition exists that could affect the system's ability to operate if it continues. You should monitor and resolve minor alerts that do not clear on their own to ensure they do not result in a more serious problem.
Details for a system, site, or node
To view the available information, select the name of the grid, site, or node as follows:
-
Select the grid name to see an aggregate summary of the statistics for your entire StorageGRID system. (The screenshot shows a system named StorageGRID Deployment.)
-
Select a specific data center site to see an aggregate summary of the statistics for all nodes at that site.
-
Select a specific node to view detailed information for that node.
Tabs for the Nodes page
The tabs at the top of the Nodes page are based on what you select from the tree at the left.
| Tab name | Description | Included for |
|---|---|---|
Overview |
|
All nodes |
Hardware |
|
All nodes |
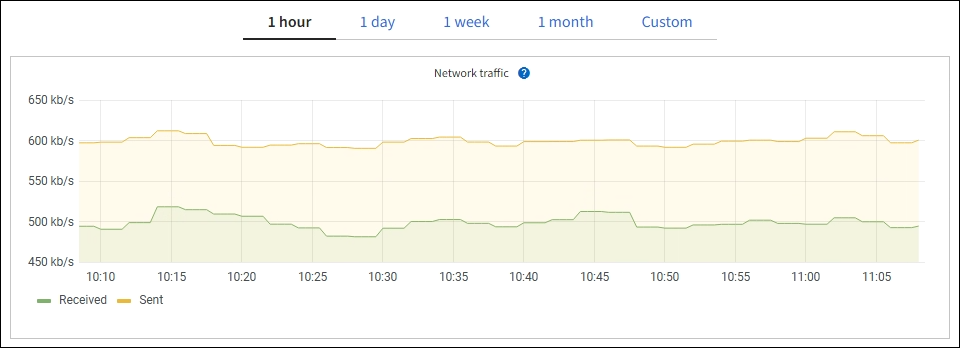
Network |
Displays a graph showing the network traffic received and sent across the network interfaces. The view for a single node shows additional information for the node. |
All nodes, each site, and the entire grid |
Storage |
|
All nodes, each site, and the entire grid |
Objects |
|
Storage Nodes, each site, and the entire grid |
ILM |
Provides information about Information Lifecycle Management (ILM) operations.
|
Storage Nodes, each site, and the entire grid |
Load balancer |
Includes performance and diagnostic graphs related to the Load Balancer service.
|
Admin Nodes and Gateway Nodes, each site, and the entire grid |
Platform services |
Provides information about any S3 platform service operations at a site. |
Each site |
SANtricity System Manager |
Provides access to SANtricity System Manager. From SANtricity System Manager, you can review hardware diagnostic and environmental information for the storage controller, as well as issues related to the drives. |
Storage appliance nodes Note: The SANtricity System Manager tab will not appear if the controller firmware on the storage appliance is earlier than 8.70 (11.70). |
Prometheus metrics
The Prometheus service on Admin Nodes collects time series metrics from the services on all nodes.
The metrics collected by Prometheus are used in a number of places in the Grid Manager:
-
Nodes page: The graphs and charts on the tabs available from the Nodes page use the Grafana visualization tool to display the time-series metrics collected by Prometheus. Grafana displays time-series data in graph and chart formats, while Prometheus serves as the backend data source.
-
Alerts: Alerts are triggered at specific severity levels when alert rule conditions that use Prometheus metrics evaluate as true.
-
Grid Management API: You can use Prometheus metrics in custom alert rules or with external automation tools to monitor your StorageGRID system. A complete list of Prometheus metrics is available from the Grid Management API. (From the top of the Grid Manager, select the help icon and select API Documentation > metrics.) While more than a thousand metrics are available, only a relatively small number are required to monitor the most critical StorageGRID operations.
Metrics that include private in their names are intended for internal use only and are subject to change between StorageGRID releases without notice. -
The SUPPORT > Tools > Diagnostics page and the SUPPORT > Tools > Metrics page: These pages, which are primarily intended for use by technical support, provide a number of tools and charts that use the values of Prometheus metrics.
Some features and menu items within the Metrics page are intentionally non-functional and are subject to change.
StorageGRID attributes
Attributes report values and statuses for many of the functions of the StorageGRID system. Attribute values are available for each grid node, each site, and the entire grid.
StorageGRID attributes are used in a number of places in the Grid Manager:
-
Nodes page: Many of the values shown on the Nodes page are StorageGRID attributes. (Prometheus metrics are also shown on the Nodes pages.)
-
Alarms: When attributes reach defined threshold values, StorageGRID alarms (legacy system) are triggered at specific severity levels.
-
Grid Topology tree: Attribute values are shown in the Grid Topology tree (SUPPORT > Tools > Grid topology).
-
Events: System events occur when certain attributes record an error or fault condition for a node, including errors such as network errors.
Attribute values
Attributes are reported on a best-effort basis and are approximately correct. Attribute updates can be lost under some circumstances, such as the crash of a service or the failure and rebuild of a grid node.
In addition, propagation delays might slow the reporting of attributes. Updated values for most attributes are sent to the StorageGRID system at fixed intervals. It can take several minutes before an update is visible in the system, and two attributes that change more or less simultaneously can be reported at slightly different times.