

Monitor grid federation connections
 Suggest changes
You can monitor basic information about all grid federation connections, detailed information about a specific connection, or Prometheus metrics about cross-grid replication operations. You can monitor a connection from either grid.
-
You are signed in to the Grid Manager on either grid using a supported web browser.
-
You have the Root access permission for the grid you are signed in to.
View all connections
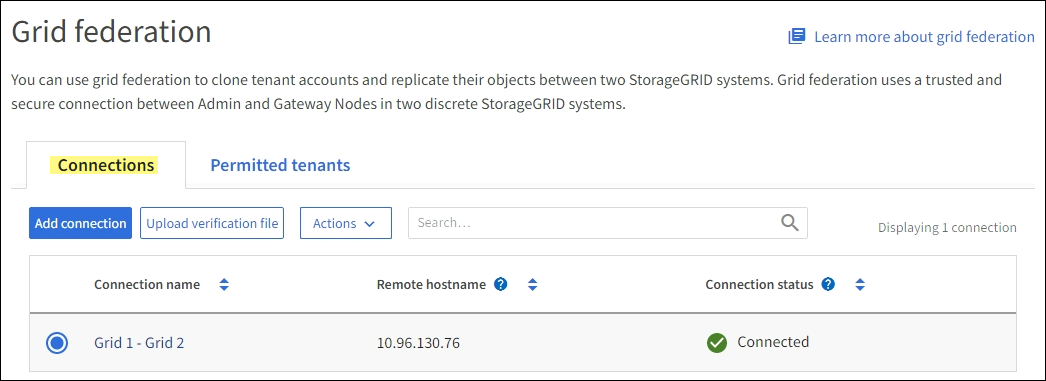
The Grid federation page shows basic information about all grid federation connections and about all tenant accounts that are permitted to use grid federation connections.
-
Select CONFIGURATION > System > Grid federation.
The Grid federation page appears.
-
To see basic information for all connections on this grid, select the Connections tab.
From this tab, you can:
-
Select an existing connection to edit or test.
-
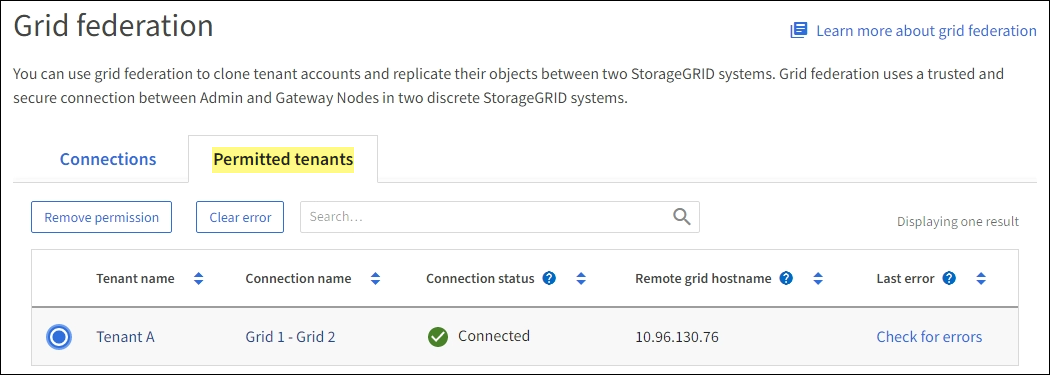
To see basic information for all tenant accounts on this grid that have the Use grid federation connection permission, select the Permitted tenants tab.
From this tab, you can:
-
View the details page for each connection. See View a specific connection.
-
Select a permitted tenant and remove the permission.
-
Check for cross-grid replication errors and clear the last error, if any. See Troubleshoot grid federation errors.
View a specific connection
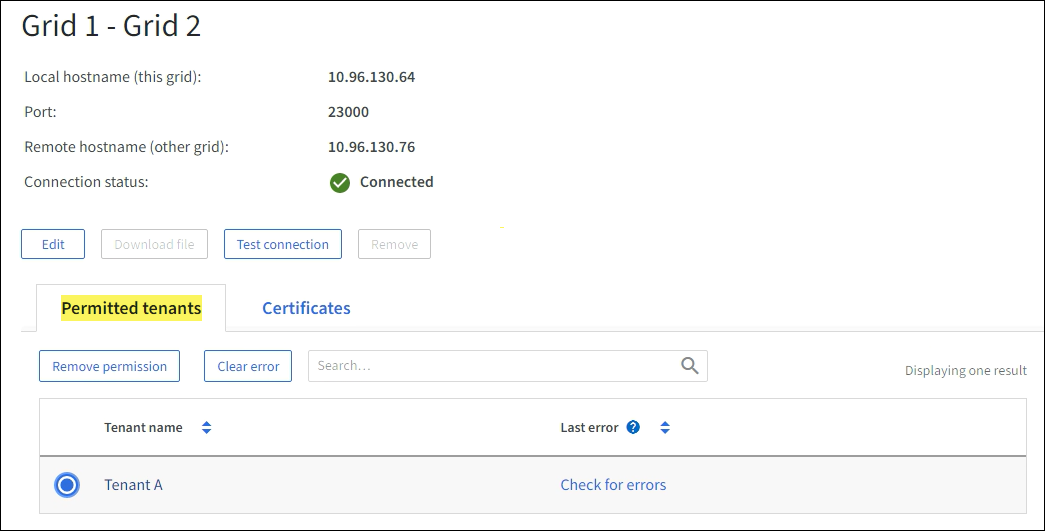
You can view details for a specific grid federation connection.
-
Select either tab from the Grid federation page and then select the connection name from the table.
From the details page for the connection, you can:
-
See basic status information about the connection, including the local and remote hostnames, port, and connection status.
-
Select a connection to edit, test, or remove.
-
-
When viewing a specific connection, select the Permitted tenants tab to view details about the permitted tenants for the connection.
From this tab, you can:
-
Remove a tenant's permission to use the connection.
-
Check for cross-grid replication errors and clear the last error. See Troubleshoot grid federation errors.
-
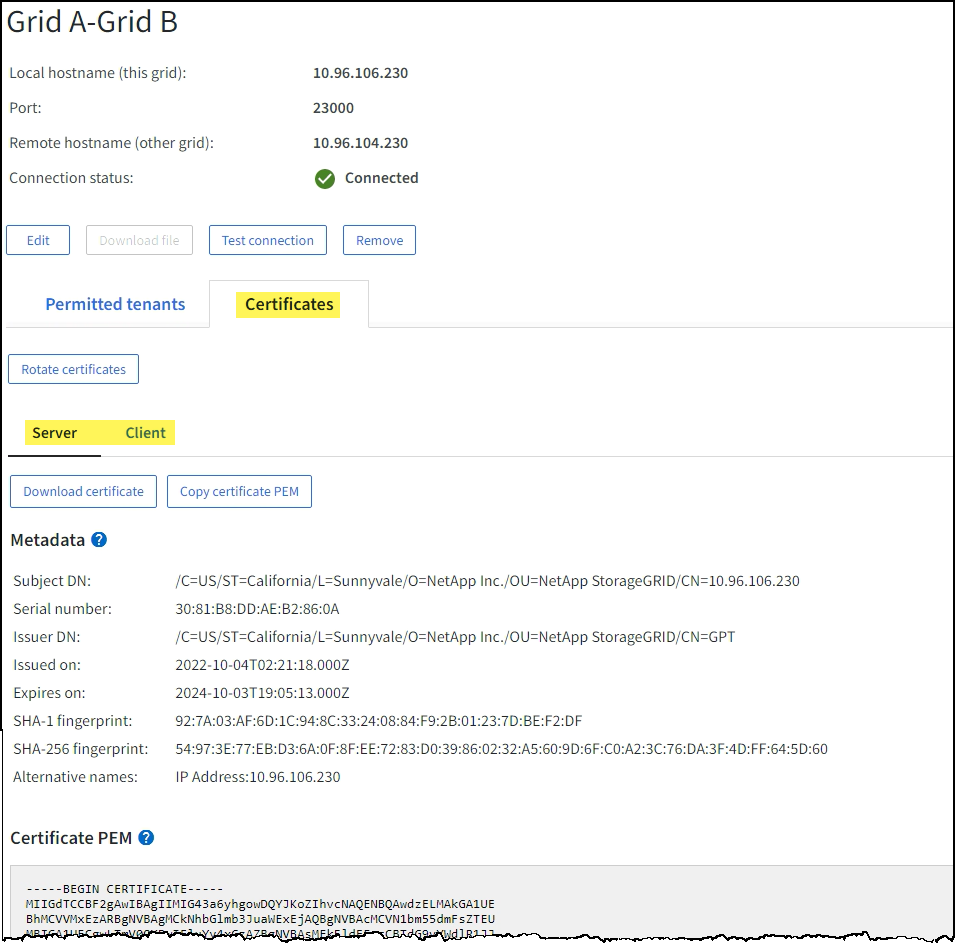
When viewing a specific connection, select the Certificates tab to view the system-generated server and client certificates for this connection.
From this tab, you can:
-
Select Server or Client to view or download the associated certificate or copy the certificate PEM.
Review cross-grid replication metrics
You can use the Cross-Grid Replication dashboard in Grafana to view Prometheus metrics about cross-grid replication operations on your grid.
-
From the Grid Manager, select SUPPORT > Tools > Metrics.

The tools available on the Metrics page are intended for use by technical support. Some features and menu items within these tools are intentionally non-functional and are subject to change. See the list of commonly used Prometheus metrics. -
In the Grafana section of the page, select Cross Grid Replication.
For detailed instructions, see Review support metrics.
-
To retry replication of objects that failed to replicate, see Identify and retry failed replication operations.