

View consumption trends of your Keystone subscriptions
 Suggest changes
You can monitor your subscription usage by viewing historical data of your Keystone subscriptions for a specific period of time. This allows you to gain valuable insights into your usage patterns.
You can view historical data of your Keystone subscriptions through the NetApp Console or Digital Advisor:
-
From the Console left navigation menu, select Storage > Keystone > Subscriptions.
-
Select the subscription number in the Subscription number column.
You are redirected to the Current consumption tab.
-
Select the Consumption trend tab.
-
Select Historical consumption from the View dropdown and choose the time range using the calendar icon in the Period field to analyze capacity usage trends.
The historical consumption data for each performance service level is displayed in a line graph based on the selected time range. If a Keystone subscription is modified or renewed, you can set the start date to a previous date to view past consumption data.

You can select Accrued burst from the View dropdown if you want to view the historical burst usage data for which invoices have been generated. You can use this data to analyze the billed usage reflected in your invoice. To learn more, refer to View accrued burst.
You can use the Forecast toggle to view projected capacity usage in the Historical consumption view and projected accrued burst in the Accrued burst view. To learn more, refer to View forecast data.
If you have subscribed to add-on services such as advanced data protection (ADP) or Data Infrastructure Insights (DII), the consumption data for these services appears alongside your base performance service levels in both historical consumption and accrued burst views. To learn more about add-on services, refer to Learn about add-on services. 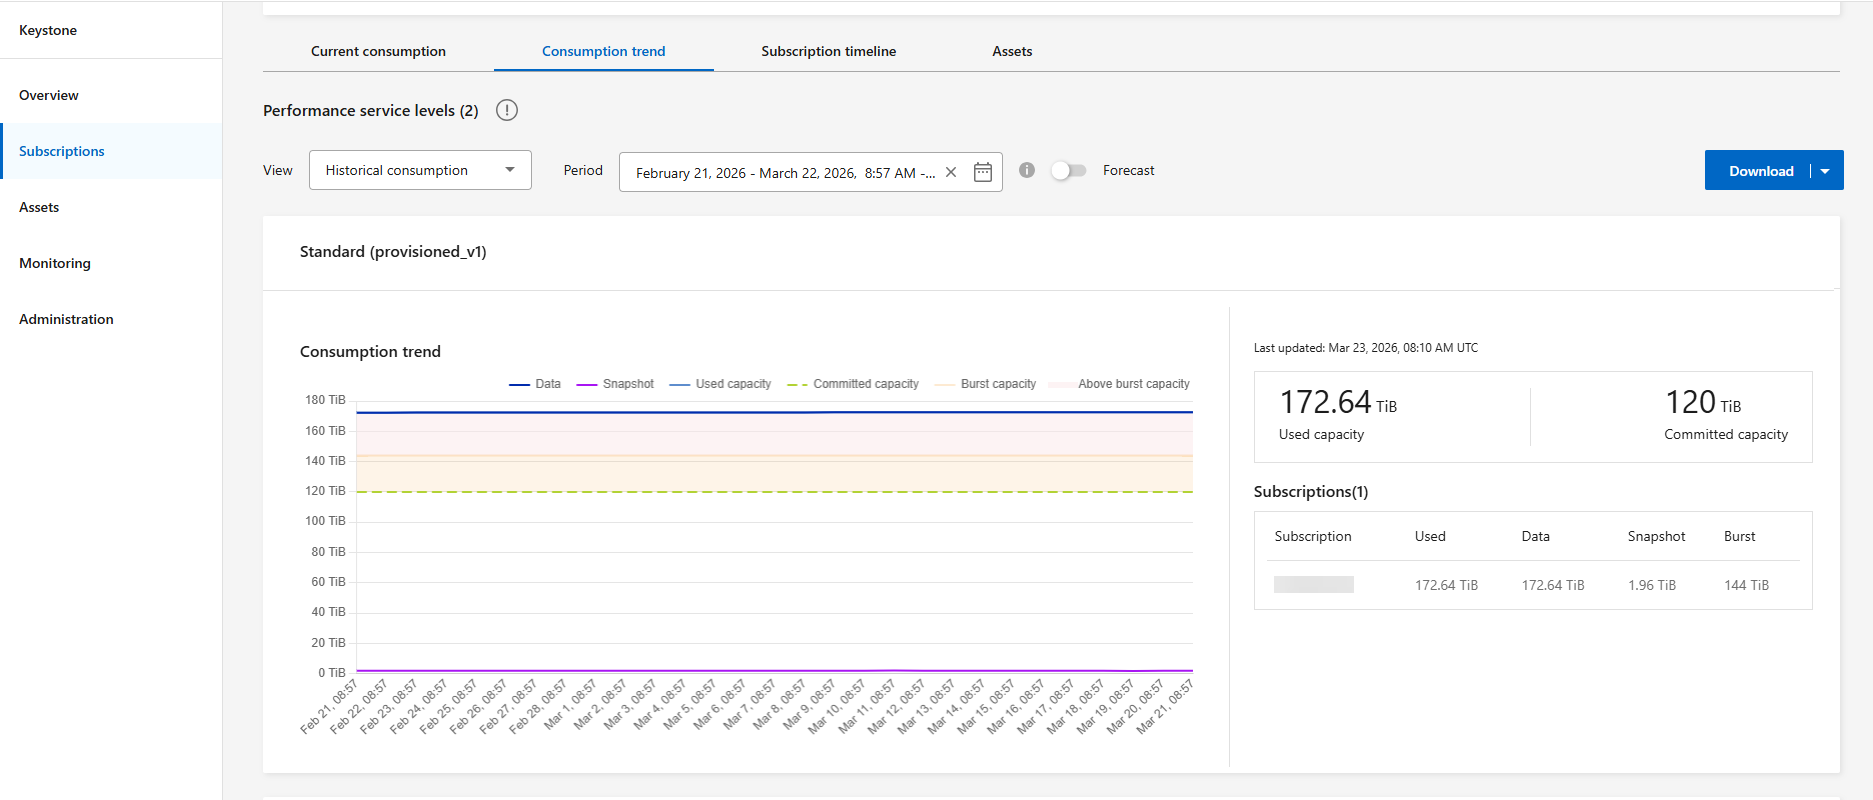
The line graph displays historical consumption data and allows users to analyze trends over a selected date range. The graph shows the following metrics:
-
Used capacity: Total storage in use, including both data and snapshot capacity.
-
Data: Storage capacity used by user data.
-
Snapshot: Storage capacity used by snapshot data.
-
Committed: The contracted committed capacity.
-
Burst capacity: The maximum allowed burst limit for your subscription.
-
Above burst capacity: Storage consumption beyond the burst limit. This metric appears only when the burst limit is exceeded.
Based on the date range of your query, the usage charts show up to 30 data collection points. You can hover your mouse cursor over the graph to view the usage breakdown at each data collection point.
The date range you select determines the level of detail shown at the bottom of the graph. For periods of 30 days or fewer, both the date and time are displayed for each data point. For periods greater than 30 days, only the date is displayed. You can also view a summary of current consumption alongside historical consumption to get a clear understanding of your usage.
-
-
Click General > Keystone Subscriptions > Consumption Trend.
-
Select the required subscription for which you want to view the details. The first subscription in your account name is selected by default.
-
Select Consumption Trend if you want to view the historical data and analyze the capacity usage trend.
You can select Invoiced Accrued Burst if you want to view the historical burst usage data for which invoices have been generated. You can use this data to analyze the billed usage reflected in your invoice. To learn more, refer to View accrued burst. -
Select the time range from the calendar icons in the From Date and To Date fields. By default, the date range is the last 30 days from today. You can change this range, but you cannot select a future date.

For optimal performance and user experience, limit the date range of your query to three months. -
Click View Details. The historical consumption data of the subscription for each performance service level is displayed based on the selected time range.
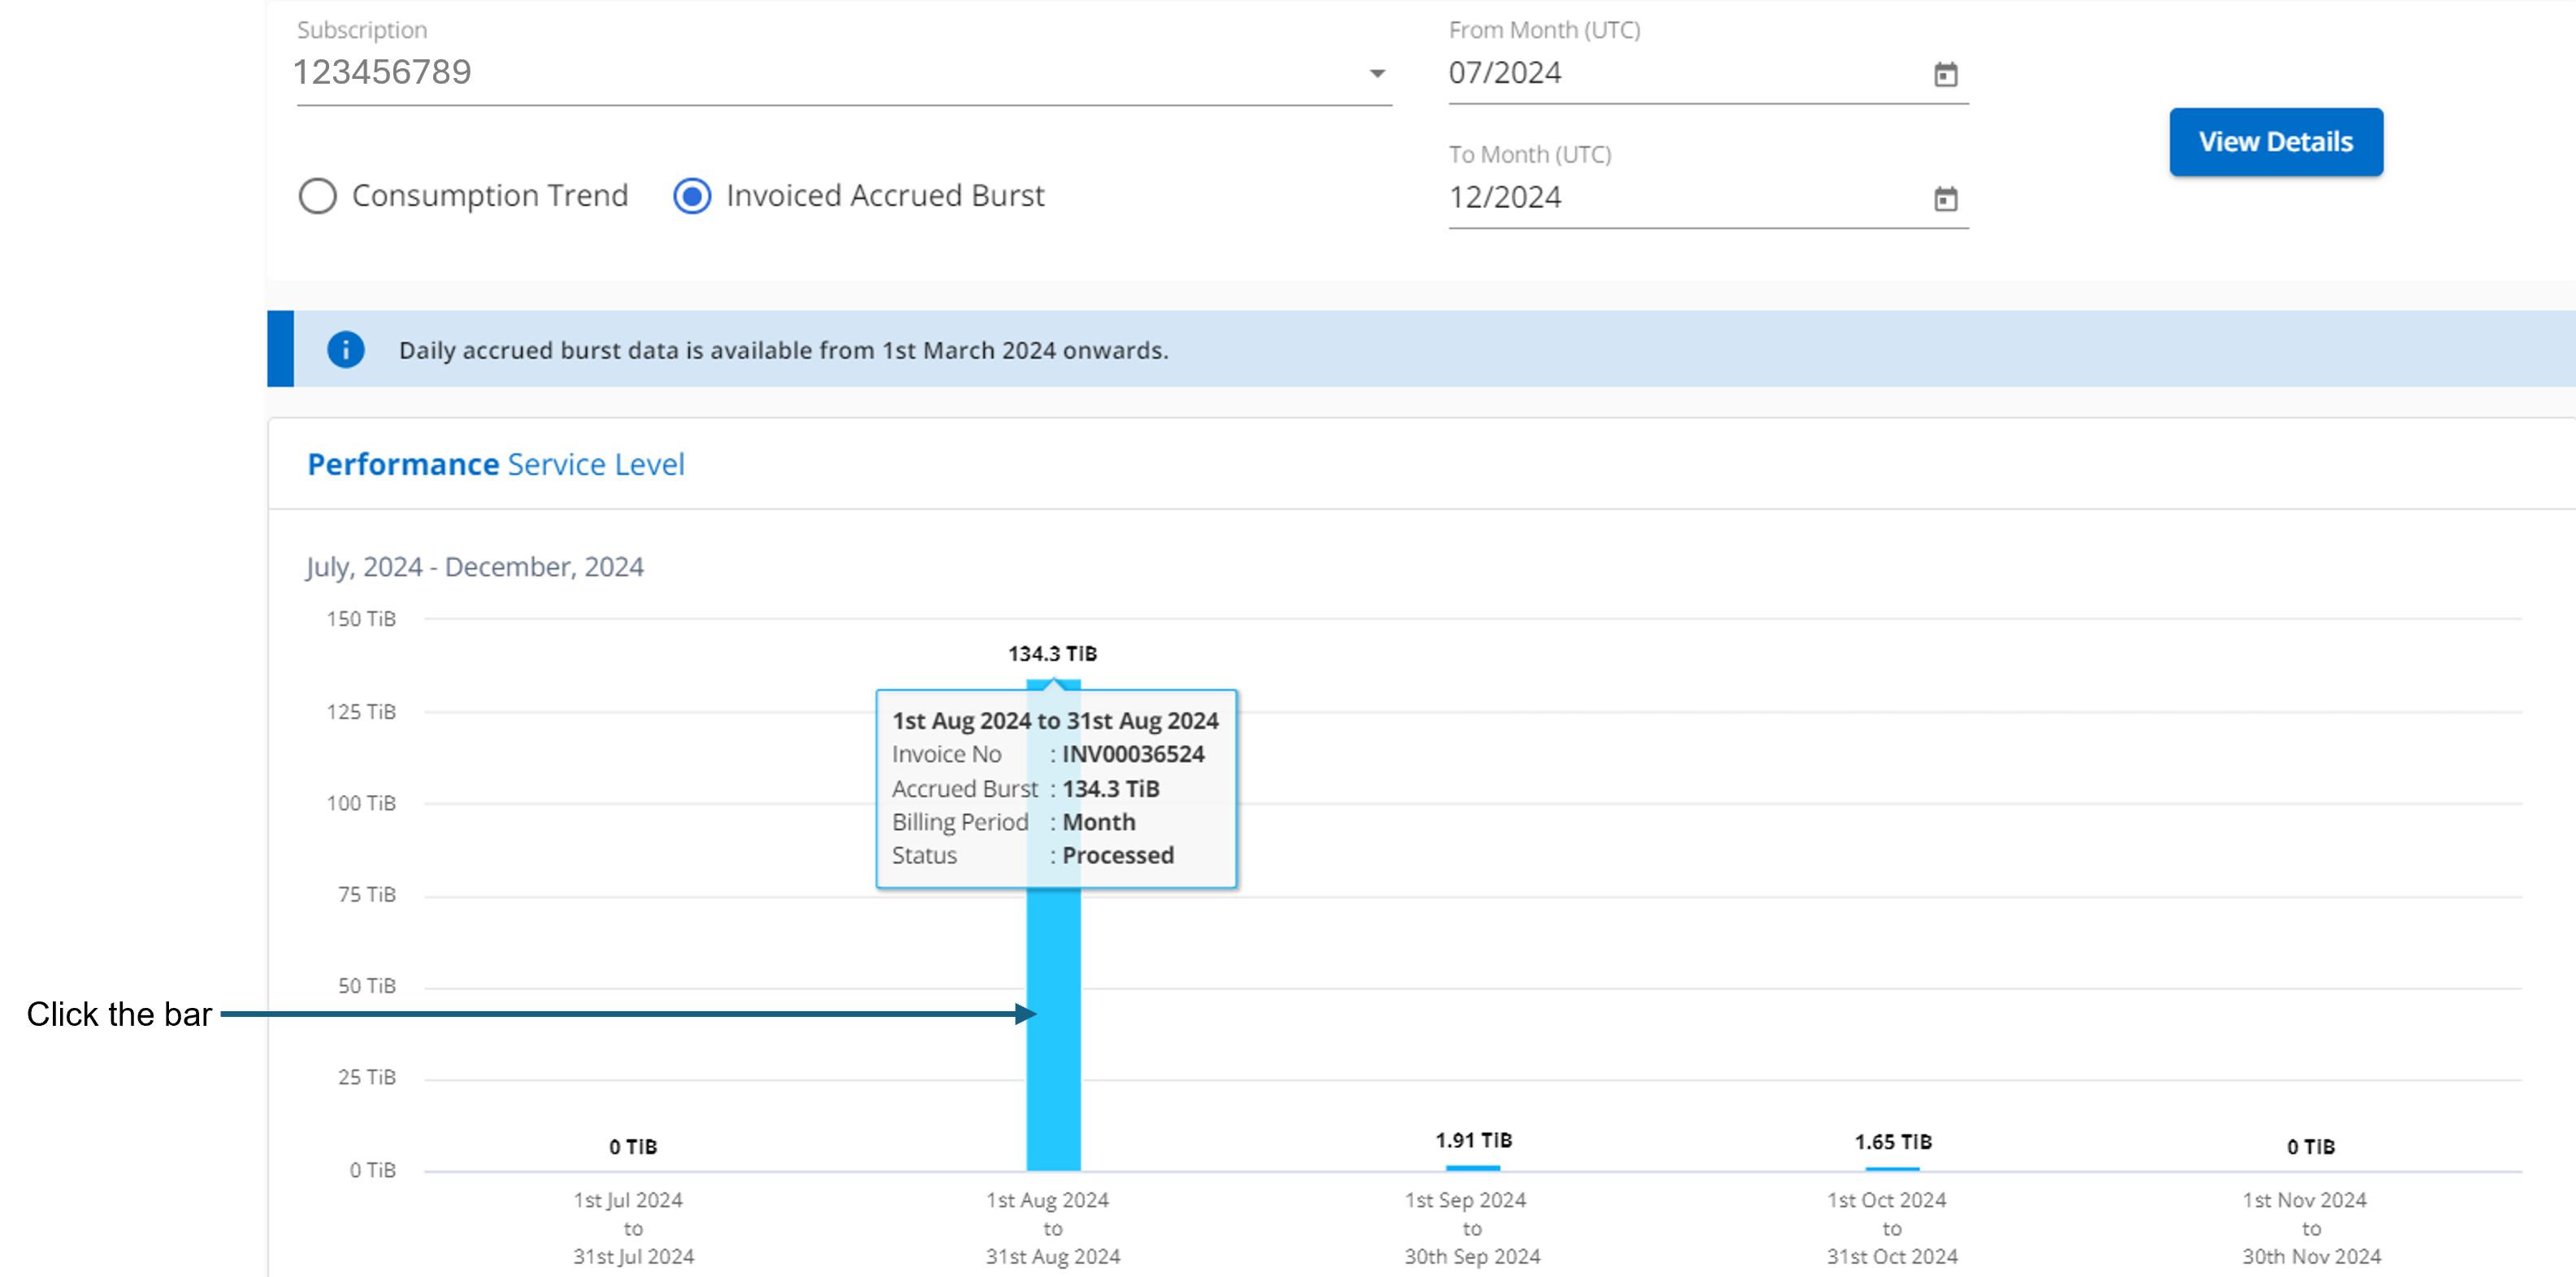
The bar charts display the performance service level name and the capacity consumed against that performance service level for the date range. The date and time of the collection are displayed at the bottom of the chart. Based on the date range of your query, the usage charts are displayed in a range of 30 data collection points. You can hover your mouse cursor over the charts to view the usage breakdown in terms of committed, consumed, burst, and above the burst limit data at that data collection point.
If you select a date range of fewer than 30 days, the chart displays one data collection point per day for only the selected days. For example, a 4-day range shows 4 data collection points, not 30. Only the date is shown at the bottom of the chart for any selected range. Timestamps are visible only when you zoom in on the chart using the zoom-in feature described below. The bar charts display short-term bursts, and you can view these bursts by using the zoom-in feature. When a short-term burst is present, it is indicated by a blue dot on the corresponding bar or directly on the x-axis if no data is consumed. To view the details, click and hold on the bar or the x-axis where the blue dot appears, then drag the cursor across the chart to select the desired time interval, and release to confirm your selection. This action zooms into the data, providing a more granular view of the capacity used at that performance service level for the selected interval. You can click the Reset Zoom button to return to the original chart view.
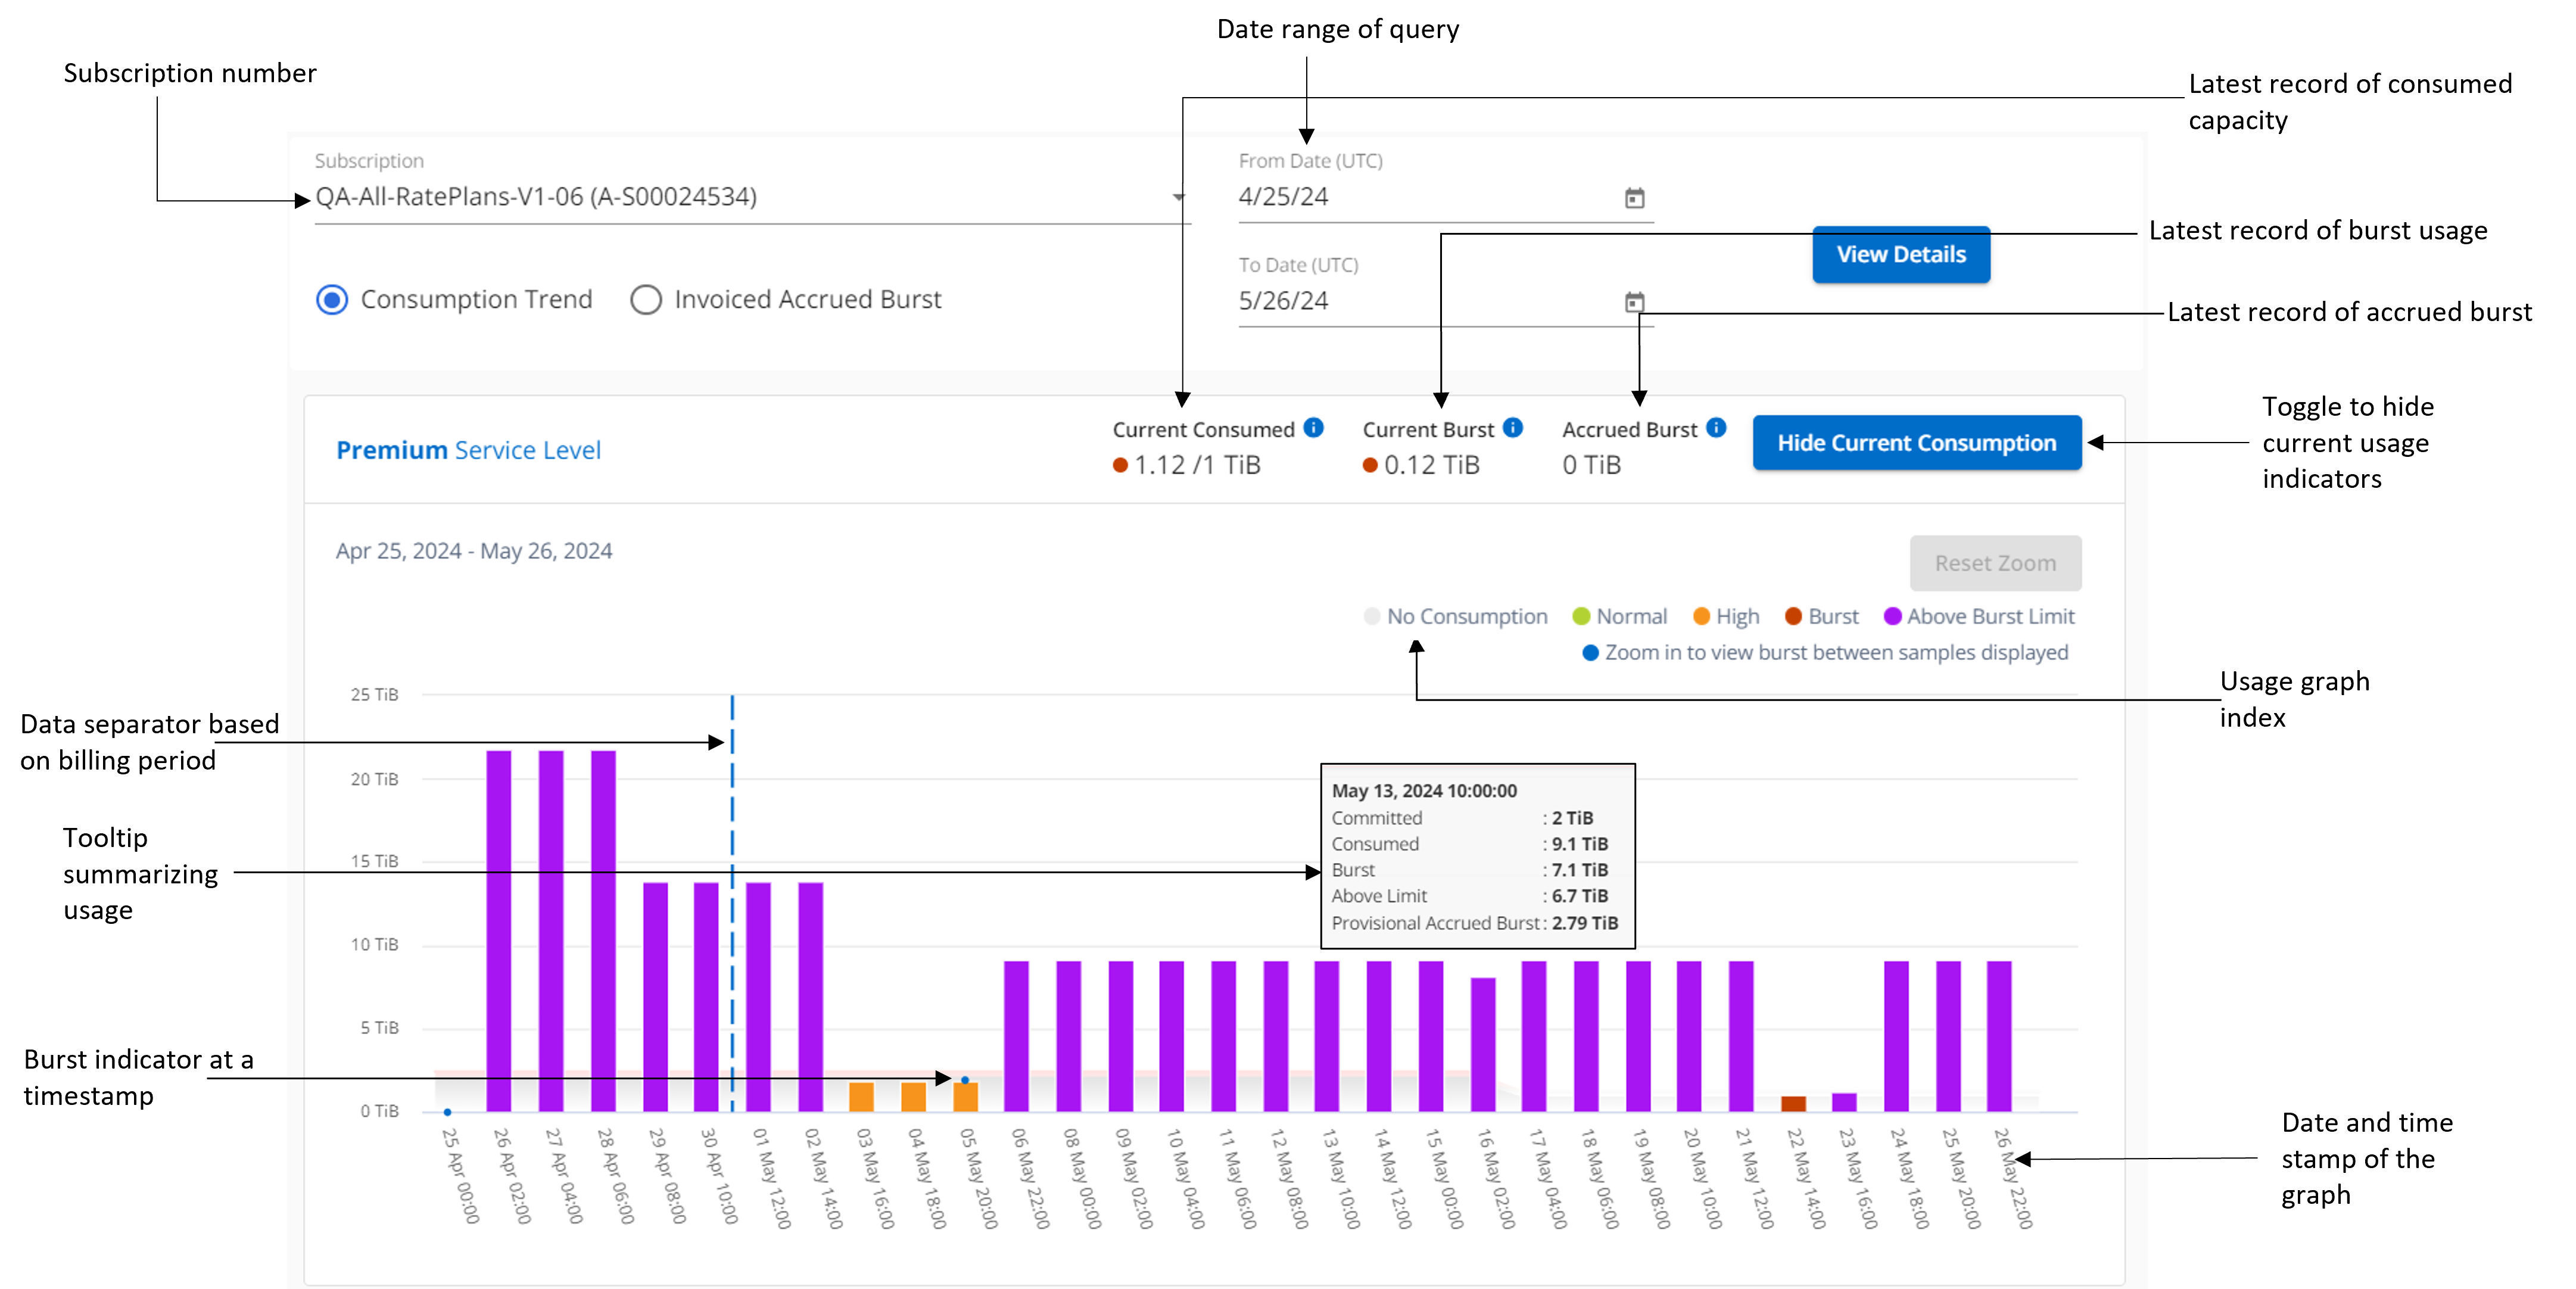
Monthly data across the charts is separated by a vertical line.
A blank chart indicates that there was no data available in your environment at that data collection point. You can click the toggle button Show Current Usage to view the consumption, burst usage, and accrued burst data for the current billing period. These details are not based on the date range of the query.
-
Current Consumed: Indicator for the consumed capacity (in TiB) defined for the performance service level. This field uses specific colors:
-
No color: Burst or above burst usage.
-
Grey: No usage.
-
Green: Within 80% of the committed capacity.
-
Amber: 80% of the committed to the burst capacity.
-
-
Current Burst: Indicator for the consumed capacity within or above the defined burst limit. Any usage within the burst limit for your subscription, for example, 20% above the committed capacity is within the burst limit. Further usage is considered as usage above the burst limit. This field displays specific colors:
-
No color: No burst usage.
-
Red: Burst usage.
-
Purple: Above the burst limit.
-
-
Accrued Burst: Indicator of the total burst capacity (in TiB) accumulated during each 2-minute interval within a month for the current billing cycle.
-
Accrued burst computation
The accrued burst usage for an entire month is calculated as this:
[sum of bursts in month / ((days in month) x 24 x 60)] x interval duration
You can calculate the accrued burst for short periods, such as every two minutes, using this:
[burst / ((days in month) x 24 x 60)] x interval duration
The burst is the difference between the consumed capacity and the committed capacity. For example, with a 30-day in month, if the consumed capacity reaches 120 TiB and the committed capacity is 100 TiB for a 2-minute interval, this results in a burst capacity of 20 TiB, equating to an accrued burst usage of 0.000925926 TiB for that interval.
View accrued burst
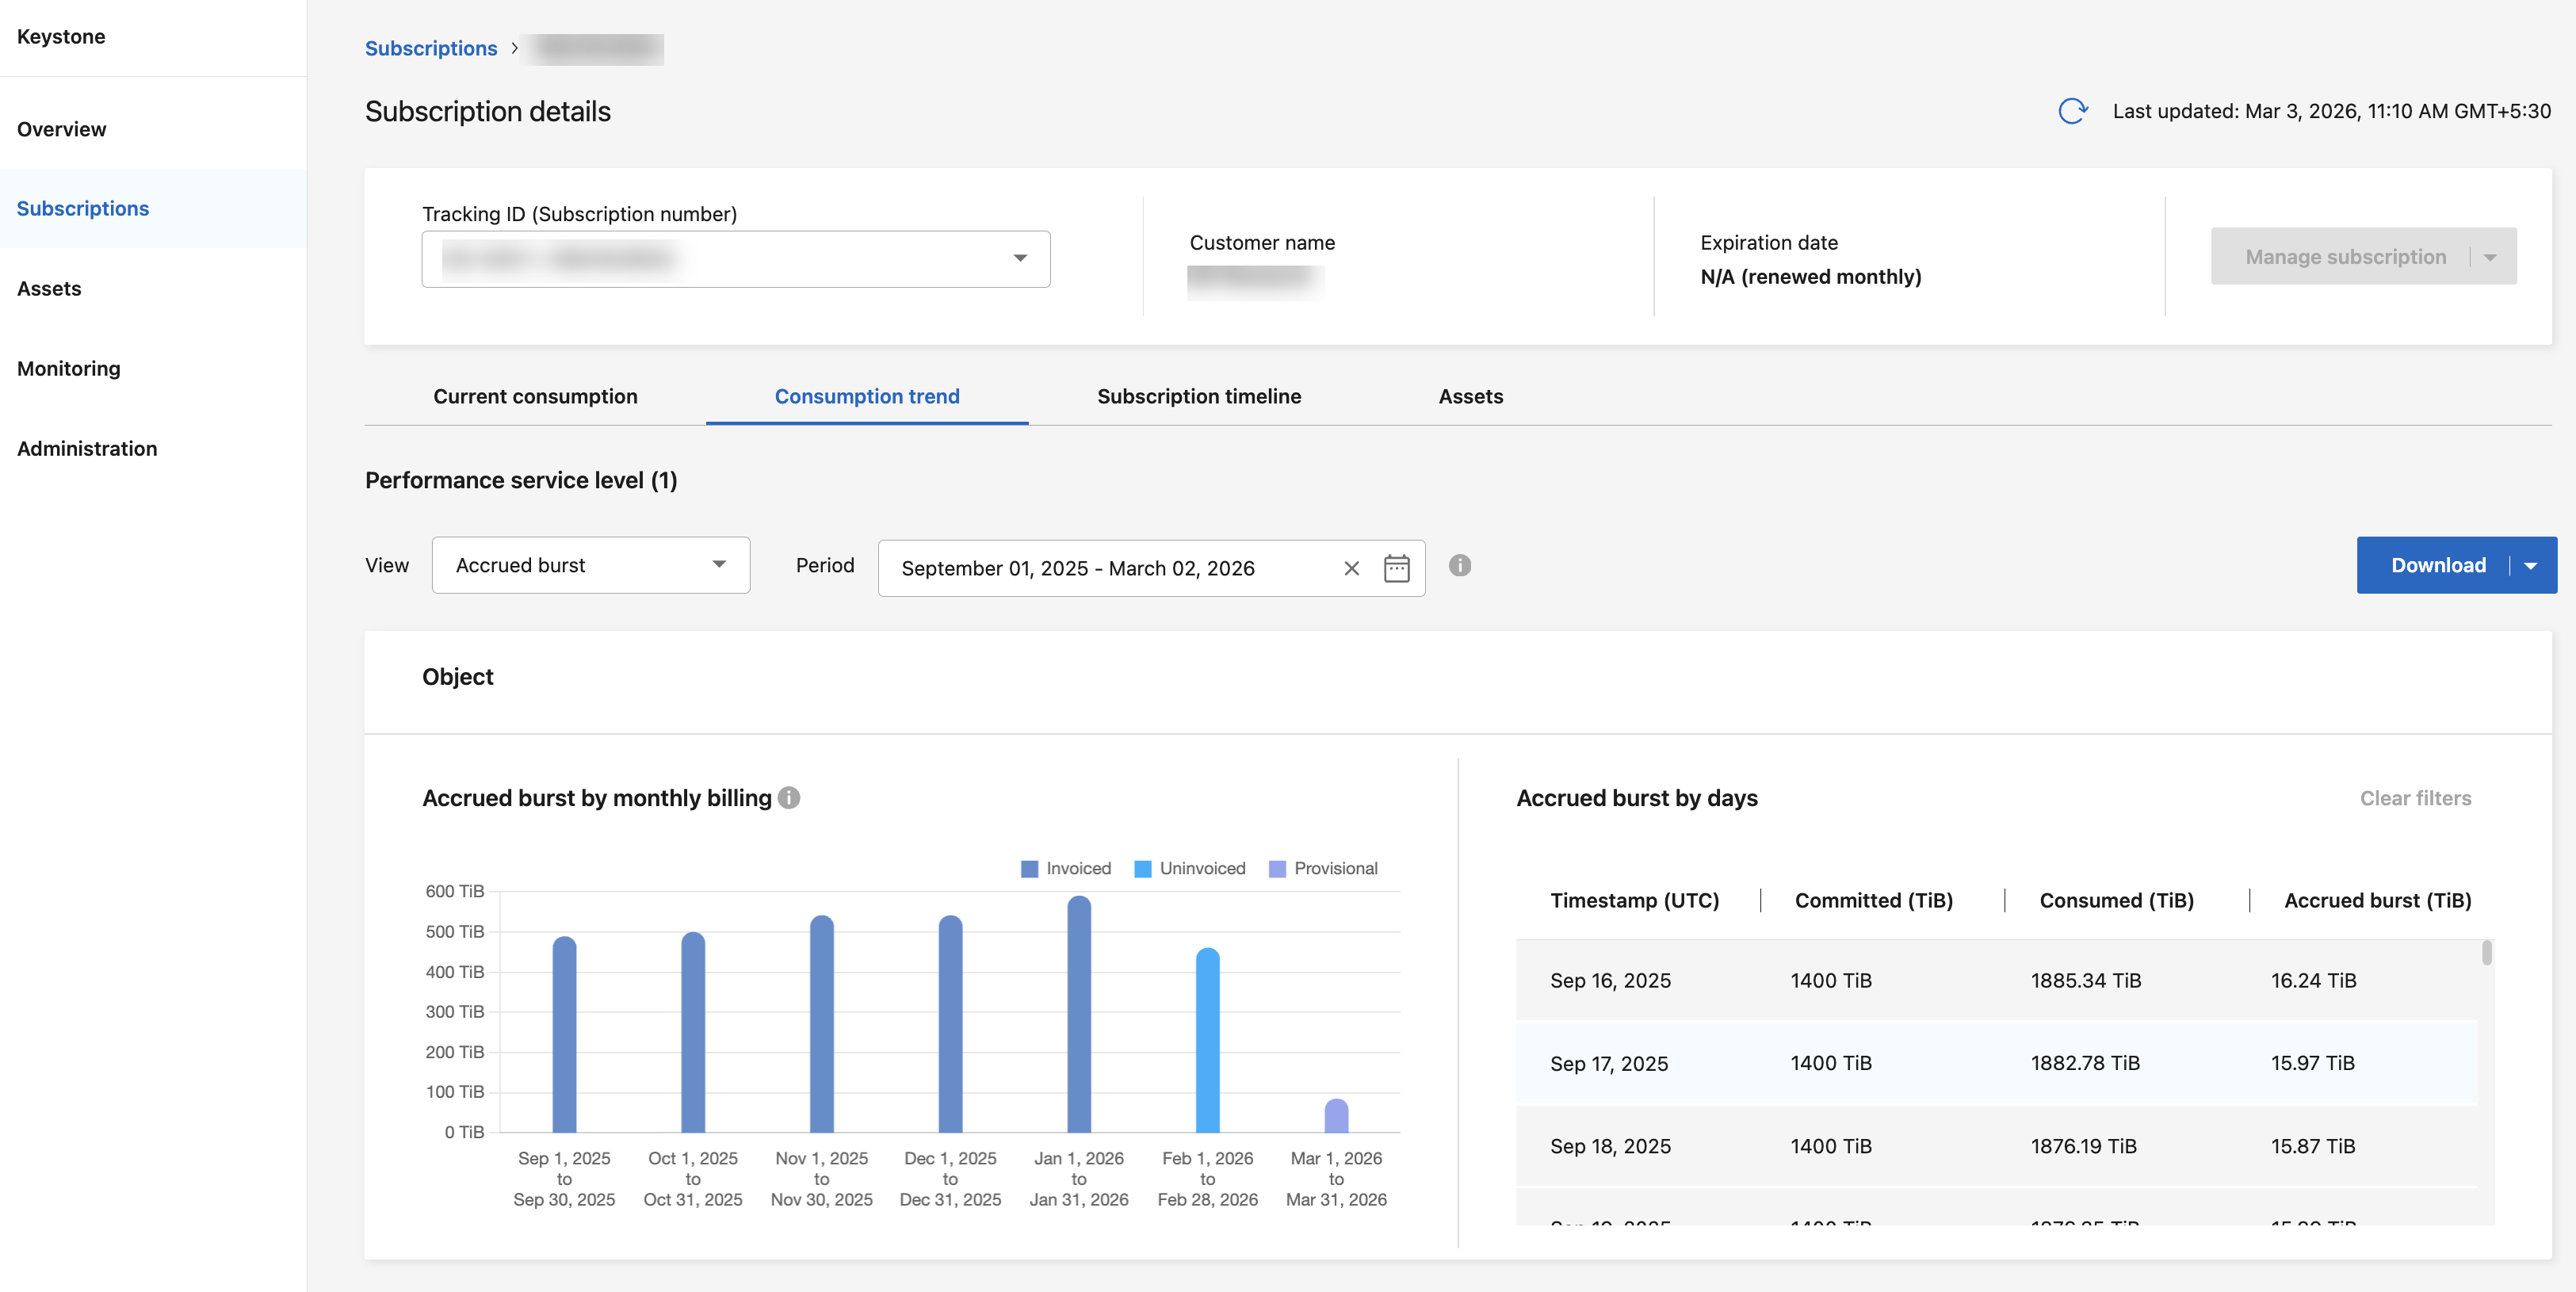
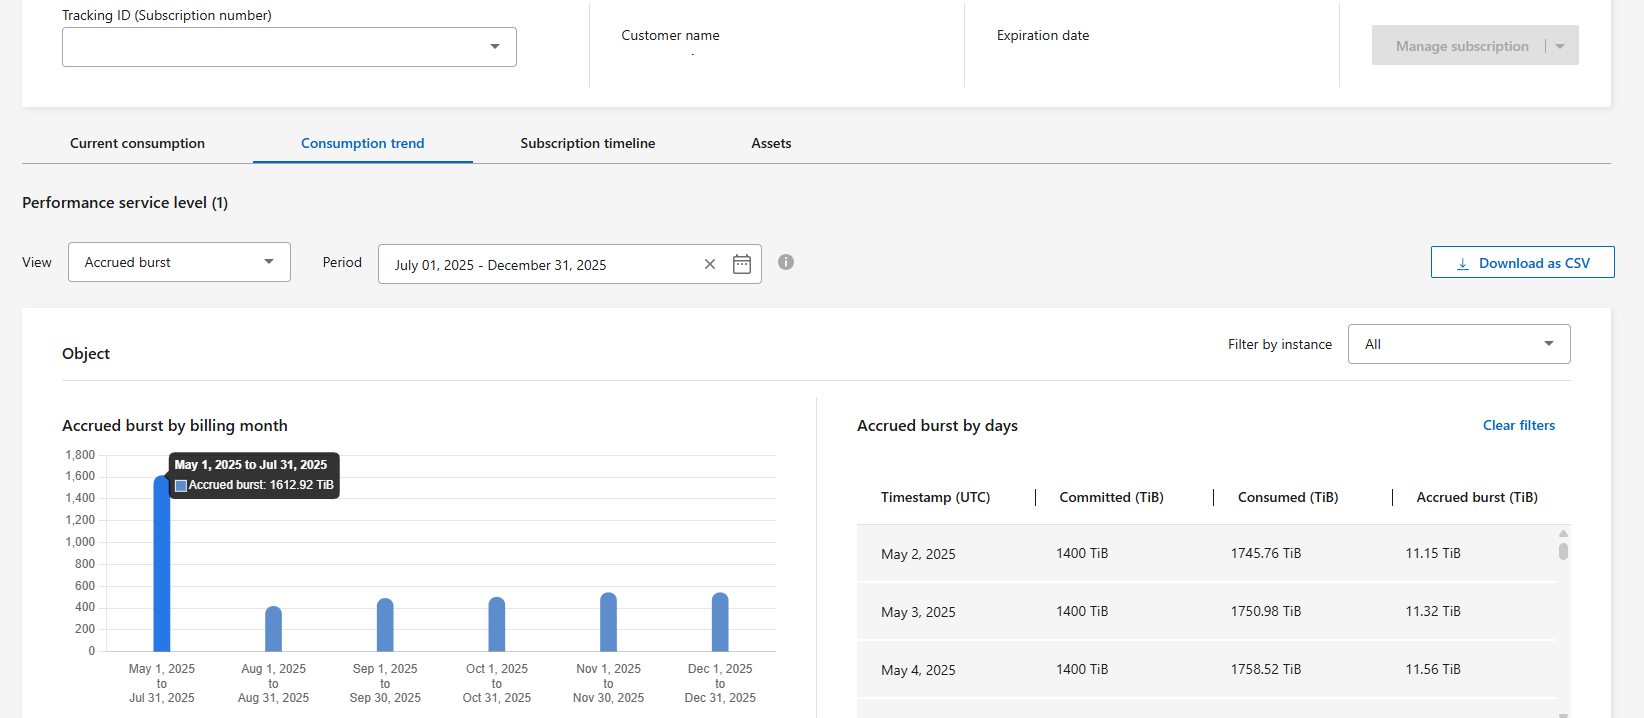
You can view the accrued burst data usage through the Console or Digital Advisor. If you have selected Accrued burst from the View dropdown in the Consumption trend tab in the Console, or the Invoiced Accrued Burst option from the Consumption Trend tab in Digital Advisor, you can see accrued burst data usage on a monthly or quarterly basis, depending on your selected billing period.
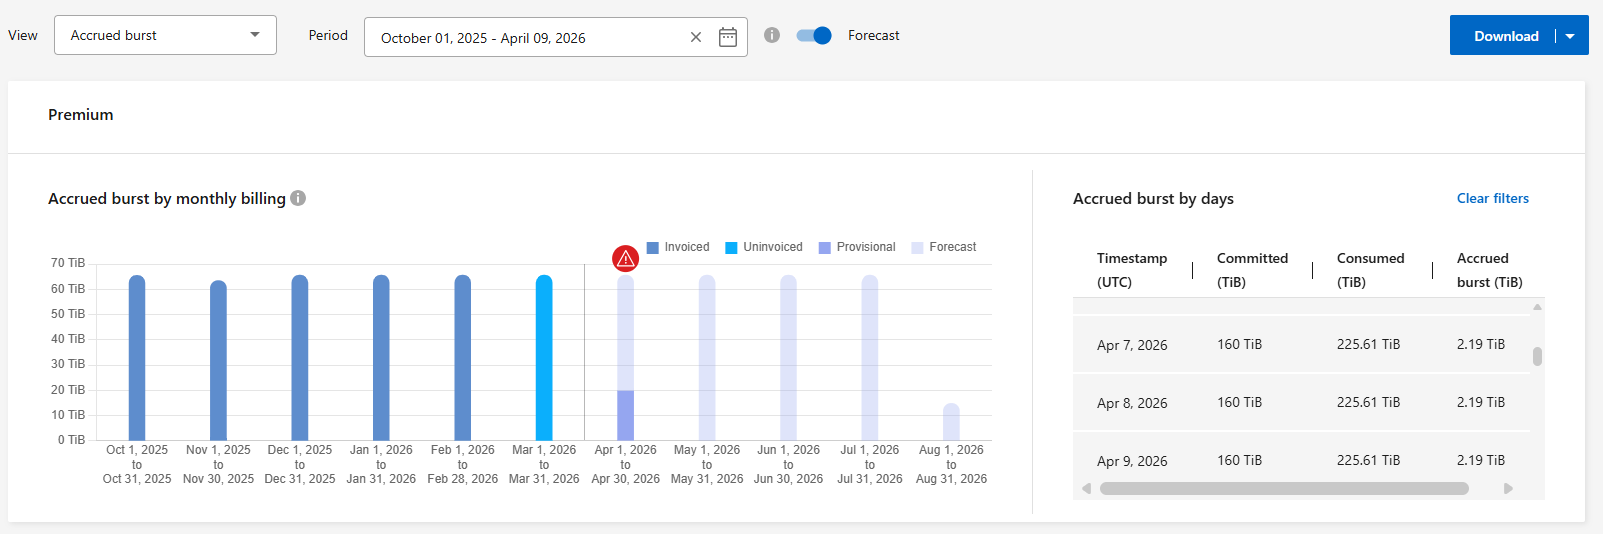
In the Console, when the Forecast toggle is disabled, you can view invoiced burst usage along with uninvoiced burst usage (accrued but not yet billed) and provisional burst usage (accrued in the current billing period and not yet invoiced). When the Forecast toggle is enabled, the graph also displays projected accrued burst usage for the next 120 days from the current date. To learn more about the Forecast toggle, refer to View forecast data.
|
|
|
For a quarterly billing period, if the subscription starts on a date other than the 1st of the month, the quarterly invoice will cover the subsequent 90-day period. For example, if your subscription starts on August 15, the invoice will be generated for the period from August 15 to October 14.
If you switch from quarterly to monthly billing, the quarterly invoice will still cover the 90-day period, with two invoices generated in the last month of the quarter: one for the quarterly billing period and another for the remaining days of that month. This transition allows the monthly billing period to start on the 1st of the following month. For example, if your subscription starts on October 15, you will receive two invoices in January—one for October 15 to January 14 and another for January 15 to 31—before the monthly billing period begins on February 1.
View forecast data
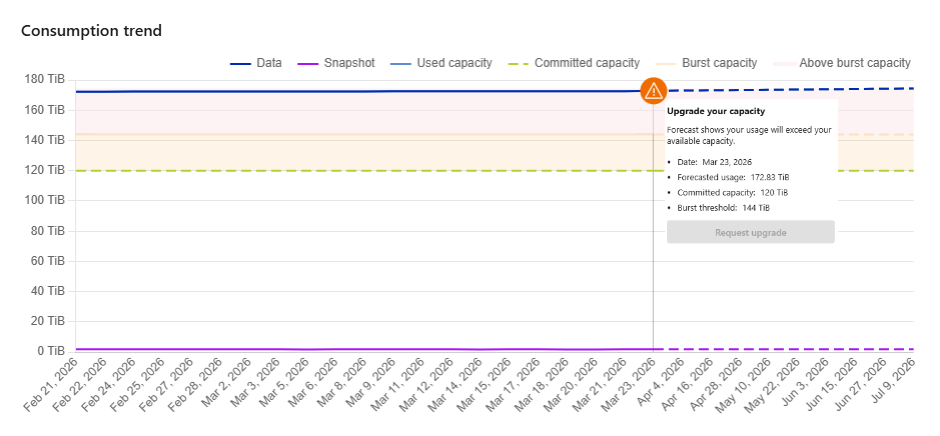
In the Console, you can use the Forecast toggle in the Consumption trend tab to view projected capacity usage in the Historical consumption view and projected accrued burst in the Accrued burst view. The toggle is enabled by default in both views.
In the Historical consumption view, the graph displays the last 30 days of historical consumption and a 120-day projection from the current date on the same chart. Up to 30 data points are plotted in total (20 for historical data and 10 for forecast data), with a vertical line separating the two segments.
In the Accrued burst view, the graph displays the last 6 months of accrued burst history and a 120-day projection from the current date, with a vertical line separating the historical and forecast data. The current billing period bar displays both provisional burst usage and forecast data for the remaining days. You can click any bar to view the day-by-day breakdown in the Accrued burst by days table. To learn more about the Accrued burst by days table, refer to View daily accrued burst data usage.
If you select a date range that does not end on the current date, the forecast is automatically disabled. To re-enable it, a confirmation dialog informs you that forecast data is available only when the selected timeline ends with the current date. If you confirm the dialog, the view resets to the default range for the selected view: the last 30 days of historical data plus the next 120 days of forecast in the Historical consumption view, or the last 6 months of accrued burst history plus the next 120 days of forecast in the Accrued burst view.
If projected consumption is expected to cross the committed capacity, an orange alert indicator appears on the graph, recommending a capacity upgrade. If it is expected to cross the burst capacity, a red alert indicator also appears, recommending a capacity upgrade.
View daily accrued burst data usage
You can view daily accrued burst data usage for a monthly or quarterly billing period through the Console or Digital Advisor. In the Console, the Accrued burst by days table provides detailed data including the timestamp, committed, consumed, and accrued burst capacity if you select Accrued burst from the View dropdown in the Consumption trend tab.
In the Console, you can filter the table by selecting any bar that represents a billing period in the accrued burst billing graph. When filtered, the table displays only the days within the selected billing period. To view the complete dataset again, use the Clear filters option. If no data is available for the selected period, a message displays indicating that no data is available.
|
|
The data shown in the graph depends on whether the Forecast toggle is enabled or disabled. |
You can also download the available data in Excel format, including burst status (invoiced, uninvoiced, provisional, or forecast, as applicable) and billing period.
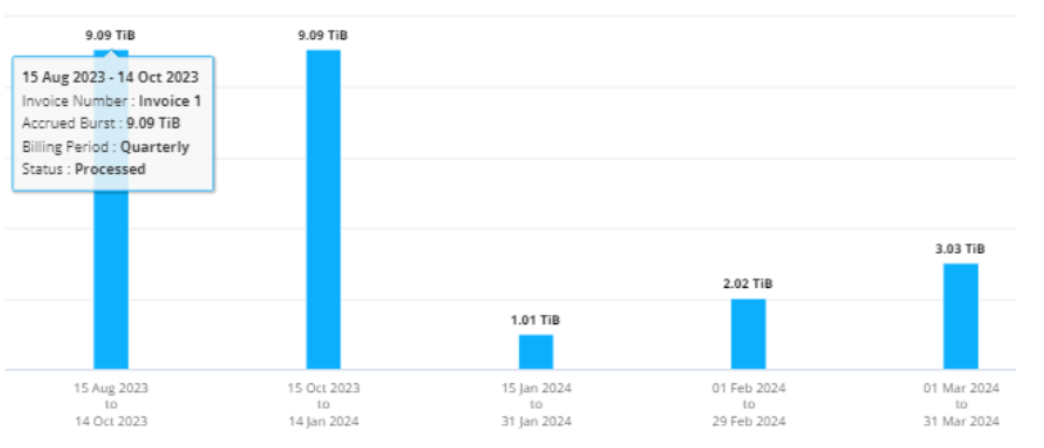
In Digital Advisor, when you click the bar that displays the invoiced data from the Invoiced Accrued Burst option, you see the Billable Provisioned Capacity section below the bar chart, offering both graph and table viewing options. The default graph view displays daily accrued burst data usage in a line graph format, showing changes in usage over time.
You can also download the data in Excel format, including burst status (invoiced, uninvoiced, or provisional) and billing period.
An example image showing daily accrued burst data usage in a line graph:
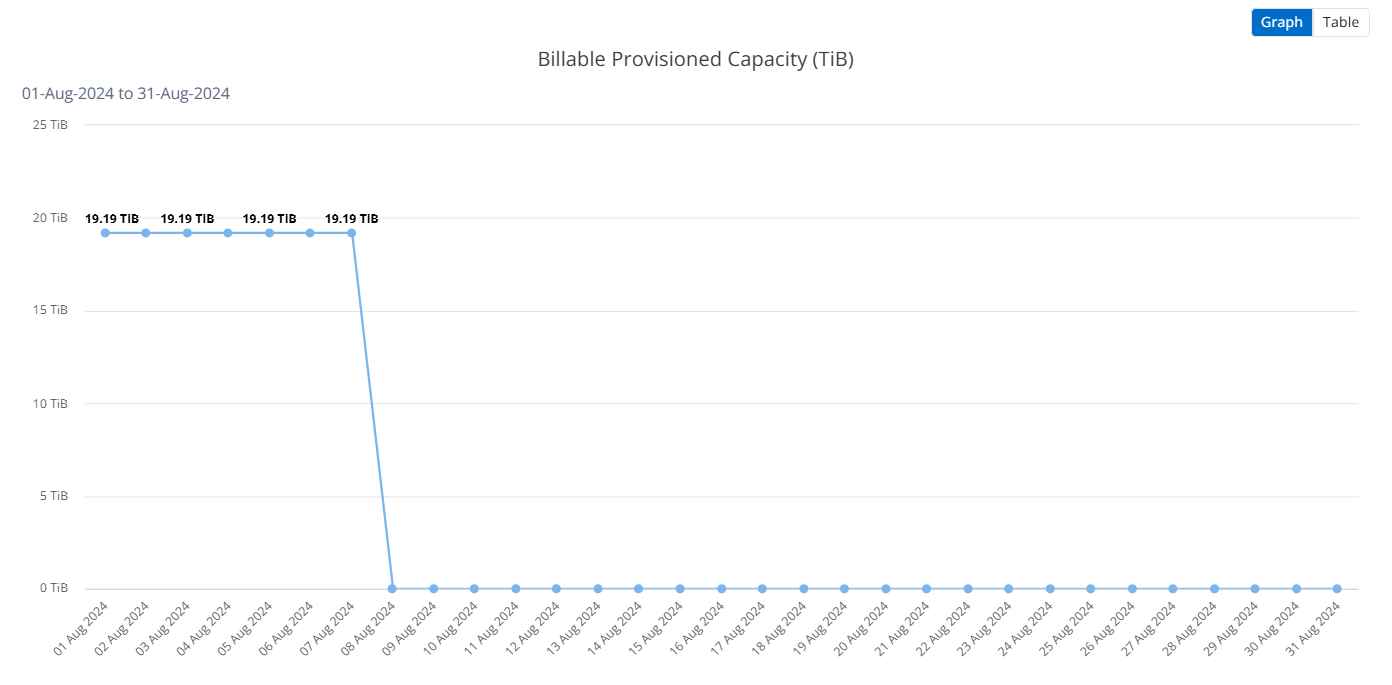
You can switch to a table view by clicking the Table option at the top right corner of the graph. The table view provides detailed daily usage metrics, including performance service level, timestamp, committed capacity, consumed capacity, and billable provisioned capacity. You can also generate a report of these details in CSV format for future use and comparison.
Related information