View and manage the dashboard
 Suggest changes


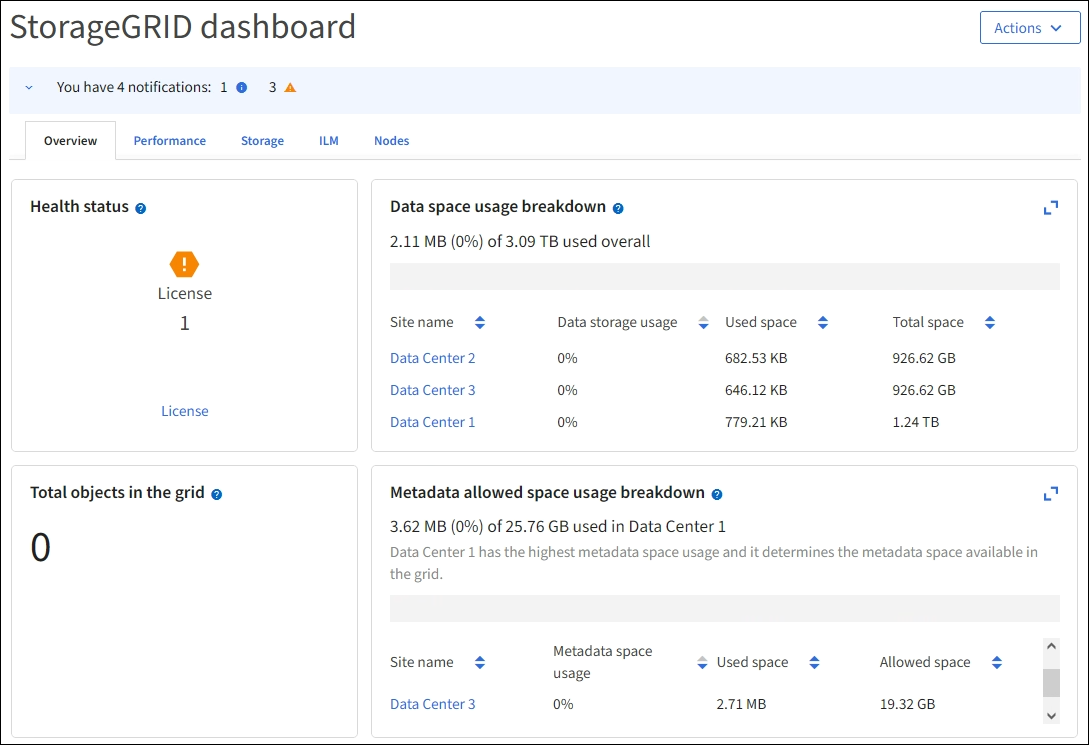
You can use the dashboard to monitor system activities at a glance. You can create custom dashboards to monitor your implementation of StorageGRID.

|
To change units for the storage values displayed in the Grid Manager, select the user drop-down in the upper right of the Grid Manager, then select User preferences. |
Your dashboard might be different based on system configuration.

View the dashboard
The dashboard consists of tabs that contain specific information about the StorageGRID system. Each tab contains categories of information displayed on cards.
You can use the system-provided dashboard as is. Additionally, you can create custom dashboards that contain only the tabs and cards that are relevant to monitoring your implementation of StorageGRID.
The system-provided dashboard tabs contain cards with the following types of information:
| Tab on system-provided dashboard | Contains |
|---|---|
Overview |
General information about the grid, such as active alerts, space usage, and total objects in the grid. |
Performance |
Space usage, storage used over time, S3 or Swift operations, request duration, error rate. |
Storage |
Tenant quota usage and logical space usage. Forecasts of space usage for user data and metadata. |
ILM |
Information lifecycle management queue and evaluation rate. |
Nodes |
CPU, data, and memory usage by node. S3 or Swift operations by node. Node to site distribution. |
Some of the cards can be maximized for easier viewing. Select the maximize icon ![]() in the upper right corner of the card. To close a maximized card, select the minimize icon
in the upper right corner of the card. To close a maximized card, select the minimize icon ![]() or select Close.
or select Close.
Manage dashboards
If you have Root access (see Admin group permissions), you can perform the following management tasks for dashboards:
-
Create a custom dashboard from scratch. You can use custom dashboards to control which StorageGRID information is displayed and how that information is organized.
-
Clone a dashboard to create custom dashboards.
-
Set an active dashboard for a user. The active dashboard can be the system-provided dashboard or a custom dashboard.
-
Set a default dashboard, which is what all users see unless they activate their own dashboard.
-
Edit a dashboard name.
-
Edit a dashboard to add or remove tabs and cards. You can have a minimum of 1 and a maximum of 20 tabs.
-
Remove a dashboard.

|
If you have any other permission besides Root access, you can only set an active dashboard. |
To manage dashboards, select Actions > Manage dashboards.

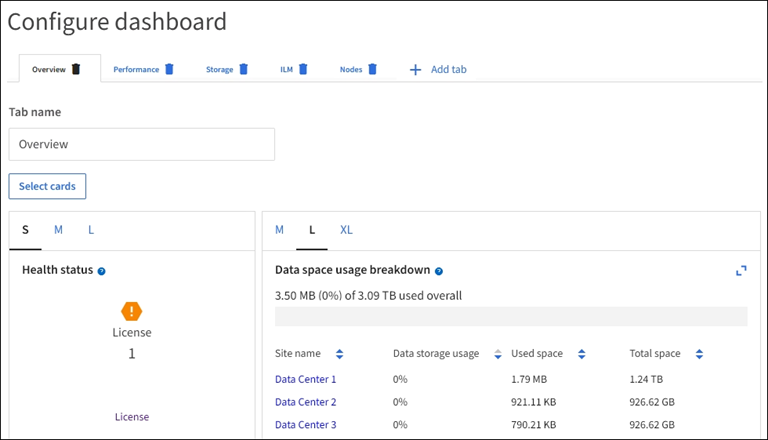
Configure dashboards
To create a new dashboard by cloning the active dashboard, select Actions > Clone active dashboard.
To edit or clone an existing dashboard, select Actions > Manage dashboards.

|
The system-provided dashboard can't be edited or removed. |
When configuring a dashboard, you can:
-
Add or remove tabs
-
Rename tabs and give new tabs unique names
-
Add, remove, or rearrange (drag) cards for each tab
-
Select the size for individual cards by selecting S, M, L or XL at the top of the card


