A newer release of this product is available.

Viewing the Dashboard

Contributors netapp-lhalbert

When you first sign in to the Grid Manager, you can use the Dashboard to monitor system activities at a glance. The Dashboard includes information about system health, usage metrics, and operational trends and charts.
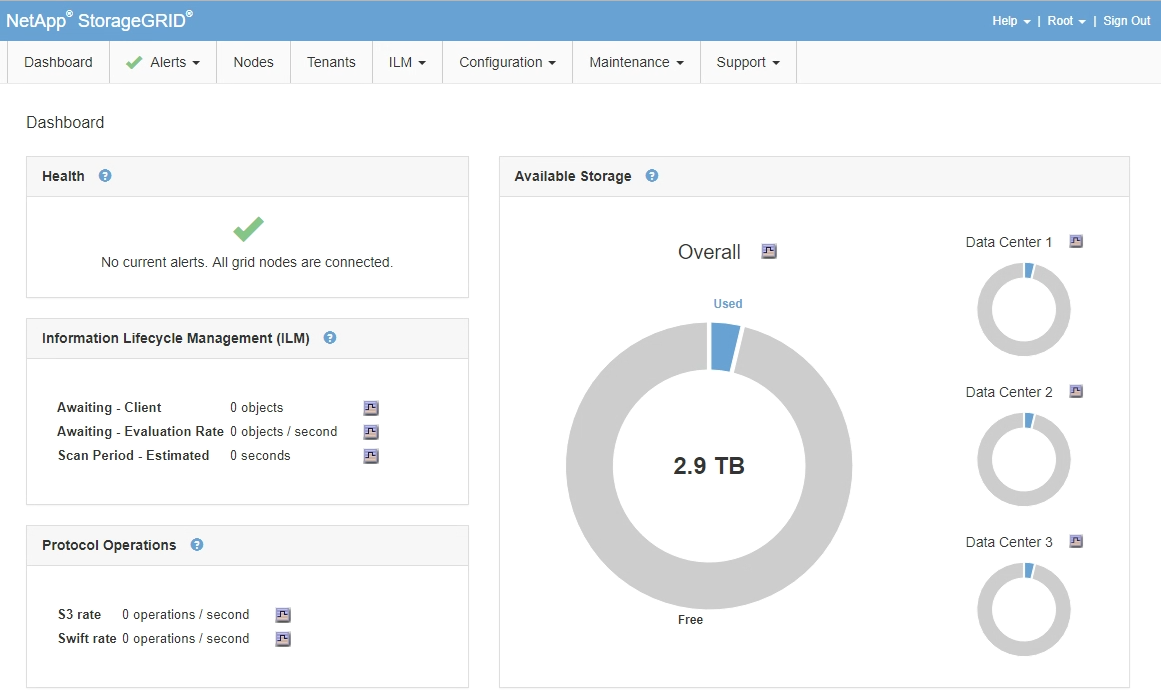
Grid Manager Dashboard

Health panel

Description View additional details Learn more

Summarizes the system's health. A green checkmark means that there are no current alerts and all grid nodes are connected. Any other icon means that there is at least one current alert or disconnected node.

You might see one or more of the following links:

  • Grid details: Appears if any nodes are disconnected (connection state Unknown or Administratively Down). Click the link, or click the blue or gray icon to determine which node or nodes are affected.

  • Current alerts: Appears if any alerts are currently active. Click the link, or click Critical, Major, or Minor to see the details on the Alerts > Current page.

  • Recently resolved alerts: Appears if any alerts triggered in the past week are now resolved. Click the link to see the details on the Alerts > Resolved page.

  • Legacy alarms: Appears if any alarms (legacy system) are currently active. Click the link to see the details on the Support > Alarms (Legacy) > Current Alarms page.

  • License: Appears if there is an issue with the software license for this StorageGRID system. Click the link to see the details on the Maintenance > System > License page.

Available Storage panel

Description View additional details Learn more

Displays the available and used storage capacity in the entire grid, not including archival media.

The Overall chart presents grid-wide totals. If this is a multi-site grid, additional charts appear for each data center site.

You can use this information to compare the used storage with the available storage. If you have a multi-site grid, you can determine which site is consuming more storage.

  • To view the capacity, place your cursor over the chart's available and used capacity sections.

  • To view capacity trends over a date range, click the chart icon Chart Icon for the overall grid, or for a data center site.

  • To see details, select Nodes. Then, view the Storage tab for the entire grid, an entire site, or a single Storage Node.

Information Lifecycle Management (ILM) panel

Description View additional details Learn more

Displays current ILM operations and ILM queues for your system. You can use this information to monitor your system's workload.

  • Awaiting - Client: The total number of objects awaiting ILM evaluation from client operations (for example, ingest).

  • Awaiting - Evaluation Rate: The current rate at which objects are evaluated against the ILM policy in the grid.

  • Scan Period - Estimated: The estimated time to complete a full ILM scan of all objects. Note: A full scan does not guarantee that ILM has been applied to all objects.

  • To see details, select Nodes. Then, view the ILM tab for the entire grid, an entire site, or a single Storage Node.

  • To see the existing ILM rules, select ILM > Rules.

  • To see the existing ILM policies, select ILM > Policies.

Protocol Operations panel

Description View additional details Learn more

Displays the number of protocol-specific operations (S3 and Swift) performed by your system.

You can use this information to monitor your system's workloads and efficiencies. Protocol rates are averaged over the last two minutes.

  • To see details, select Nodes. Then, view the Objects tab for the entire grid, an entire site, or a single Storage Node.

  • To view trends over a date range, click the chart icon Chart Icon to the right of the S3 or Swift protocol rate.