View and manage the dashboard
 Suggest changes
You can use the dashboard to monitor system activities at a glance. You can create custom dashboards to monitor your implementation of StorageGRID.

|
To change units for the storage values displayed in the Grid Manager, select the user drop-down in the upper right of the Grid Manager, then select User preferences. |
View the dashboard
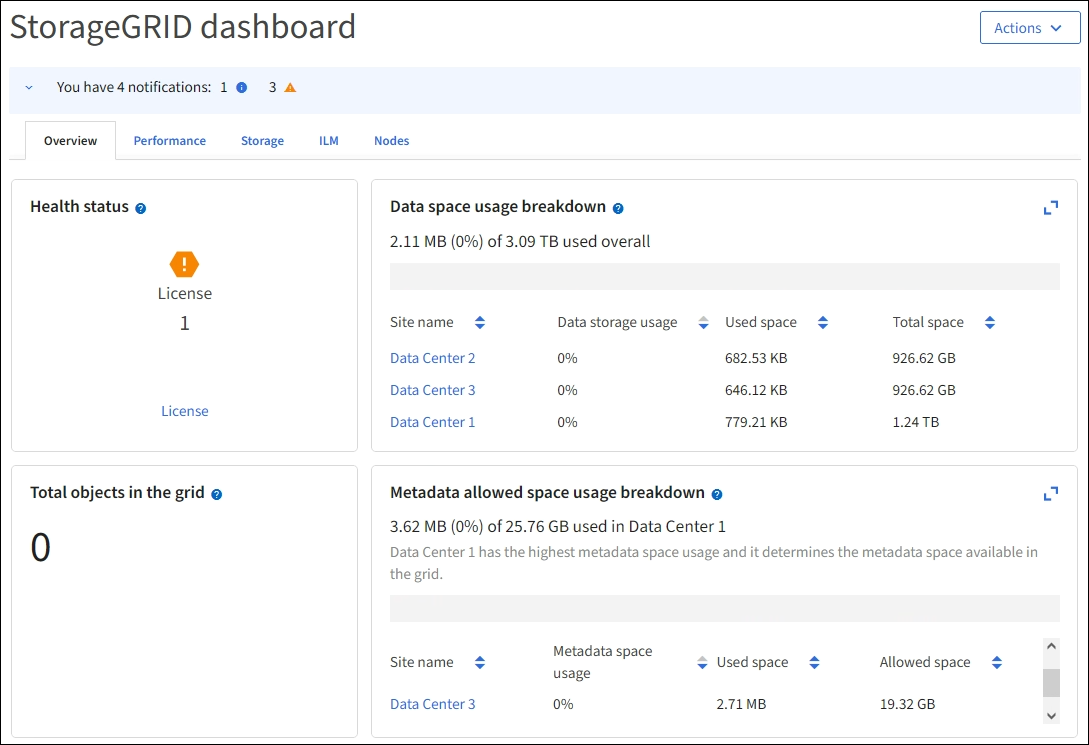
The dashboard consists of tabs that contain specific information about the StorageGRID system. Each tab contains categories of information displayed on cards.
You can use the system-provided dashboard as is. Additionally, you can create custom dashboards that contain only the tabs and cards that are relevant to monitoring your implementation of StorageGRID.
The system-provided dashboard tabs contain cards with the following types of information:
| Tab on system-provided dashboard | Contains |
|---|---|
Overview |
General information about the grid, such as active alerts, space usage, and total objects in the grid. |
Performance |
Space usage, storage used over time, S3 or Swift operations, request duration, error rate. |
Storage |
Tenant quota usage and logical space usage. Forecasts of space usage for user data and metadata. |
ILM |
Information lifecycle management queue and evaluation rate. |
Nodes |
CPU, data, and memory usage by node. S3 or Swift operations by node. Node to site distribution. |
Some of the cards can be maximized for easier viewing. Select the maximize icon ![]() in the upper right corner of the card. To close a maximized card, select the minimize icon
in the upper right corner of the card. To close a maximized card, select the minimize icon ![]() or select Close.
or select Close.
Manage dashboards
If you have Root access (see Admin group permissions), you can perform the following management tasks for dashboards:
-
Create a custom dashboard from scratch. You can use custom dashboards to control which StorageGRID information is displayed and how that information is organized.
-
Clone a dashboard to create custom dashboards.
-
Set an active dashboard for a user. The active dashboard can be the system-provided dashboard or a custom dashboard.
-
Set a default dashboard, which is what all users see unless they activate their own dashboard.
-
Edit a dashboard name.
-
Edit a dashboard to add or remove tabs and cards. You can have a minimum of 1 and a maximum of 20 tabs.
-
Remove a dashboard.
|
|
If you have any other permission besides Root access, you can only set an active dashboard. |
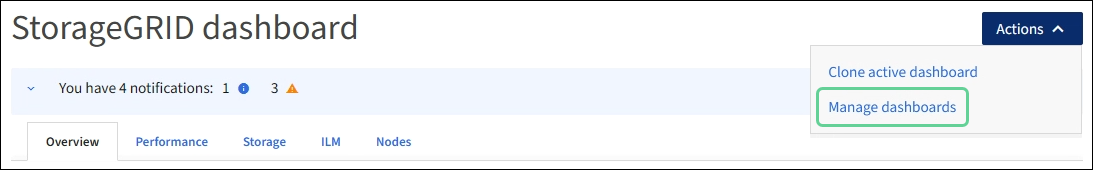
To manage dashboards, select Actions > Manage dashboards.
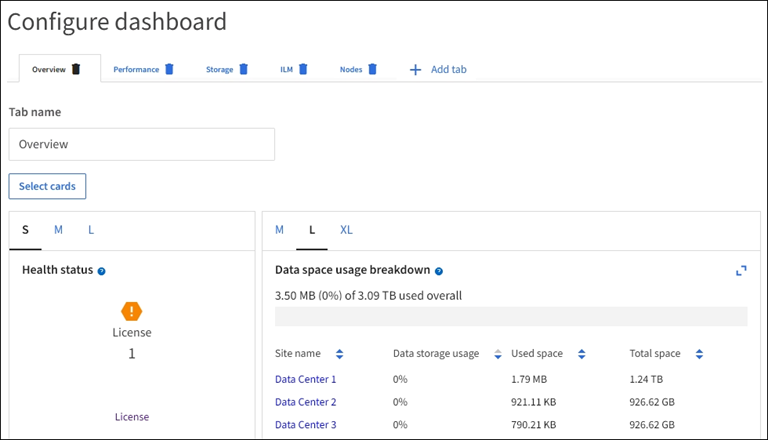
Configure dashboards
To create a new dashboard by cloning the active dashboard, select Actions > Clone active dashboard.
To edit or clone an existing dashboard, select Actions > Manage dashboards.
|
|
The system-provided dashboard can't be edited or removed. |
When configuring a dashboard, you can:
-
Add or remove tabs
-
Rename tabs and give new tabs unique names
-
Add, remove, or rearrange (drag) cards for each tab
-
Select the size for individual cards by selecting S, M, L or XL at the top of the card