

Create custom monitoring applications
 Suggest changes
You can build custom monitoring applications and dashboards using the StorageGRID metrics available from the Grid Management API.
If you want to monitor metrics that aren't displayed on an existing page of the Grid Manager, or if you want to create custom dashboards for StorageGRID, you can use the Grid Management API to query StorageGRID metrics.
You can also access Prometheus metrics directly with an external monitoring tool, such as Grafana. Using an external tool requires that you upload or generate an administrative client certificate to allow StorageGRID to authenticate the tool for security. See the instructions for administering StorageGRID.
To view the metrics API operations, including the complete list of the metrics that are available, go to the Grid Manager. From the top of the page, select the help icon and select API documentation > metrics. 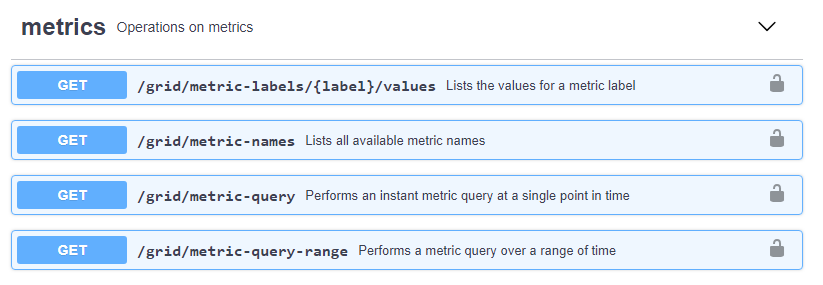
The details of how to implement a custom monitoring application are beyond the scope of this documentation.