


Recent changes in NetApp Workload Factory
![iebuild[bot]](https://avatars.githubusercontent.com/in/311455?v=4)


 Suggest changes

 PDFs
PDFs
Learn about the most recent changes to the workloads that are part of NetApp Workload Factory.
04 October 2026
Setup and administration
Custom dashboard updates
Custom dashboards now make it easier to manage your work.
You can edit dashboards directly from the catalog, including metrics, charts, and time ranges.
When you edit a dashboard, Workload Factory reopens the chat with your previous prompts and messages. You can then update the dashboard, save your changes, or restore the previous version.
Only the dashboard creator can edit the dashboard. While you are editing, other users cannot see your changes until you save them.
The dashboard catalog now includes more filters to help you quickly find dashboards based on category and status.
If your administrator disables AI features or your monthly credit limit is reached, dashboard creation and editing are disabled.
30 September 2026
Amazon FSx for NetApp ONTAP
Expanded workload tagging discovery for AWS services
Workload Factory now detects more AWS services for workload tagging, expanding support for resources that can be tagged. It can now find Amazon EKS and Amazon WorkSpaces resources and include them in the tagging system so they are available for tagging.
Cost dashboard enhancements
The cost dashboard now includes a cost executive summary section that provides an overview of your organization's spending, helping you quickly understand and manage costs. Ask Me, the AI assistant for Workload Factory, can provide additional insights and recommendations based on your cost data. You can interact with Ask Me to get detailed explanations and suggestions for optimizing your costs.
In addition, you can filter the cost data by one or more file systems and one or more volumes within a file system. When filters are applied, Workload Factory displays:
-
Estimated total cost per month
-
Estimated cost per GiB/month
-
Detailed cost breakdown by service
All cost information comes directly from the AWS Cost Explorer API except for file system and volume-level cost allocation; Workload Factory estimates file system- and volume-level cost allocation.
Well-architected dashboard access
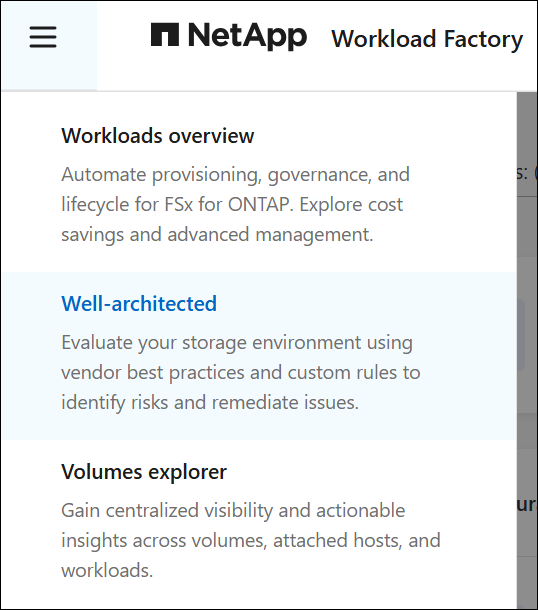
You can access the well-architected dashboard from the main menu in the Workload Factory console and from within a file system. To find the well-architected dashboard from the main menu, select the main menu and then select Well-architected.
New recommendations in the well-architected analysis
Workload Factory now includes the following configurations in the well-architected analysis for FSx for ONTAP file systems:
-
Volume space management configuration: recommends enabling coordinated volume space management for FSx for ONTAP volumes.
-
FSx integration to AWS MGN: recommends applying the required AWS MGN readiness configuration to selected FSx for ONTAP file systems.
Volumes explorer enhancements
Volumes explorer is a central place in the Workload Factory console where you can view and manage all your volumes across different file systems. It provides detailed information about each volume, including its performance, usage, and protection status. The enhancements for this release include workload selection, volume latency display, and ARP/AI status for volumes.
Volumes explorer supports workload selection
Workload Factory selects a workload by default based on the characteristics of the volume and its usage patterns. Now you can change the workload for one or more volumes from Volumes explorer.
Volumes explorer displays volume latency
Volumes explorer displays volume latency status with the following statuses: not configured, within threshold, and exceeded. These statuses help you find and fix performance bottlenecks at the volume level.
Volumes explorer displays ARP/AI status for volumes across all file systems
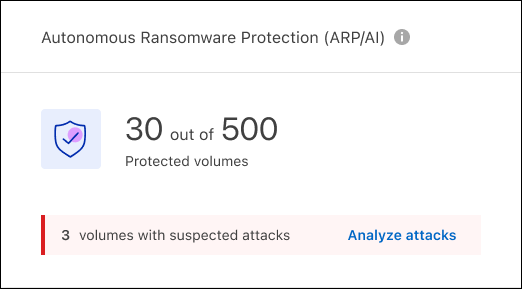
The Volumes explorer screen now includes a card with NetApp Autonomous Ransomware Protection with AI (ARP/AI) status for volumes across all your file systems. The card displays the number of protected volumes and indicates whether any volumes are at risk. From the card, you can Analyze attacks to investigate potential ransomware threats and take appropriate actions to secure your data.
Email notification for unhealthy replication relationships
When the status of a replication relationship is unhealthy, Workload Factory sends an email notification every 24 hours while the relationship remains unhealthy. Reminder notifications stop when the relationship returns to a healthy state.
Support for restricted ONTAP credentials for AIOps
Workload Factory supports two types of ONTAP credentials for an FSx for ONTAP file system: primary and restricted. By default, a file system uses the primary ONTAP credentials. We use restricted credentials only for AI operations (AIOps) like Rule builder, Custom dashboards, and Ask Me, our AI assistant. Now you can add your own credentials, using either a username and password or a secret ARN, to restrict access for AIOps features.
Workload selection during volume creation
Workload Factory now includes a Workloads field in volume creation so that you can select the workload to associate with the volume. This ensures that the volume is optimized for the intended workload from the moment it is created.
FlexCache write mode improvement
Workload Factory now recognizes the preferred FlexCache write mode for volumes and recommends changing it if necessary to optimize performance.
Link documentation support
All link documentation is now covered in the Workload Factory setup and administration documentation. You can still refer to the Learn about NetApp Workload Factory links from the Workload Factory FSx for ONTAP documentation and find links to the relevant pages in the setup and administration documentation.
Cross-region host-to-storage relationship discovery
Workload Factory now supports finding connections between hosts and storage across multiple AWS regions as part of the workload tagging service. It can identify and link hosts and storage resources across regions, including mapping IP addresses between regions, so host-to-storage relationships are tagged and classified correctly.
Improved workload and host identification accuracy
Workload Factory now more accurately identifies and classifies workloads and hosts in the workload tagging service. Updated detection methods reduce misclassification and provide more accurate tagging and classification results.
Improved file system visibility in the interface
Workload Factory now gives you a clearer view of your file systems in the interface. You can view SSD capacity and throughput usage trends, workload summaries, and detailed configuration information directly from the file system overview. Workload Factory now more accurately identifies and classifies workloads and hosts in the workload tagging service. Updated detection methods reduce misclassification and provide more accurate tagging and classification results.
Database workloads
Support for multiple file systems per a single instance
Workload Factory for Databases supports multiple file systems per a single Microsoft SQL Server instance. You can register multiple file systems in a SQL Server instance, and fix one configuration issue for multiple file systems in a SQL Server instance at the same time.
Setup and administration
AI agents for Workload Factory
Workload Factory AIOps uses AI to analyze your environment and recommend improvements. If you approve, it can also take actions using the credentials and permissions you set up. AI agents analyze your environment, helping you find risks, improve workloads, and troubleshoot issues in Workload Factory and Slack.
Access AI agents in the new Explore Agents section in Ask Me. By default, agents run in read-only mode and provide recommendations and analysis.
Use Agents settings to control how agents work. You can:
-
Choose read-only or read-write mode
-
Select which credentials agents can use
-
Add custom instructions
-
Adjust how detailed responses are
These additional controls give you more visibility and oversight. In read-write mode, agents must get your approval before making changes to AWS, ONTAP, or supported APIs. You can also choose how much detail to see in responses, including information about the agent's reasoning and, in Slack, its tool activity.
Agents also support multi-account environments and easier setup. A single agent can securely work across multiple AWS accounts using multiple credentials.
Scheduled tasks in Ask Me
You can now tailor a prompt in Ask Me chat to create scheduled tasks. Use scheduled tasks to ask Ask Me to run recurring checks and send updates in chat based on the schedule you define.
Example prompts:
-
Check the health and lifecycle status of all FSx for NetApp ONTAP file systems every hour to catch issues early.
-
List all accessible AWS FSx file systems every hour to keep an up-to-date inventory.
Storage support in Ask Me
Ask Me now supports FSx for ONTAP and Google Cloud NetApp Volumes. Use the same chat experience to get answers and insights across your supported storage environments.
Notifications update
NetApp Console notifications are now enabled by default. NetApp Console users will automatically receive Workload Factory notifications without additional configuration.
Link creation notification email
Workload Factory now reminds you to complete link association after you successfully add credentials. While credentials enable resource discovery, advanced ONTAP features require link association with the discovered file systems. You'll receive the email notification once a week on Monday. After you complete the link association, the notifications stop.
Lambda link version notifications and upgrade guidance
Workload Factory now alerts you when a Lambda link is not using the latest available image. If automatic upgrades are not supported for a link, the notification shows when a newer version is available.
You can view upgrade instructions from the Links page. The instructions explain how to manually update the Lambda link image and enable automatic upgrades when available. Keeping links up to date gives you access to the latest features, fixes known issues, and applies recent security updates.
You also get an alert in the FSx for ONTAP dashboard when a newer link version is available for a link that does not support automatic upgrades.
EDA workloads
Enhanced SSD capacity notifications
SSD capacity management notifications now include detailed error messages for troubleshooting automation failures. Notifications are sent for successful capacity increases, errors during increase operations, capacity check failures, threshold warnings, and recommendations. Error details include specific failure reasons such as missing permissions, concurrent updates in progress, AWS cooldown periods, or CloudWatch metric retrieval issues.
Week time frame for latency graphs
Latency analysis graphs now support a 1-week time frame in addition to existing options (1 hour, 3 hours, 12 hours, 24 hours, 72 hours). Use the week view to identify longer-term patterns and trends in volume latency behavior.
Improved file system visibility in the interface
Workload Factory now gives you a clearer view of your file systems in the interface. You can view SSD capacity and throughput usage trends, workload summaries, and detailed configuration information directly from the file system overview.
30 August 2026
Amazon FSx for NetApp ONTAP
Link creation available from Links page
You can now create links directly from the Links page in the Administration menu, in addition to the FSx for ONTAP inventory page and the file system overview page.
Workload identification
-
Workload Factory now identifies workloads for hosts connected to FSx for ONTAP storage deployed in a different region.
-
Improved workload detection logic now discovers additional workload types and improves findings accuracy.
Database workloads
Savings calculator update
You can compare various cost components of running Microsoft SQL Server workloads like storage, compute, SQL license, snapshots, and clones for your database workloads on FSx for ONTAP file systems against Elastic Block Store (EBS), FSx for Windows File Server, and on-premises storage using only view, planning, and analysis permissions.
Setup and administration
New onboarding experience for credentials and links
Workload Factory improves the onboarding experience for credentials and links, making it easier to get started. After you create your account and log in, select Get started in any workload tile, for example Storage, and the next page takes you through the setup process step by step.
11 August 2026
Amazon FSx for NetApp ONTAP
Volume actions available in Volumes explorer
All volume actions are directly available from Volumes explorer for one or more volumes. This makes it quicker to perform volume-level operations. Volume actions include modifying volume settings, managing snapshots, and doing other volume tasks without leaving Volumes explorer. You can also access these actions from the Volumes tab in the FSx for ONTAP file system overview.
03 August 2026
Database workloads
Configuration changes for Oracle and Microsoft SQL Server in the well-architected analysis
Several database configurations have been combined and renamed to the following configurations in the well-architected analysis.
-
Block device space management: includes space reservation, space allocation, and fractional reserve
-
Storage efficiencies: includes compression, deduplication, and compaction
-
Tiering/TCO optimization: includes tiering policy and tiering minimum cooling days
-
Schedule local snapshots: includes snapshot policy
Updated IAM permission policies for Databases
Permissions for Databases were updated to improve feature access and limit SSM access where unnecessary.
The view, planning, and analysis permissions are limited to AWS SSM documents. With these permissions, you can view hosts, instances, and databases. You can also run a basic on-demand well-architected analysis of your resources.
The operations and remediation permissions allow you to make changes to your resources, analyze error logs, get a comprehensive well-architected analysis of your resources and fix configuration issues.
Setup and administration
Updated IAM permission policies for Databases
Permissions for Databases were updated to improve feature access and limit SSM access where unnecessary.
The view, planning, and analysis permissions are limited to AWS SSM documents. With these permissions, you can view hosts, instances, and databases. You can also run a basic on-demand well-architected analysis of your resources.
The operations and remediation permissions allow you to make changes to your resources, analyze error logs, get a comprehensive well-architected analysis of your resources and fix configuration issues.
Custom dashboards
Notifications for custom dashboards
Workload Factory now notifies you when your custom dashboard is ready or if creation fails.
After you create a custom dashboard, you'll get a notification with a direct link to view it. If creation fails, you'll get a notification with a link to the custom dashboard inventory to try again.
This helps you know when your dashboard is ready and makes it easy to review or recreate it.
Private and public custom dashboards
Custom dashboards now include share settings. You can keep a dashboard private or share it with your team.
New dashboards are private by default and visible only to you. You can make a dashboard public at any time to share it with everyone in your Workload Factory account.
Each dashboard card shows a Private or Public label so you can quickly see which dashboards are shared.
AI features administration
You can control access to AI features across your organization with the following settings in Workload Factory administration.
-
Use NetApp-managed Bedrock (recommended and enabled by default, with monthly credit limits)
-
Turn off all AI features
The new administration page lets you manage these settings in one place.
AI features include Ask Me, custom dashboards, rule builder, and analyzers for EMS, database logs, and volume latency.
If AI features are turned off, users will see a message that AI is unavailable.
EDA workloads
AI latency analysis with cost controls
As a Workload Factory administrator, you can control access to AI latency analysis across your organization.
-
NetApp-managed AI credits: If your administrator enables it, you can use AI analysis through NetApp's managed Amazon Bedrock integration. No additional setup is required. Your monthly usage is limited by your assigned budget. If you reach your monthly limit, AI-powered features are disabled and you'll see a message.
-
Disabled by administrator: If your administrator turns off AI features, the AI analysis options will be grayed out and you'll see a message that the feature is off.
Elastic throughput increase management
You can now manage throughput increase behavior from the EDA Overview page for one or more selected FSx for ONTAP file systems.
-
Mode selection: Choose Automate or Recommend.
-
Bulk updates: Select one or multiple file systems and apply mode and parameter changes in one action.
-
Change throughput management dialog: Edit throughput increase settings with EDA default values in the dialog.
-
Advanced settings: Configure additional throughput decision parameters in an expandable Advanced configuration section.
-
Table visibility: A new Throughput management column is available in the Clusters table and can be enabled from column settings.
-
Top card configuration: The upper card now supports throughput increase mode configuration, similar to SSD management.
02 August 2026
Amazon FSx for NetApp ONTAP
New well-architected dashboard available for all FSx for ONTAP systems
The well-architected analysis is now available for FSx for ONTAP file systems from the new well-architected dashboard in NetApp Workload Factory. The new dashboard provides a centralized view of all your file systems across accounts and regions and their configurations in one place. A popup notification appears when you visit the Well-architected tab from a file system. Access the new dashboard by selecting Well-architected from the left navigation menu in Workload Factory.
You can still access the well-architected analysis for a specific file system and from the Well-architected menu option in Storage.
New widgets added to the Storage dashboard
The Storage dashboard now includes two new widgets to help you understand how you use storage and find ways to optimize it.
-
Top discovered workloads Shows workload data found by the tagging service across your environment. View workloads with a confidence score above 80% that include associated FSx resources, such as volumes and block devices. Each workload shows its name, number of resources, provisioned capacity, and used capacity. Sort by resource count (default), provisioned capacity, or used capacity to quickly identify your largest workloads and understand storage usage patterns.
-
AI-powered insights and observations Shows AI-generated insights for your managed assets. The widget reviews your estate data within the selected scope and highlights the top three findings in key areas, including capacity, performance, data protection, replication, cost savings, and storage trends.
Each insight includes a summary, detailed findings, and recommended actions. Expand an insight to see more details and prioritize issues based on severity, performance improvements, and cost-saving opportunities.
Workload tagging
AWS Systems Manager integration for workload tagging
The workload tagging service now works with AWS Systems Manager to add more details to host inventory data. Workload Factory can now collect and process SSM inventory information to better identify and classify workloads. AWS SSM attributes are also included in the tagging process to improve workload discovery accuracy.
Every volume-related configuration in the well-architected dashboard now includes the Workload column in the resource table. This column shows the workload that Workload Factory associates with each volume.
Workload tagging and AI features
Workloads are not tagged when an administrator disables AI features. If AI features are turned off in your Workload Factory account settings, the tagging service will not identify or classify workloads on your storage resources.
Explore savings snapshot calculation improvement
Explore savings now uses a consistent snapshot-capacity calculation, so FSx for ONTAP savings estimates correctly account for the additional snapshot capacity pool requirement.
Export replication delay data to CSV
You can now export replication delay data to a CSV file to analyze the data in a spreadsheet and share it with others.
S3 access point events
You can now send S3 access point events to the SNS topic on a set schedule. Each update includes all events that have occurred since the last update.
To set up notifications for S3 events, edit S3 access points and select Send S3 events by SNS under the Journal table section.
ONTAP features displayed in Volumes explorer
Volumes explorer now includes ONTAP features in the volumes table. These features provide more detailed insights into the configuration and status of your volumes, like protection coverage, Autonomous Ransomware Protection (ARP/AI) status, storage efficiency, tiering policy, and volume autogrow.