

View potential risks in ONTAP storage using the Alerts list page
 Suggest changes
View at-a-glance information about the potential risks in your ONTAP system. You can quickly identify ONTAP clusters that have low capacity or low performance, gauge the extent of availability, determine availability, and identify security risks.
You can see information about these severities and impact areas:
-
Severities: Critical, Warning, Informational
-
Impact areas: Capacity, Performance, Availability, Protection, Security, Configuration
Alerts you might see
Here are some of the alerts that display.
The EMS severity maps to the ONTAP alerts severity in the following ways:
| EMS alert severity: | NetApp Console alert severity: |
|---|---|
alert or emergency |
critical |
error |
None |
Low |
warning |
notice |
informational |
informational |
informational |
List of alerts
Critical severity alerts:
-
Aggregate state is not online
-
Disk failure
-
SnapMirror lag time is high
-
Volume state offline
-
Volume used percentage breach
EMS alerts:
-
Antivirus server busy
-
AWS credentials not initialized
-
Cloud tier unreachable
-
Disk out of service
-
Disk shelf power supply discovered
-
Disk shelves power supply removed
-
FabricPool mirror replication resync completed
-
FabricPool space usage limit nearly reached
-
FabricPool space usage limit reached
-
FC target port commands exceeded
-
Giveback of storage pool failed
-
HA interconnect down
-
LUN destroyed
-
LUN offline
-
Main unit fan failed
-
Main unit fan in warning state
-
Max sessions per user exceeded
-
Max times open per file exceeded
-
MetroCluster automatic unplanned switchover disabled
-
MetroCluster monitoring
-
NetBIOS name conflict
-
NFSv4 sore pool exhausted
-
Node panic
-
Node root volume space low
-
Nonexistent admin share
-
Non-responsive antivirus server
-
No registered scan engine
-
No Vscan connection
-
NVMe namespace destroyed
-
NVMe namespace offline
-
NVMe namespace online
-
NVMe-oF license grace period active
-
NVMe-oF license grace period expired
-
NVMe-oF license grace period start
-
NVRAM battery low
-
Object store host unresolvable
-
Object store Intercluster LIF down
-
Object store signature mismatch
-
QoS monitor memory maxed out
-
Ransomware activity detected
-
Relocation of storage pool failed
-
ONTAP Mediator added
-
ONTAP Mediator not accessible
-
ONTAP Mediator unreachable
-
ONTAP Mediator removed
-
READDIR timeout
-
SAN "active-active" state changed
-
Service processor heartbeat missed
-
Service processor heartbeat stopped
-
Service processor offline
-
Service processor not configured
-
Shadow copy failed
-
SFP in FC target adapter receiving low power
-
SFP in FC target adapter transmitting low power
-
Shelf fan failed
-
SMBC CA certificate expired
-
SMBC CA certificate expiring
-
SMBC client certificate expired
-
SMBC client certificate expiring
-
SMBC relationship out of sync
-
SMBC server certificate expired
-
SMBC server certificate expiring
-
SnapMirror relationship out of sync
-
Storage switch power supplies failed
-
Storage VM anti-ransomware monitoring
-
Storage VM stop succeeded
-
System cannot operate due to main unit fan failure
-
Too many CIFS authentications
-
Unassigned disks
-
Unauthorized user access to admin share
-
Virus detected
-
Volume anti-ransomware monitoring
-
Volume automatic resizing succeeded
-
Volume offline
-
Volume restricted
For details on ONTAP alerts, refer to the ONTAP documentation and ONTAP System Manager insights at ONTAP System Manager insights into capacity, security, and configuration issues.
View ONTAP storage issues
-
From the Console left navigation bar, select Storage > Alerts.
After discovery, the Alerts list page shows a list of alerts in your ONTAP system.
There might be a delay between an event happening and ONTAP alerts showing it.
-
From the Alerts list page, you can view and do any of the following:
-
Change the sort order by selecting the up or down arrow for a column.
-
Change the filter in the columns to show only the information you want.

For example, you might want to see only those alerts related to capacity. To do so, select the filter icon on the Impact area column, select Capacity, and select Apply. 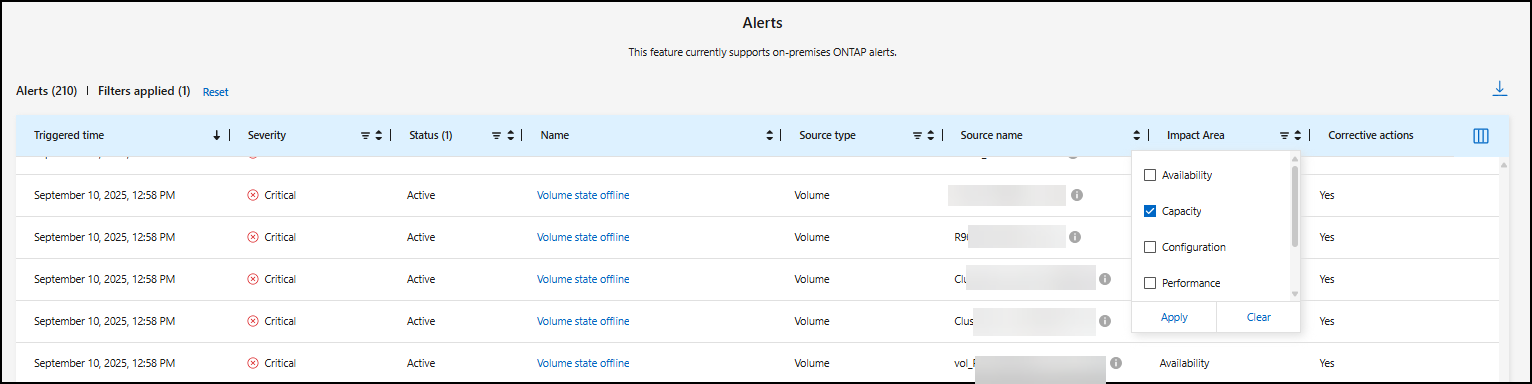
-
Download a CSV file containing the alerts information.
You can download up to 1000 alerts. The file includes data based on the filters that were set.
-
Select an alert and drill into the alert details on that cluster. See View alert details.
-