

Kubernetes Monitoring Operator Installation and Configuration
 Suggest changes
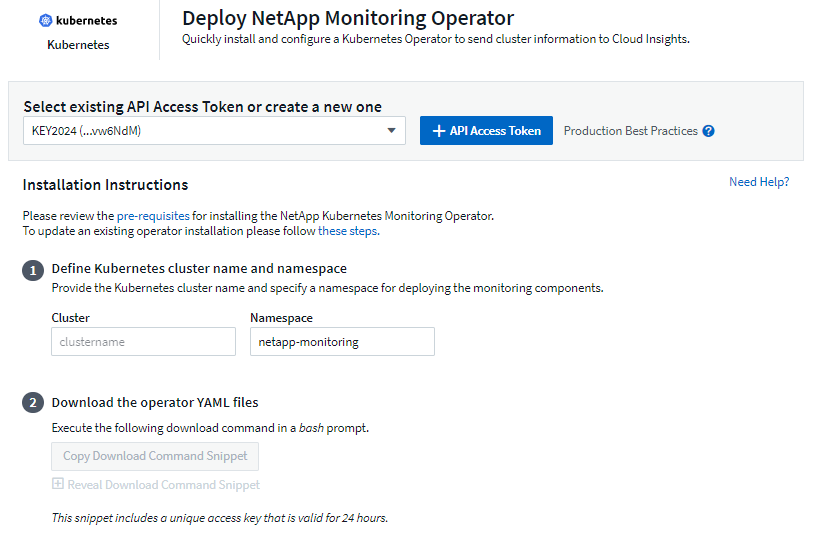
Data Infrastructure Insights offers the Kubernetes Monitoring Operator for Kubernetes collection. Navigate to Kubernetes > Collectors > +Kubernetes Collector to deploy a new operator.
Before installing the Kubernetes Monitoring Operator
See the Pre-requisites documentation before installing or upgrading the Kubernetes Monitoring Operator.
Installing the Kubernetes Monitoring Operator
-
Enter a unique cluster name and namespace. If you are upgrading from a previous Kubernetes Operator, use the same cluster name and namespace.
-
Once these are entered, you can copy the Download Command snippet to the clipboard.
-
Paste the snippet into a bash window and execute it. The Operator installation files will be downloaded. Note that the snippet has a unique key and is valid for 24 hours.
-
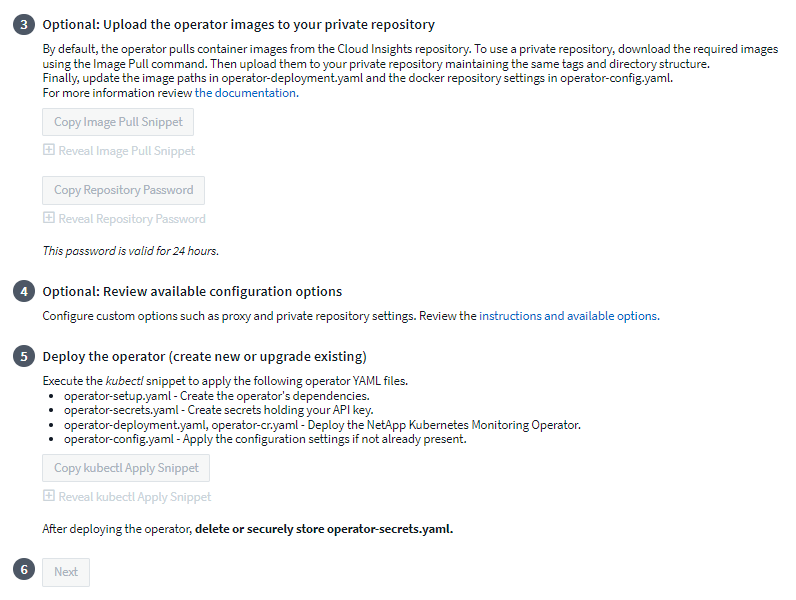
If you have a custom or private repository, copy the optional Image Pull snippet, paste it into a bash shell and execute it. Once the images have been pulled, copy them to your private repository. Be sure to maintain the same tags and folder structure. Update the paths in operator-deployment.yaml as well as the docker repository settings in operator-config.yaml.
-
If desired, review available configuration options such as proxy or private repository settings. You can read more about configuration options.
-
When you are ready, deploy the Operator by copying the kubectl Apply snippet, downloading it, and executing it.
-
The installation proceeds automatically. When it is complete, click the Next button.
-
When installation is complete, click the Next button. Be sure to also delete or securely store the operator-secrets.yaml file.
If you are have a custom repository, read about using a custom/private docker repository.
Kubernetes Monitoring Components
Data Infrastructure Insights Kubernetes Monitoring is comprised of four monitoring components:
-
Cluster Metrics
-
Network Performance and Map (optional)
-
Event Logs (optional)
-
Change Analysis (optional)
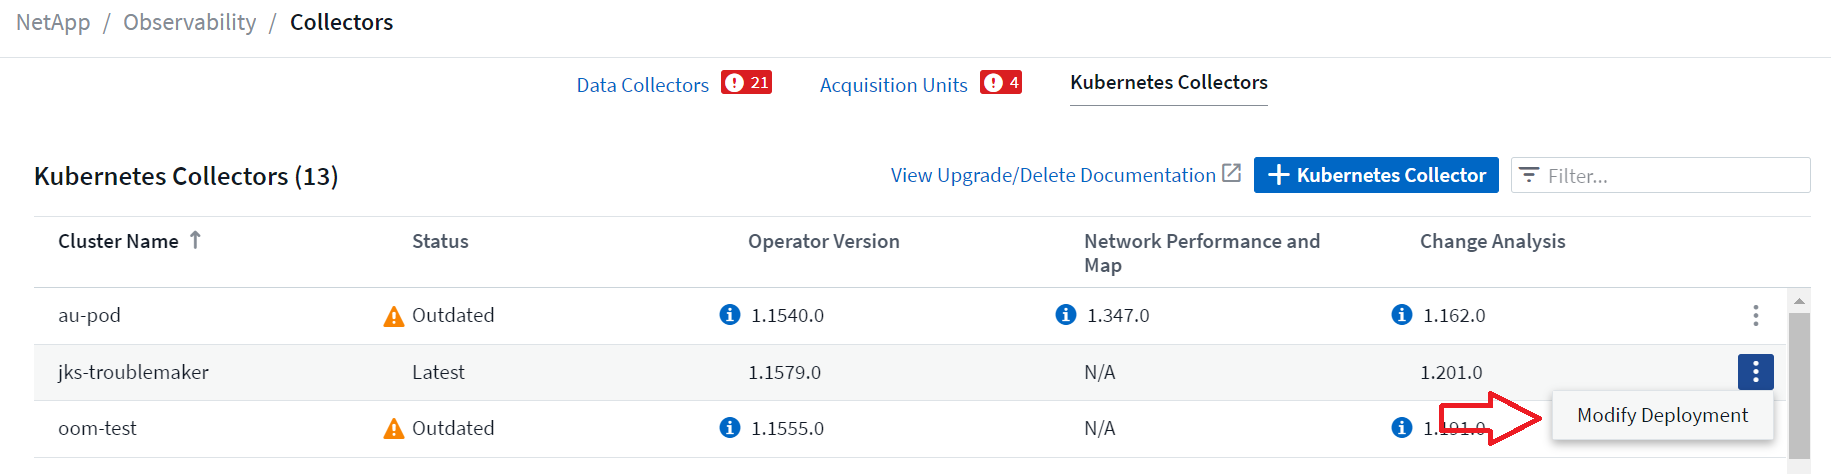
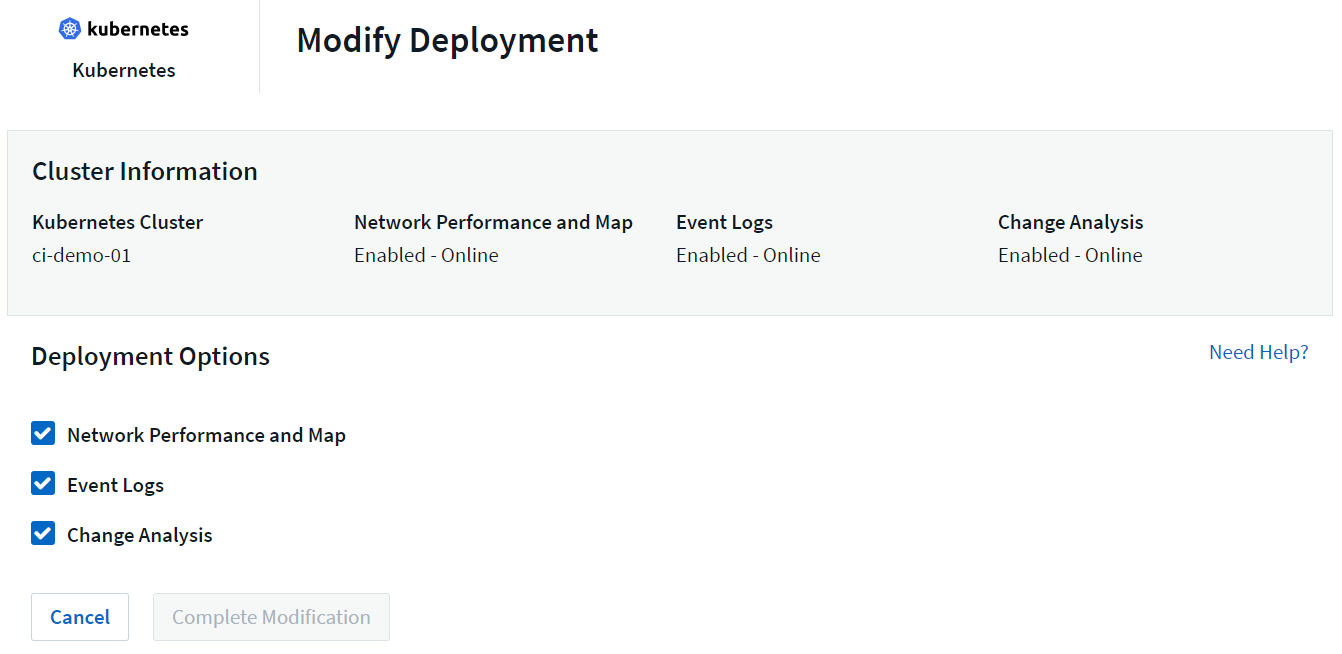
The optional components above are enabled by default for each Kubernetes collector; if you decide you don't need a component for a particular collector, you can disable it by navigating to Kubernetes > Collectors and selecting Modify Deployment from the collector's "three dots" menu on the right of the screen.
The screen shows the current state of each component and allows you to disable or enable components for that collector as needed.
Upgrading to the latest Kubernetes Monitoring Operator
DII Push-Button upgrades
You can upgrade the Kubernetes Monitoring Operator through the DII Kubernetes Collectors page. Click on the menu next to the cluster you would like to upgrade and select Upgrade. The operator will verify the image signatures, perform a snapshot of your current installation and perform the upgrade. Within a few minutes you should see the operator Status progress through Upgrade In Progress to Latest. If you encounter an error you can select the Error status for more details and refer to the Push-Button Upgrades Troubleshooting table below.

|
Push-Button upgrades are not available for operator versions before 1.2057.0. Please follow the manual upgrade instructions below to upgrade to the latest version. After doing so, future upgrades can be performed using the push-button upgrade feature. |
Push-Button upgrades with private repositories
If your operator is configured to use a private repository please ensure all images required to run the operator and their signatures are available in your repository. If you encounter an error during the upgrade process for missing images simply add them to your repository and retry the upgrade. To upload the image signatures to your repository please use the cosign tool as follows, making sure to upload signatures for all images specified under 3 Optional: Upload the operator images to your private repository > Image Pull Snippet
cosign copy example.com/src:v1 example.com/dest:v1
#Example
cosign copy <DII container registry>/netapp-monitoring:<image version> <private repository>/netapp-monitoring:<image version>
Rolling back to a previously running version
If you upgraded using the push-button upgrades feature and encounter any difficulties with the current version of the operator within seven days of the upgrade, you can downgrade to the previously running version using the snapshot created during the upgrade process. Click the menu next to the cluster you would like to roll back and select Roll back.
Manual Upgrades
Determine whether an AgentConfiguration exists with the existing Operator (if your namespace is not the default netapp-monitoring, substitute the appropriate namespace):
kubectl -n netapp-monitoring get agentconfiguration netapp-ci-monitoring-configuration
If an AgentConfiguration exists:
-
Install the latest Operator over the existing Operator.
-
Ensure you are pulling the latest container images if you are using a custom repository.
-
If the AgentConfiguration does not exist:
-
Make note of your cluster name as recognized by Data Infrastructure Insights (if your namespace is not the default netapp-monitoring, substitute the appropriate namespace):
kubectl -n netapp-monitoring get agent -o jsonpath='{.items[0].spec.cluster-name}' -
Create a backup of the existing Operator (if your namespace is not the default netapp-monitoring, substitute the appropriate namespace):
kubectl -n netapp-monitoring get agent -o yaml > agent_backup.yaml
-
Uninstall the existing Operator.
-
Install the latest Operator.
-
Use the same cluster name.
-
After downloading the latest Operator YAML files, port any customizations found in agent_backup.yaml to the downloaded operator-config.yaml before deploying.
-
Ensure you are pulling the latest container images if you are using a custom repository.
-
Stopping and Starting the Kubernetes Monitoring Operator
To stop the Kubernetes Monitoring Operator:
kubectl -n netapp-monitoring scale deploy monitoring-operator --replicas=0
To start the Kubernetes Monitoring Operator:
kubectl -n netapp-monitoring scale deploy monitoring-operator --replicas=1
Uninstalling
To remove the Kubernetes Monitoring Operator
Note that the default namespace for the Kubernetes Monitoring Operator is "netapp-monitoring". If you have set your own namespace, substitute that namespace in these and all subsequent commands and files.
Newer versions of the monitoring operator can be uninstalled with the following commands:
kubectl -n <NAMESPACE> delete agent -l installed-by=nkmo-<NAMESPACE>
kubectl -n <NAMESPACE> delete clusterrole,clusterrolebinding,crd,svc,deploy,role,rolebinding,secret,sa -l installed-by=nkmo-<NAMESPACE>
If the monitoring operator was deployed in its own dedicated namespace, delete the namespace:
kubectl delete ns <NAMESPACE>
Note: If the first command returns “No resources found”, use the following instructions to uninstall older versions of the monitoring operator.
Execute each of the following commands in order. Depending on your current installation, some of these commands may return 'object not found' messages. These messages may be safely ignored.
kubectl -n <NAMESPACE> delete agent agent-monitoring-netapp
kubectl delete crd agents.monitoring.netapp.com
kubectl -n <NAMESPACE> delete role agent-leader-election-role
kubectl delete clusterrole agent-manager-role agent-proxy-role agent-metrics-reader <NAMESPACE>-agent-manager-role <NAMESPACE>-agent-proxy-role <NAMESPACE>-cluster-role-privileged
kubectl delete clusterrolebinding agent-manager-rolebinding agent-proxy-rolebinding agent-cluster-admin-rolebinding <NAMESPACE>-agent-manager-rolebinding <NAMESPACE>-agent-proxy-rolebinding <NAMESPACE>-cluster-role-binding-privileged
kubectl delete <NAMESPACE>-psp-nkmo
kubectl delete ns <NAMESPACE>
If a Security Context Constraint was previously-created:
kubectl delete scc telegraf-hostaccess
About Kube-state-metrics
The NetApp Kubernetes Monitoring Operator installs its own kube-state-metrics to avoid conflict with any other instances.
For information about Kube-State-Metrics, see this page.
Configuring/Customizing the Operator
These sections contain information on customizing your operator configuration, working with proxy, using a custom or private docker repository, or working with OpenShift.
Configuration Options
Most commonly modified settings can be configured in the AgentConfiguration custom resource. You can edit this resource before deploying the operator by editing the operator-config.yaml file. This file includes commented-out examples of settings. See the list of available settings for the most recent version of the operator.
You can also edit this resource after the operator has been deployed by using the following command:
kubectl -n netapp-monitoring edit AgentConfiguration
To determine if your deployed version of the operator supports AgentConfiguration, run the following command:
kubectl get crd agentconfigurations.monitoring.netapp.com
If you see an “Error from server (NotFound)” message, your operator must be upgraded before you can use the AgentConfiguration.
Configuring Proxy Support
There are two places where you may use a proxy on your tenant in order to install the Kubernetes Monitoring Operator. These may be the same or separate proxy systems:
-
Proxy needed during execution of the installation code snippet (using "curl") to connect the system where the snippet is executed to your Data Infrastructure Insights environment
-
Proxy needed by the target Kubernetes cluster to communicate with your Data Infrastructure Insights environment
If you use a proxy for either or both of these, in order to install the Kubernetes Operating Monitor you must first ensure that your proxy is configured to allow good communication to your Data Infrastructure Insights environment. If you have a proxy and can access Data Infrastructure Insights from the server/VM from which you wish to install the Operator, then your proxy is likely configured properly.
For the proxy used to install the Kubernetes Operating Monitor, before installing the Operator, set the http_proxy/https_proxy environment variables. For some proxy environments, you may also need to set the no_proxy environment variable.
To set the variable(s), perform the following steps on your system before installing the Kubernetes Monitoring Operator:
-
Set the https_proxy and/or http_proxy environment variable(s) for the current user:
-
If the proxy being setup does not have Authentication (username/password), run the following command:
export https_proxy=<proxy_server>:<proxy_port>
-
If the proxy being setup does have Authentication (username/password), run this command:
export http_proxy=<proxy_username>:<proxy_password>@<proxy_server>:<proxy_port>
-
For the proxy used for your Kubernetes cluster to communicate with your Data Infrastructure Insights environment, install the Kubernetes Monitoring Operator after reading all of these instructions.
Configure the proxy section of AgentConfiguration in operator-config.yaml before deploying the Kubernetes Monitoring Operator.
agent:
  ...
  proxy:
    server: <server for proxy>
    port: <port for proxy>
    username: <username for proxy>
    password: <password for proxy>

    # In the noproxy section, enter a comma-separated list of
    # IP addresses and/or resolvable hostnames that should bypass
    # the proxy
    noproxy: <comma separated list>

    isTelegrafProxyEnabled: true
    isFluentbitProxyEnabled: <true or false> # true if Events Log enabled
    isCollectorsProxyEnabled: <true or false> # true if Network Performance and Map enabled
    isAuProxyEnabled: <true or false> # true if AU enabled
  ...
...
Using a custom or private docker repository
By default, the Kubernetes Monitoring Operator will pull container images from the Data Infrastructure Insights repository. If you have a Kubernetes cluster used as the target for monitoring, and that cluster is configured to only pull container images from a custom or private Docker repository or container registry, you must configure access to the containers needed by the Kubernetes Monitoring Operator.
Run the “Image Pull Snippet” from the NetApp Monitoring Operator install tile. This command will log into the Data Infrastructure Insights repository, pull all image dependencies for the operator, and log out of the Data Infrastructure Insights repository. When prompted, enter the provided repository temporary password. This command downloads all images used by the operator, including for optional features. See below for which features these images are used for.
Core Operator Functionality and Kubernetes Monitoring
-
netapp-monitoring
-
ci-kube-rbac-proxy
-
ci-ksm
-
ci-telegraf
-
distroless-root-user
Events Log
-
ci-fluent-bit
-
ci-kubernetes-event-exporter
Network Performance and Map
-
ci-net-observer
Change Analysis
-
ci-k8s-change-observer
Push the operator docker image to your private/local/enterprise docker repository according to your corporate policies. Ensure that the image tags and directory paths to these images in your repository are consistent with those in the Data Infrastructure Insights repository.
Edit the monitoring-operator deployment in operator-deployment.yaml, and modify all image references to use your private Docker repository.
image: <docker repo of the enterprise/corp docker repo>/ci-kube-rbac-proxy:<ci-kube-rbac-proxy version>
image: <docker repo of the enterprise/corp docker repo>/netapp-monitoring:<version>
Edit the AgentConfiguration in operator-config.yaml to reflect the new docker repo location. Create a new imagePullSecret for your private repository, for more details see https://kubernetes.io/docs/tasks/configure-pod-container/pull-image-private-registry/
agent:
  ...
  # An optional docker registry where you want docker images to be pulled from as compared to CI's docker registry
  # Please see documentation link here: link:task_config_telegraf_agent_k8s.html#using-a-custom-or-private-docker-repository[Using a custom or private docker repository]
  dockerRepo: your.docker.repo/long/path/to/test
  # Optional: A docker image pull secret that maybe needed for your private docker registry
  dockerImagePullSecret: docker-secret-name
API access token for long-term passwords
Some environments (i.e. proxy repositories) require long-term passwords for the Data Infrastructure Insights docker repository. The password provided in the UI at install time is valid for only 24 hours. Instead of using that, one can use an API Access Token as the docker repository password. This password will be valid as long as the API Access Token is valid. One can generate a new API Access Token for this specific purpose or use an existing one.
Read here for instructions to create a new API Access Token.
To extract an existing API Access Token from a downloaded operator-secrets.yaml file, users can run the following:
grep '\.dockerconfigjson' operator-secrets.yaml |sed 's/.*\.dockerconfigjson: //g' |base64 -d |jq
To extract an existing API Access Token from a running operator install, users can run the following:
kubectl -n netapp-monitoring get secret netapp-ci-docker -o jsonpath='{.data.\.dockerconfigjson}' |base64 -d |jq
OpenShift Instructions
If you are running on OpenShift 4.6 or higher, you must edit the AgentConfiguration in operator-config.yaml to enable the runPrivileged setting:
# Set runPrivileged to true SELinux is enabled on your kubernetes nodes
runPrivileged: true
Openshift may implement an added level of security that may block access to some Kubernetes components.
Tolerations and Taints
The netapp-ci-telegraf-ds, netapp-ci-fluent-bit-ds, and netapp-ci-net-observer-l4-ds DaemonSets must schedule a pod on every node in your cluster in order to correctly collect data on all nodes. The operator has been configured to tolerate some well known taints. If you have configured any custom taints on your nodes, thus preventing pods from running on every node, you can create a toleration for those taints in the AgentConfiguration. If you have applied custom taints to all nodes in your cluster, you must also add the necessary tolerations to the operator deployment to allow the operator pod to be scheduled and executed.
Learn More about Kubernetes Taints and Tolerations.
Return to the NetApp Kubernetes Monitoring Operator Installation page
Verifying Kubernetes Monitoring Operator Image Signatures
The image for the operator and all related images it deploys are signed by NetApp. You can manually verify the images before installation using the cosign tool, or configure a Kubernetes admission controller. For more details please see the Kubernetes documentation.
The public key used to verify the image signatures is available in the Monitoring Operator install tile under Optional: Upload the operator images to your private repository > Image Signature Public Key
To manually verify an image signature, perform the following steps:
-
Copy and run the Image Pull Snippet
-
Copy and enter the Repository Password when prompted
-
Store the Image Signature Public Key (dii-image-signing.pub in the example)
-
Verify the images using cosign. Refer to the following example of cosign usage
$ cosign verify --key dii-image-signing.pub --insecure-ignore-sct --insecure-ignore-tlog <repository>/<image>:<tag>
Verification for <repository>/<image>:<tag> --
The following checks were performed on each of these signatures:
  - The cosign claims were validated
  - The signatures were verified against the specified public key
[{"critical":{"identity":{"docker-reference":"<repository>/<image>"},"image":{"docker-manifest-digest":"sha256:<hash>"},"type":"cosign container image signature"},"optional":null}]
Troubleshooting
Some things to try if you encounter problems setting up the Kubernetes Monitoring Operator:
| Problem: | Try this: |
|---|---|
I do not see a hyperlink/connection between my Kubernetes Persistent Volume and the corresponding back-end storage device. My Kubernetes Persistent Volume is configured using the hostname of the storage server. |
Follow the steps to uninstall the existing Telegraf agent, then re-install the latest Telegraf agent. You must be using Telegraf version 2.0 or later, and your Kubernetes cluster storage must be actively monitored by Data Infrastructure Insights. |
I'm seeing messages in the logs resembling the following: |
These messages may occur if you are running kube-state-metrics version 2.0.0 or above with Kubernetes versions below 1.20. |
I see error messages from Telegraf resembling the following, but Telegraf does start up and run: |
This is a known issue. Refer to This GitHub article for more details. As long as Telegraf is up and running, users can ignore these error messages. |
On Kubernetes, my Telegraf pod(s) are reporting the following error: |
If SELinux is enabled and enforcing, it is likely preventing the Telegraf pod(s) from accessing the /proc/1/mountstats file on the Kubernetes node. To overcome this restriction, edit the agentconfiguration, and enable the runPrivileged setting. For more details, refer to the OpenShift Instructions. |
On Kubernetes, my Telegraf ReplicaSet pod is reporting the following error: |
The Telegraf ReplicaSet pod is intended to run on a node designated as a master or for etcd. If the ReplicaSet pod is not running on one of these nodes, you will get these errors. Check to see if your master/etcd nodes have taints on them. If they do, add the necessary tolerations to the Telegraf ReplicaSet, telegraf-rs. |
I have a PSP/PSA environment. Does this affect my monitoring operator? |
If your Kubernetes cluster is running with Pod Security Policy (PSP) or Pod Security Admission (PSA) in place, you must upgrade to the latest Kubernetes Monitoring Operator. Follow these steps to upgrade to the current Operator with support for PSP/PSA: |
I ran into issues trying to deploy the Operator, and I have PSP/PSA in use. |
1. Edit the agent using the following command: |
"ImagePullBackoff" errors seen |
These errors may be seen if you have a custom or private docker repository and have not yet configured the Kubernetes Monitoring Operator to properly recognize it. Read more about configuring for custom/private repo. |
I am having an issue with my monitoring-operator deployment, and the current documentation does not help me resolve it. |
Capture or otherwise note the output from the following commands, and contact the Technical Support team. kubectl -n netapp-monitoring get all kubectl -n netapp-monitoring describe all kubectl -n netapp-monitoring logs <monitoring-operator-pod> --all-containers=true kubectl -n netapp-monitoring logs <telegraf-pod> --all-containers=true |
net-observer (Workload Map) pods in Operator namespace are in CrashLoopBackOff |
These pods correspond to Workload Map data collector for Network Observability. Try these: |
Pods are running in Operator namespace (default: netapp-monitoring), but no data is shown in UI for workload map or Kubernetes metrics in Queries |
Check the time setting on the nodes of the K8S cluster. For accurate audit and data reporting, it is strongly recommended to synchronize the time on the Agent machine using Network Time Protocol (NTP) or Simple Network Time Protocol (SNTP). |
Some of the net-observer pods in Operator namespace are in Pending state |
Net-observer is a DaemonSet and runs a pod in each Node of the k8s cluster. |
I’m seeing the following in my logs immediately after installing the Kubernetes Monitoring Operator: |
This message is typically only seen when a new operator is installed and the telegraf-rs pod is up before the ksm pod is up. These messages should stop once all pods are running. |
I do see not any metrics being collected for the Kubernetes CronJobs that exist in my cluster. |
Verify your Kubernetes version (i.e. |
After installing the operator, the telegraf-ds pods enter CrashLoopBackOff and the pod logs indicate "su: Authentication failure". |
Edit the telegraf section in AgentConfiguration, and set dockerMetricCollectionEnabled to false. For more details, refer to the operator's configuration options. |
I see repeating error messages resembling the following in my Telegraf logs: |
Edit the telegraf section in AgentConfiguration, and increase outputTimeout to 10s. For more details, refer to the operator's configuration options. |
I'm missing involvedobject data for some Event Logs. |
Be sure you have followed the steps in the Permissions section above. |
Why am I seeing two monitoring operator pods running, one named netapp-ci-monitoring-operator-<pod> and the other named monitoring-operator-<pod>? |
As of October 12, 2023, Data Infrastructure Insights has refactored the operator to better serve our users; for those changes to be fully adopted, you must remove the old operator and install the new one. |
My kubernetes events unexpectedly stopped reporting to Data Infrastructure Insights. |
Retrieve the name of the event-exporter pod: `kubectl -n netapp-monitoring get pods |grep event-exporter |awk '{print $1}' |sed 's/event-exporter./event-exporter/'`
It should be either "netapp-ci-event-exporter" or "event-exporter". Next, edit the monitoring agent fluent-bit:
...
- name: event-exporter-ci
substitutions:
- key: LOG_FILE
values:
- /var/log/containers/netapp-ci-event-exporter*.log
...
|
I'm seeing pod(s) deployed by the Kubernetes Monitoring Operator crash because of insufficient resources. |
Refer to the Kubernetes Monitoring Operator configuration options to increase the CPU and/or memory limits as needed. |
A missing image or invalid configuration caused the netapp-ci-kube-state-metrics pods to fail to startup or become ready. Now the StatefulSet is stuck and configuration changes are not being applied to the netapp-ci-kube-state-metrics pods. |
The StatefulSet is in a broken state. After fixing any configuration problems bounce the netapp-ci-kube-state-metrics pods. |
netapp-ci-kube-state-metrics pods fail to start after running a Kubernetes Operator upgrade, throwing ErrImagePull (failing to pull the image). |
Try resetting the pods manually. |
"Event discarded as being older then maxEventAgeSeconds" messages are being observed for my Kubernetes cluster under Log Analysis. |
Modify the Operator agentconfiguration and increase the event-exporter-maxEventAgeSeconds (i.e. to 60s), event-exporter-kubeQPS (i.e. to 100), and event-exporter-kubeBurst (i.e. to 500). For more details on these configuration options, see the configuration options page. |
Telegraf warns of, or crashes because of, insufficient lockable memory. |
Try increasing the limit of lockable memory for Telegraf in the underlying operating system/node. If increasing the limit is not an option, modify the NKMO agentconfiguration and set unprotected to true. This will instruct Telegraf to no attempt to reserve locked memory pages. While this can pose a security risk as decrypted secrets might be swapped out to disk, it allows for execution in environments where reserving locked memory is not possible. For more details on the unprotected configuration options, refer to the configuration options page. |
I see warning messages from Telegraf resembling the following: |
For the Kubernetes Monitoring Operator, these warning message are benign and can be safely ignored. Alternatively, edit the telegraf section in AgentConfiguration, and set runDsPrivileged to true. For more details, refer to the operator's configuration options. |
My fluent-bit pod is failing with the following errors: |
Try to change your fsnotify settings in your cluster: sudo sysctl fs.inotify.max_user_instances (take note of setting) sudo sysctl fs.inotify.max_user_instances=<something larger than current setting> sudo sysctl fs.inotify.max_user_watches (take note of setting) sudo sysctl fs.inotify.max_user_watches=<something larger than current setting> Restart Fluent-bit. Note: to make these settings persistent across node restarts, you need to put the following lines in /etc/sysctl.conf fs.inotify.max_user_instances=<something larger than current setting> fs.inotify.max_user_watches=<something larger than current setting> |
The telegraf DS pods are reporting errors pertaining to the kubernetes input plugin failing to make HTTP requests due to the inability to validate the TLS certificate. For example: |
This will occur if the kubelet is using self-signed certificates, and/or the specified certificate does not include the <kubelet_IP> in the certificates Subject Alternative Name list. To resolve this, the user can modify the agent configuration, and set telegraf:insecureK8sSkipVerify to true. This will configure the telegraf input plugin to skip verification. |
I'm getting the following error in the Fluent-bit pods and the pod cannot start: |
Ensure the host directory in which the DB file resides has the proper read/write permissions. More specifically, the host directory should grant read/write permissions to non-root users. The default DB file location is /var/log/ unless overridden by the fluent-bit-dbFile agentconfiguration option. |
I see error messages from Telegraf resembling the following, but Telegraf does start up and run: |
These messages may occur if you are running on Kubernetes versions below 1.33. The "nodes/pods" RBAC resource used by telegraf does not exist on these versions. Refer to the "For Kubernetes versions < 1.33" section of operator-additional-permissions.yaml for the RBAC resources required on older versions. |
Additional information may be found from the Support page or in the Data Collector Support Matrix.