

View consumption and health of your Keystone MetroCluster subscriptions
 Suggest changes
When you subscribe to the advanced data protection add-on service, you can view consumption data for your MetroCluster partner sites in either the NetApp Console or Digital Advisor. In the NetApp Console, you can also monitor the health of your MetroCluster setup and track the distribution of your advanced data protection licenses.
View MetroCluster subscriptions consumption and health status
Follow the steps below:
-
From the Console left navigation menu, select Storage > Keystone > Subscriptions.
-
Select the MetroCluster subscription in the Subscription number column.

MetroCluster subscriptions are identified by the  icon.
icon.
The Current consumption tab opens and displays consumption insights for your subscribed base performance service levels and their corresponding advanced data protection performance service levels. You can view this information in a tabular or graphical format. To learn more, refer to View the current consumption of your Keystone subscriptions.
-
Select the Advanced data protection (ADP) tab.
On this tab, you can view consumption data for your base performance service levels at both primary and mirror sites, monitor the health and synchronization status of your MetroCluster setup, and view ADP license utilization and distribution across both clusters.
-
View the consumption distribution chart for your selected time period.
The chart shows consumption for both your primary and mirror sites. Hover over the chart to see the consumption breakdown in tebibytes (TiB) for each site.

For the base performance service levels, each volume is charged as provisioned at both the primary and mirror sites. The chart is therefore split to reflect consumption at each site. Example:
The tooltip displays consumption values such as 109.29 TiB for the primary site and 111.97 TiB for the mirror site.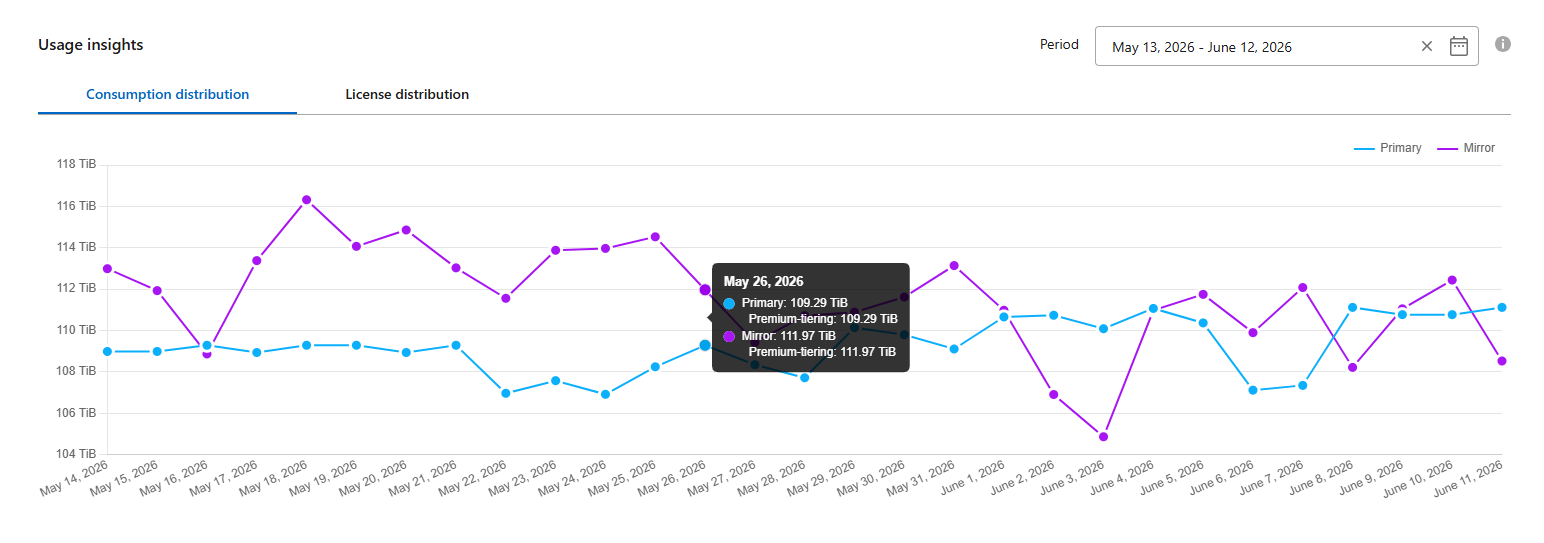
-
View the license distribution chart for your selected time period.
The chart shows ADP license consumption across Cluster A (primary) and Cluster B (mirror). Depending on the license version associated with your subscription, the chart displays consumption for each ADP add-on performance service level, such as Advanced data-protect premium tiering and Data-protect premium tiering, at each site.
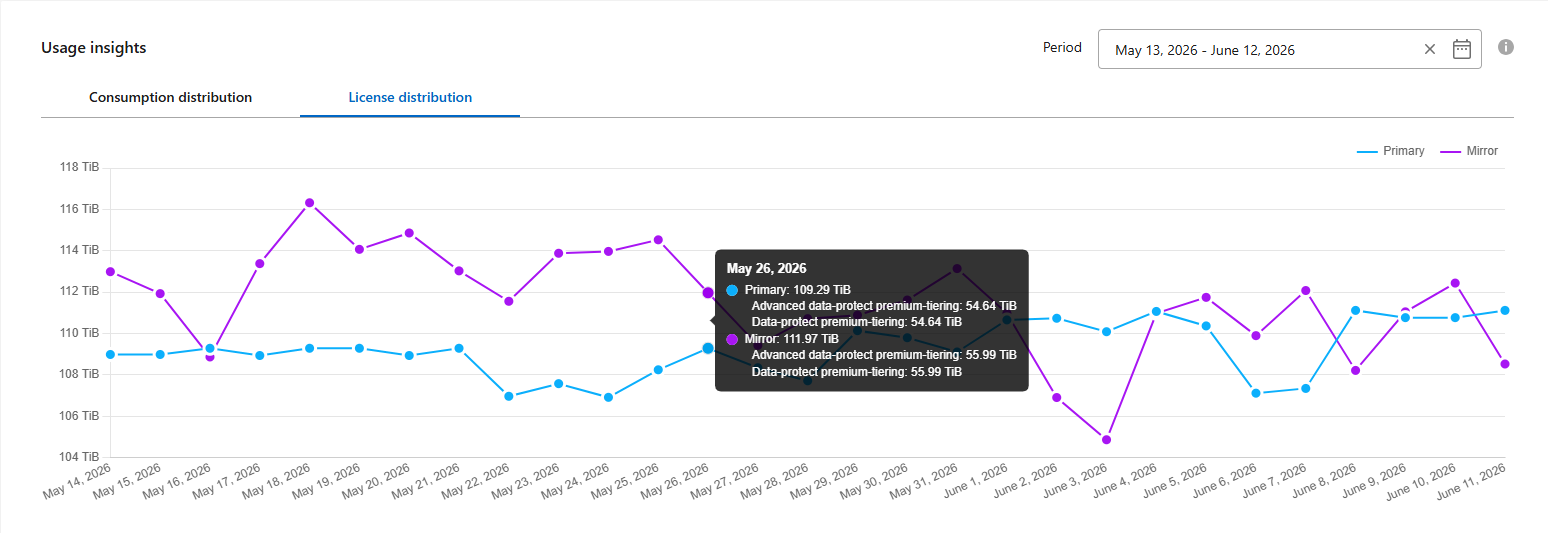
You can use this data to verify whether billing for a given date is correct and to cross-check usage debit values for your subscription.
-
Monitor the health status of your MetroCluster setup in the ADP Topology view.
The topology displays the connection status between the primary and mirror sites (normal, degraded, disconnected, or initializing), the data synchronization status (in sync or out of sync), and the ONTAP Mediator status if configured. To learn more about ONTAP Mediator, refer to Learn about ONTAP Mediator.

You can select the Cluster B subscription (mirror) from the ADP topology to view it as the primary site.
If the sync status shows out of sync or the connection status shows degraded, refer to Get help with Keystone to troubleshoot the issue. -
View historical consumption trends for the primary or mirror site.
Under Capacity utilization, select View next to either Cluster A (primary) or Cluster B (mirror).
The Consumption trend tab opens and displays historical consumption data for the selected cluster over a specified date range. You can analyze capacity usage trends for both base and advanced data protection performance service levels. To learn more, refer to View consumption trends for your Keystone subscriptions.
Example:
The following chart shows consumption for the Premium performance service level (base) for the primary site (Cluster A):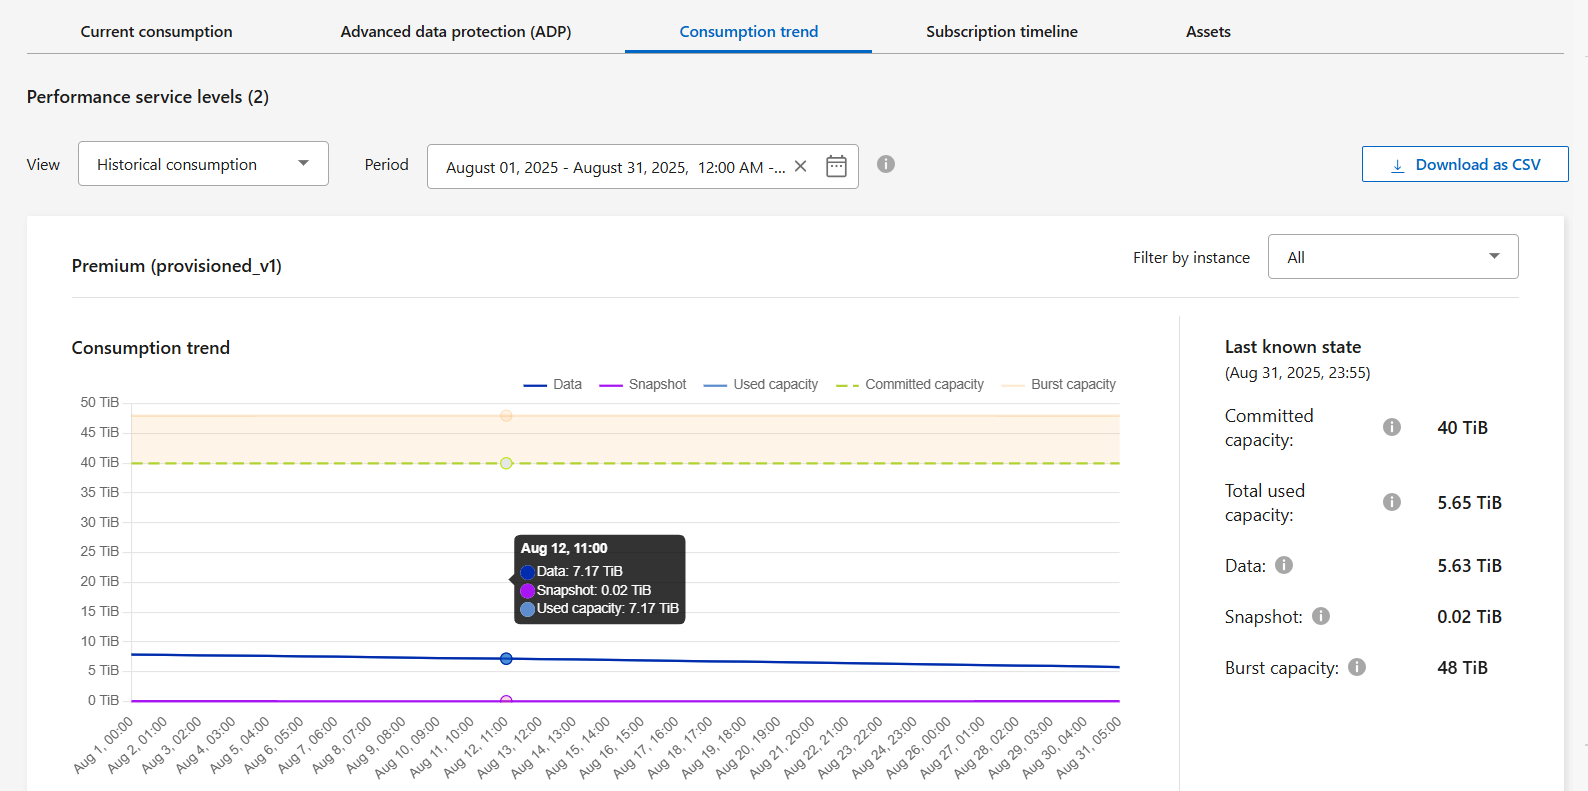
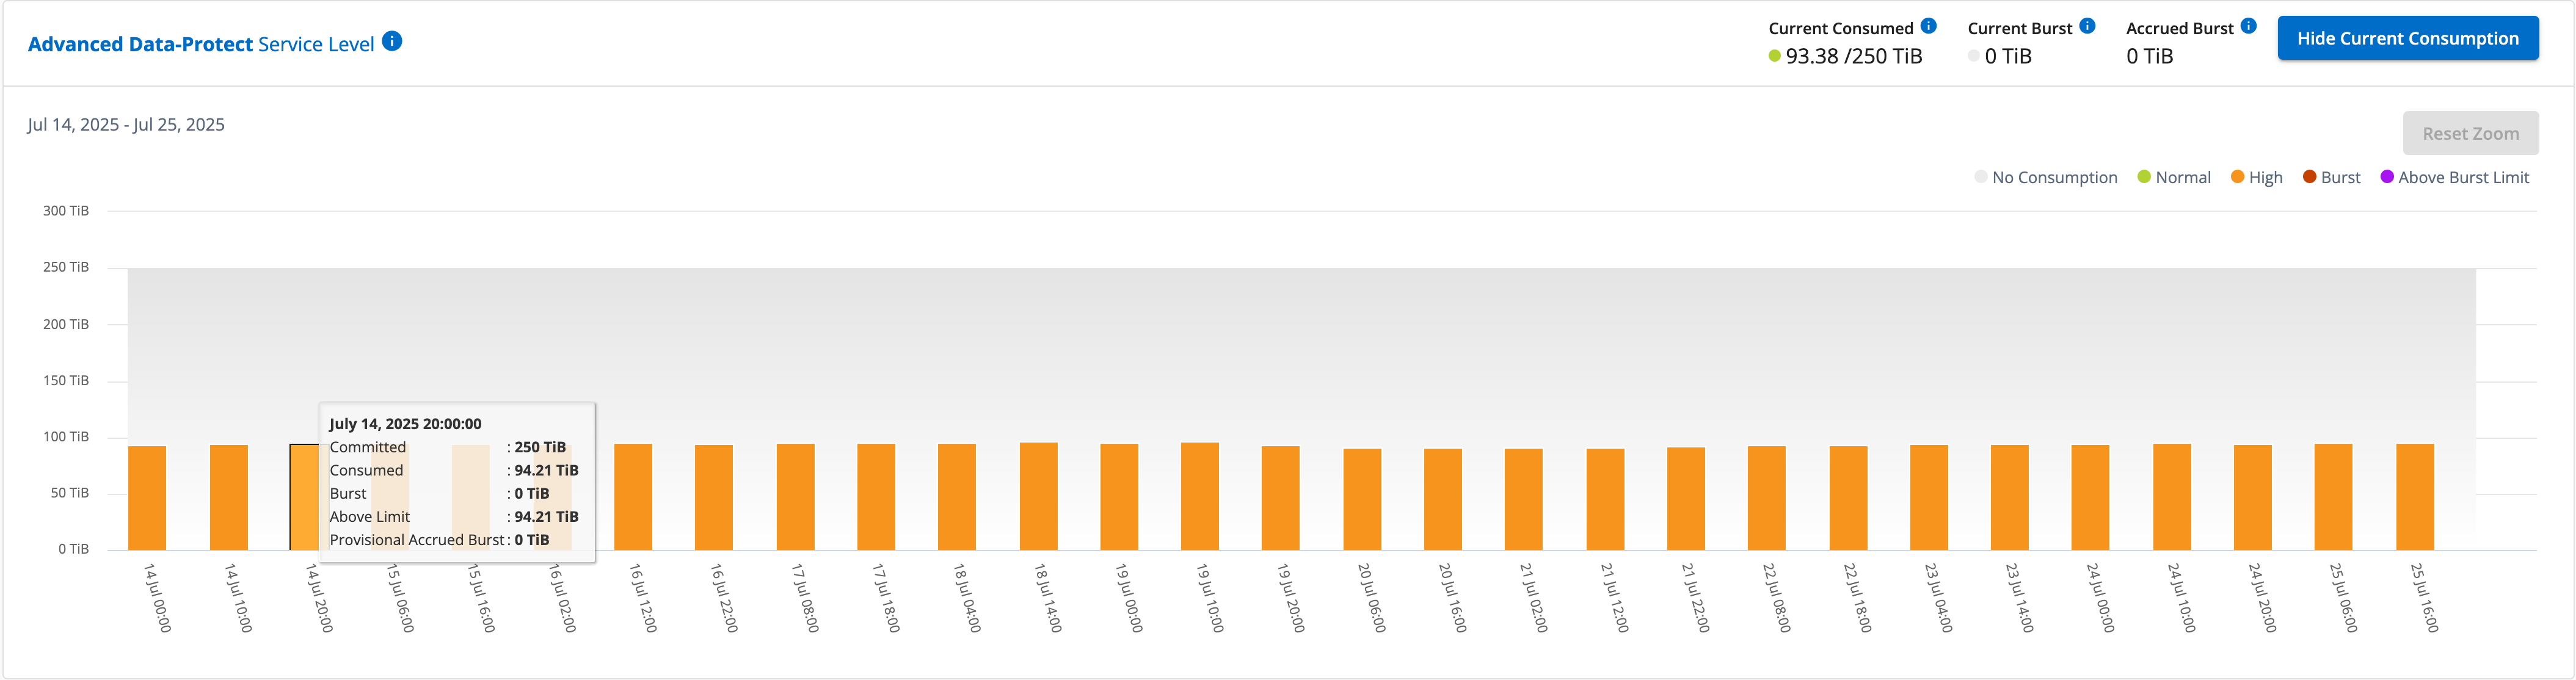
For the Advanced Data-Protect premium performance service level, the chart appears like this for the primary site (Cluster A):
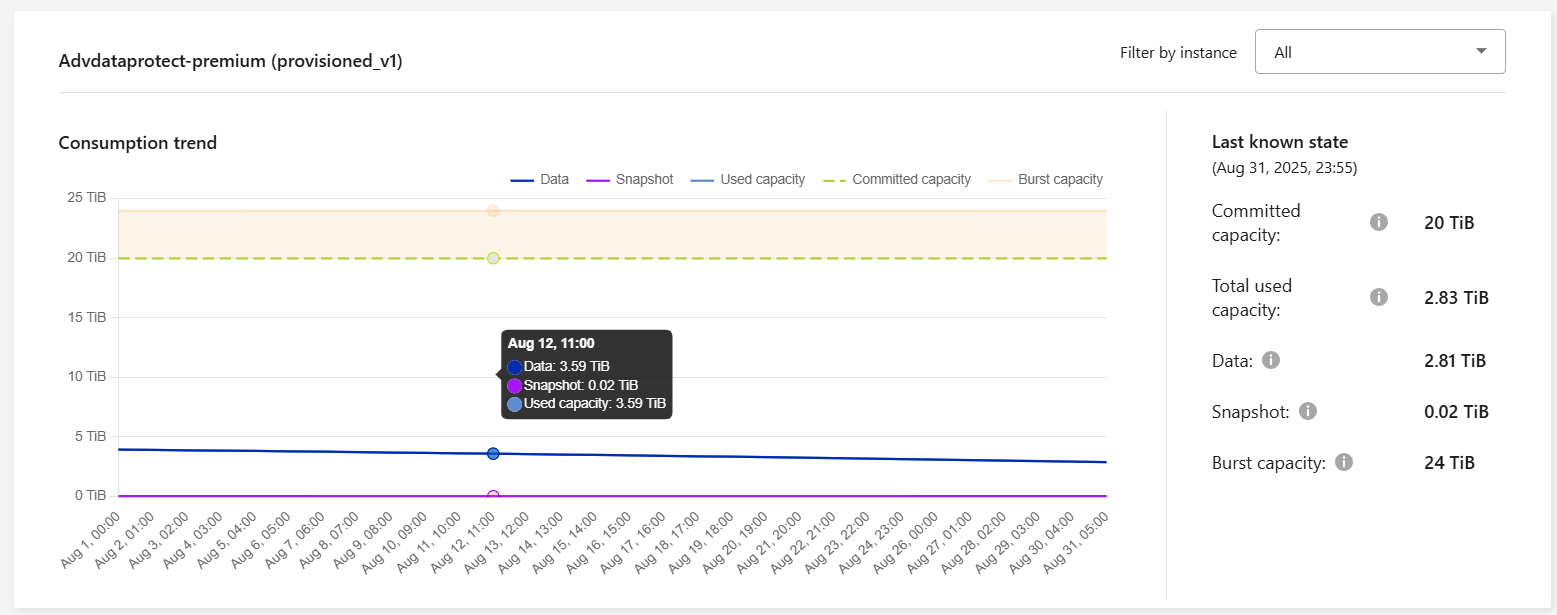
For the Advanced Data-Protect performance service level, the total consumption is split between the primary and mirror sites, and the usage at each site is reflected and billed in a separate subscription; one subscription for the primary site, and another for the mirror site. That is the reason why, when you select the subscription number for the primary site on the Consumption trend tab, the consumption charts for the advanced data protection add-on service display the discrete consumption details of only the primary site. Because each partner site in a MetroCluster configuration acts both as a source and mirror, the total consumption at each site includes the source and the mirror volumes created at that site. For more information, refer to Advanced data protection add-on for Keystone.
-
For information about how MetroCluster protects your data, see Understanding MetroCluster data protection and disaster recovery.
-
Select General > Keystone Subscriptions > Consumption Trend.
-
Select the MetroCluster subscription.
If the clusters in your ONTAP storage environment are configured in a MetroCluster setup, the consumption data of your Keystone subscription is split in the same historical data chart to display the consumption at the primary and mirror sites for the base performance service levels.
The consumption bar charts are split for only the base performance service levels. For advanced data protection add-on service, that is the Advanced Data-Protect performance service level, this demarcation does not appear.
The tooltip next to the tracking ID of your subscription in the Current Consumption tab helps you identify the partner subscription in the MetroCluster setup. Advanced data protection performance service level
For the Advanced Data-Protect performance service level, the total consumption is split between the partner sites, and the usage at each partner site is reflected and billed in a separate subscription; one subscription for the primary site, and another for the mirror site. That is the reason why, when you select the subscription number for the primary site on the Consumption Trend tab, the consumption charts for the advanced data protection add-on service display the discrete consumption details of only the primary site. Because each partner site in a MetroCluster configuration acts both as a source and mirror, the total consumption at each site includes the source and the mirror volumes created at that site.Base performance service levels
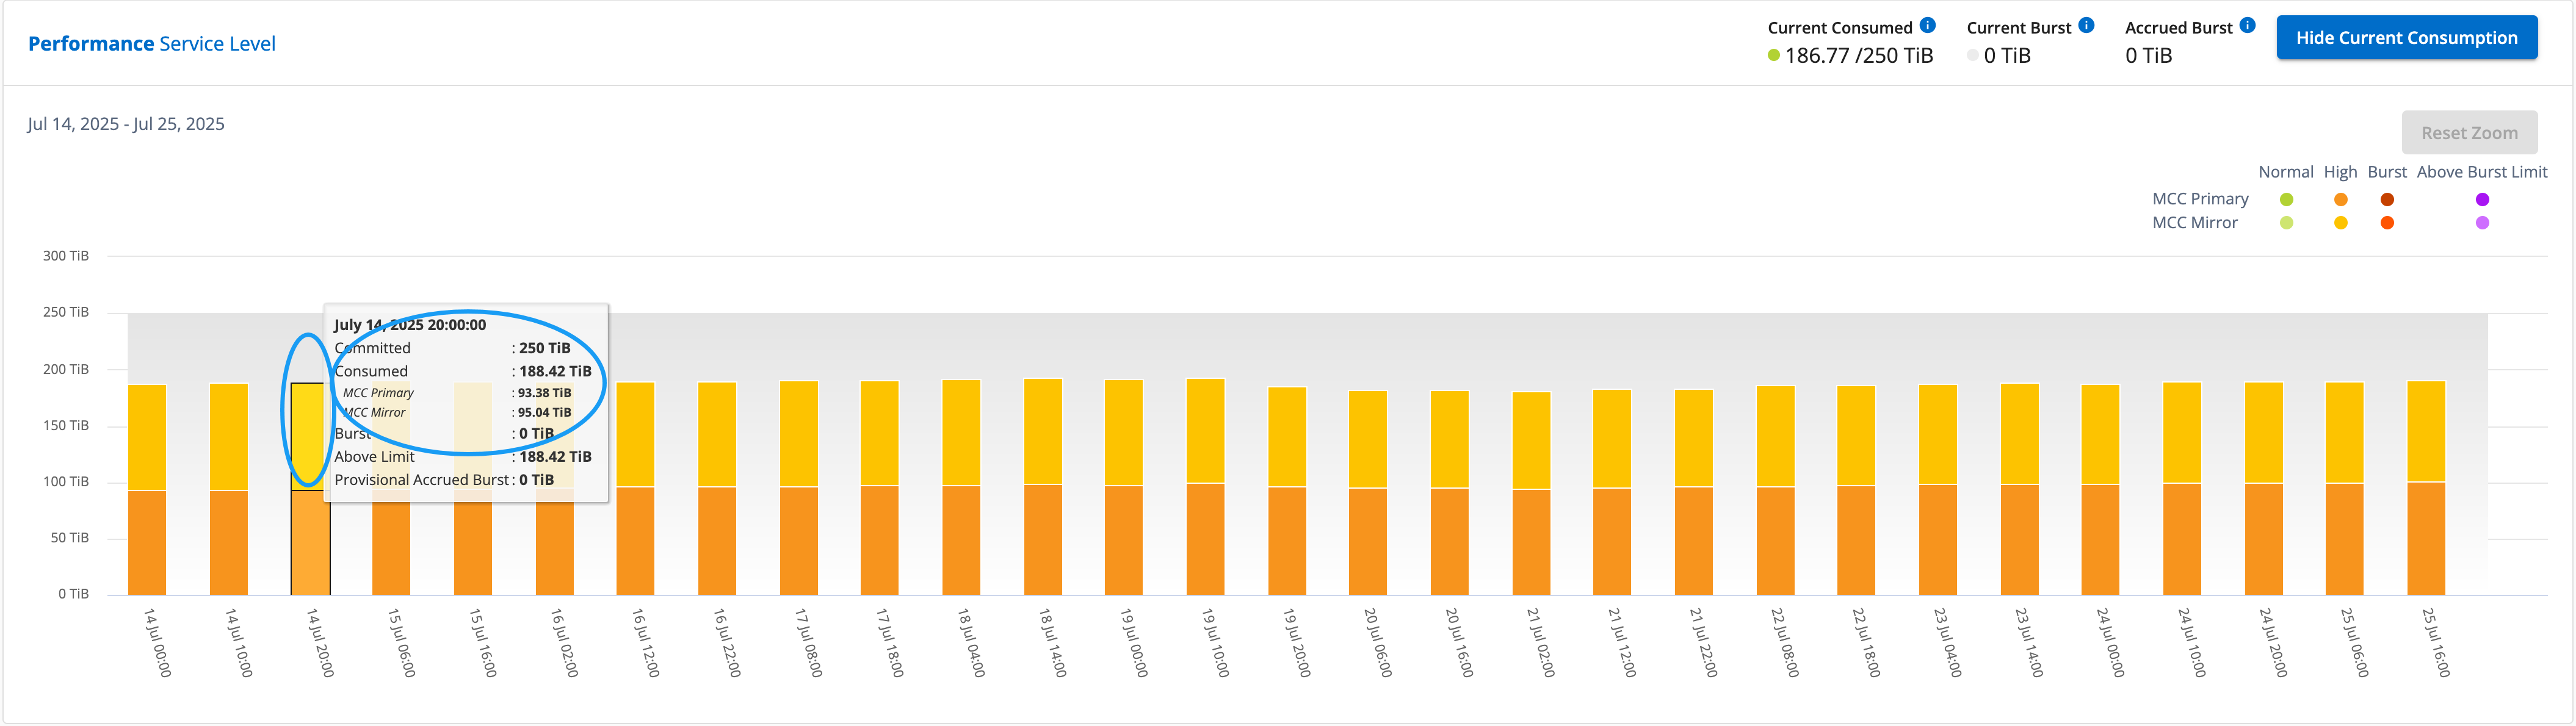
For the base performance service levels, each volume is charged as provisioned at the primary and mirror sites, and hence the same bar chart is split according to the consumption at the primary and mirror sites.Primary subscription view
The following image displays the charts for the Performance service level (base performance service level). The same historical data chart also indicates the mirror site consumption in a lighter shade of the same color code used for the primary site. Hover over the chart to view the consumption breakdown in TiB for each site. In this example, the values are 95.04 TiB for the primary site and 93.38 TiB for the mirror site.

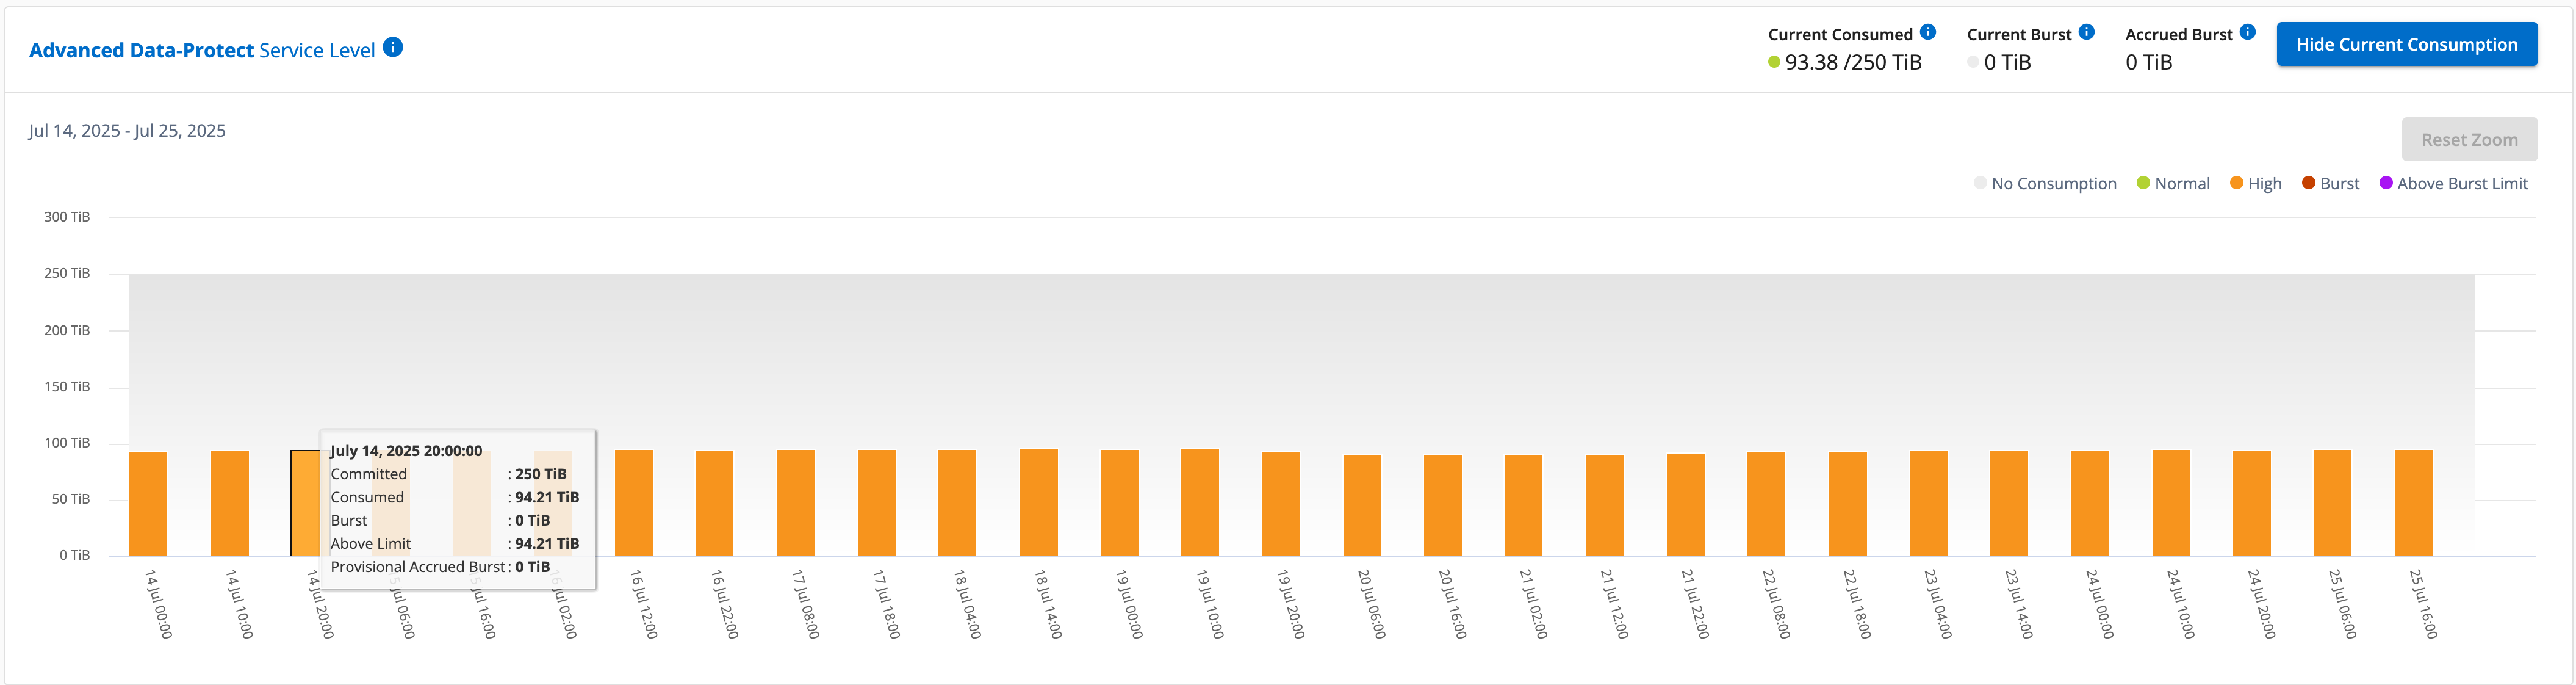
For the Advanced Data-Protect performance service level, the chart appears like this:
The displayed consumption of 94.21 TiB represents the usage for the primary subscription. Given that advanced data protection splits consumption between partner sites with separate subscriptions, this chart shows only the primary site usage. To learn about pricing for the advanced data protection add-on service, refer to Understand pricing.
Mirror subscription view
When you check the mirror subscription, you can see that the bar chart for the Performance service level (base performance service level) at the same data collection point as the partner site is reversed, and the consumption breakup at the primary and mirror sites is 93.38 TiB and 95.04 TiB respectively.
For the Advanced Data-Protect performance service level, the chart appears like this for the same collection point as at the partner site:
For information about how MetroCluster protects your data, see Understanding MetroCluster data protection and disaster recovery.
Related information