

 Release notes
View the health of your disaster recovery plans on the Dashboard
 Suggest changes
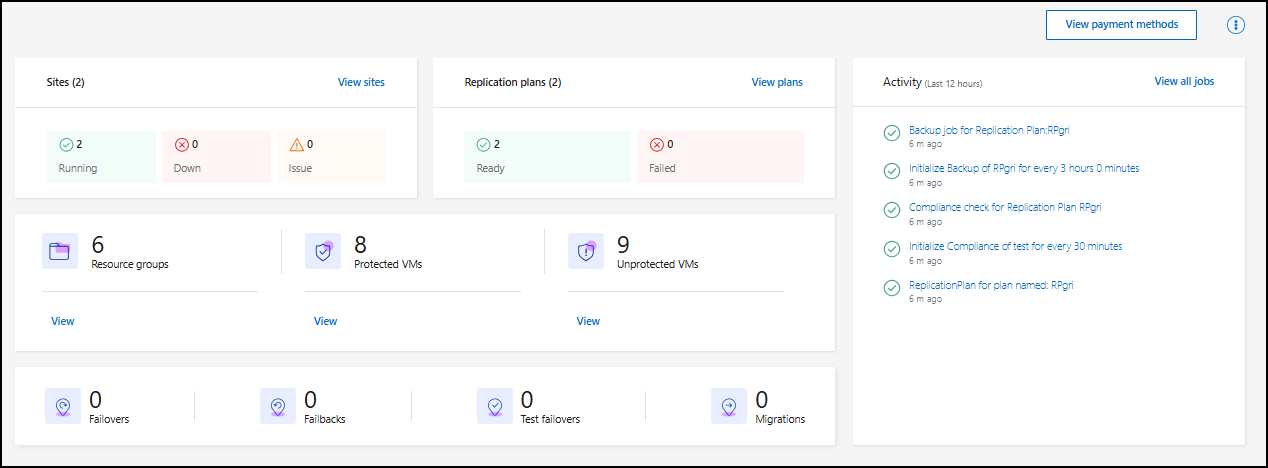
Using the BlueXP disaster recovery Dashboard, you can determine the health of your disaster recovery sites and replication plans. You can quickly ascertain which sites and plans are healthy, disconnected, or degraded.
-
From the BlueXP left nav, select Protection > Disaster recovery.
-
From the BlueXP disaster recovery top menu, select Dashboard.
-
Review the following information on the Dashboard:
-
Sites: View the health of your sites. A site can have one of the following statuses:
-
Running: The vCenter is connected, healthy, and running.
-
Down: The vCenter is not reachable or having connectivity issues.
-
Issue: The vCenter is not reachable or having connectivity issues.
To see site details, select View all for a status or View sites to see them all.
-
-
Replication plans: View the health of your plans. A plan can have one of the following statuses:
-
Ready
-
Failed
To review replication plan details, select View all for a status or View replication plans to see them all.
-
-
Resource groups: View the health of your resource groups. A resource group can have one of the following statuses:
-
Protected VMs: The VMs are part of a resource group.
-
Unprotected VMs: The VMs are not part of a resource group.
To review resource group details, select View all for a status or View resource groups to see them all.
-
-
The number of failovers, test failovers, and migrations. For example, if you created two plans and migrated to the destinations, the migration count appears as "2."
-
-
Review all operations in the Activity pane. To view all operations on the Job Monitor, select View all jobs.