

Get an overview of data tiering from your clusters in NetApp Cloud Tiering
 Suggest changes
NetApp Cloud Tiering provides an aggregated view of data tiering from each of your on-premises clusters. This overview provides a clear picture of your environment and enables you to take proper actions.
Select Cloud Tiering > On-Premises Dashboard to view the following details about your environment.
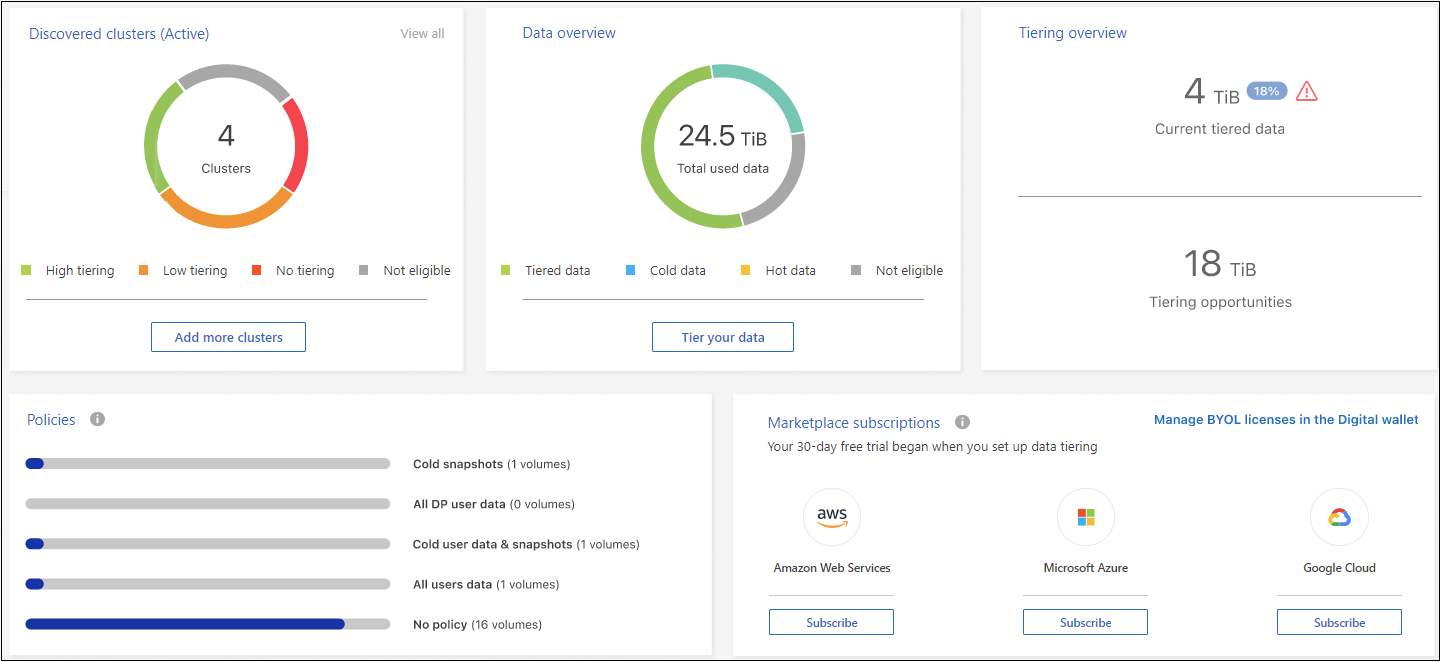
- Discovered clusters
-
The number of on-premises clusters that Cloud Tiering has discovered. The chart provides an overview of the tiering status for these clusters.
-
High tiering - Clusters that are tiering over 20% of their cold data
-
Low tiering - Clusters that are tiering less than 20% of their cold data
-
No tiering - Clusters that aren't tiering any data
-
Not eligible - Clusters that don't support data tiering
-
- Data overview
-
The amount of data that is being used by all discovered clusters. he chart shows how much data is being tiered for these clusters.
-
Tiered data - Total cold data being tiered to the cloud
-
Cold data - Total cold data that is not being tiered
-
Hot data - Total hot data that is active being used
-
Not eligible - Total data that is not being tiered because the cluster or volume doesn't support data tiering
-
- Tiering overview
-
The amount of data that is currently being tiered, and the amount of cold data that could potentially be tiered.
- Policies
-
The number of times that each tiering policy has been applied to a volume.
- Marketplace subscriptions
-
The number of clusters associated with each type of Marketplace Subscription and an indication about your subscription status.