

Monitor infrastructure with Prometheus or Fluentd connections
 Suggest changes
You can configure several optional settings to enhance your Astra Control Center experience. To monitor and gain insight into your complete infrastructure, configure Prometheus or add a Fluentd connection.
If the network where you're running Astra Control Center requires a proxy for connecting to the Internet (to upload support bundles to the NetApp Support Site), you should configure a proxy server in Astra Control Center.
Add a proxy server for connections to the NetApp Support Site
If the network where you're running Astra Control Center requires a proxy for connecting to the Internet (to upload support bundles to the NetApp Support Site), you should configure a proxy server in Astra Control Center.

|
Astra Control Center does not validate the details you enter for your proxy server. Ensure that you enter correct values. |
-
Log in to Astra Control Center using an account with admin/owner privilege.
-
Select Account > Connections.
-
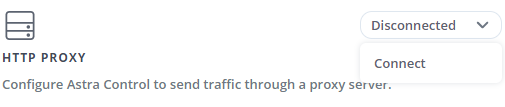
Select Connect from the drop-down list to add a proxy server.
-
Enter the proxy server name or IP address and the proxy port number.
-
If your proxy server requires authentication, select the check box, and enter the username and password.
-
Select Connect.
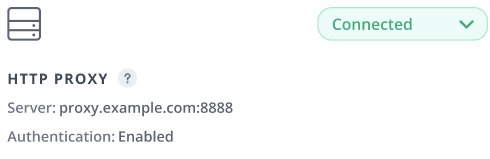
If the proxy information you entered was saved, the HTTP Proxy section of the Account > Connections page indicates that it is connected, and displays the server name.
Edit proxy server settings
You can edit the proxy server settings.
-
Log in to Astra Control Center using an account with admin/owner privilege.
-
Select Account > Connections.
-
Select Edit from the drop-down list to edit the connection.
-
Edit the server details and authentication information.
-
Select Save.
Disable proxy server connection
You can disable the proxy server connection. You'll be warned before you disable that potential disruption to other connections might occur.
-
Log in to Astra Control Center using an account with admin/owner privilege.
-
Select Account > Connections.
-
Select Disconnect from the drop-down list to disable the connection.
-
In the dialog box that opens, confirm the operation.
Connect to Prometheus
You can monitor Astra Control Center data with Prometheus. You can configure Prometheus to gather metrics from the Kubernetes cluster metrics endpoint, and you can use Prometheus also to visualize the metrics data.
For details about using Prometheus, refer to their documentation at Getting started with Prometheus.
Make sure that you have downloaded and installed the Prometheus package on the Astra Control Center cluster or a different cluster that can communicate with the Astra Control Center cluster.
Follow the instructions in the official documentation to Install Prometheus.
Prometheus needs to be able to communicate with the Astra Control Center Kubernetes cluster. If Prometheus is not installed on the Astra Control Center cluster, you need to make sure they can communicate with the metrics service running on the Astra Control Center cluster.
Configure Prometheus
Astra Control Center exposes a metrics service on TCP port 9090 in the Kubernetes cluster. You need to configure Prometheus to collect metrics from this service.
-
Log into the Prometheus server.
-
Add your cluster entry into the
prometheus.ymlfile. In theymlfile, add an entry similar to the following for your cluster in thescrape_configs section:job_name: '<Add your cluster name here. You can abbreviate. It just needs to be a unique name>' metrics_path: /accounts/<replace with your account ID>/metrics authorization: credentials: <replace with your API token> tls_config: insecure_skip_verify: true static_configs: - targets: ['<replace with your astraAddress. If using FQDN, the prometheus server has to be able to resolve it>']
If you set the tls_config insecure_skip_verifytotrue, the TLS encryption protocol is not required. -
Restart the Prometheus service:
sudo systemctl restart prometheus
Access Prometheus
Access the Prometheus URL.
-
In a browser, enter the Prometheus URL with port 9090.
-
Verify your connection by selecting Status > Targets.
View data in Prometheus
You can use Prometheus to view Astra Control Center data.
-
In a browser, enter the Prometheus URL.
-
From the Prometheus menu, select Graph.
-
To use the Metrics Explorer, select the icon next to Execute.
-
Select
scrape_samples_scrapedand select Execute. -
To see sample scraping over time, select Graph.
If multiple cluster data was collected, each cluster's metrics appear in a different color.
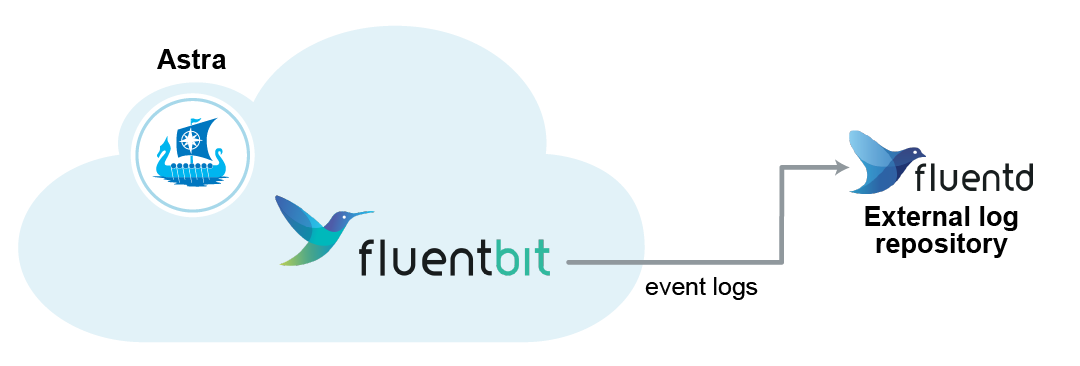
Connect to Fluentd
You can send logs (Kubernetes events) from a system monitored by Astra Control Center to your Fluentd endpoint. The Fluentd connection is disabled by default.
|
|
Fluentd connections are not supported for clusters managed with declarative Kubernetes workflows. You can only connect Fluentd to clusters managed with non-Kubernetes-native workflows. |
|
|
Only the event logs from managed clusters are forwarded to Fluentd. |
-
An Astra Control Center account with admin/owner privileges.
-
Astra Control Center installed and running on a Kubernetes cluster.
|
|
Astra Control Center does not validate the details you enter for your Fluentd server. Ensure that you enter the correct values. |
-
Log in to Astra Control Center using an account with admin/owner privilege.
-
Select Account > Connections.
-
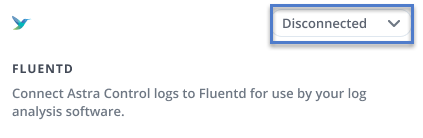
Select Connect from the drop-down list where it shows Disconnected to add the connection.
-
Enter the host IP address, the port number, and shared key for your Fluentd server.
-
Select Connect.
If the details you entered for your Fluentd server were saved, the Fluentd section of the Account > Connections page indicates that it is connected. Now you can visit the Fluentd server that you connected and view the event logs.
If the connection failed for some reason, the status shows Failed. You can find the reason for failure under Notifications at the top-right side of the UI.
You can also find the same information under Account > Notifications.
|
|
If you are having trouble with log collection, you should log in to your worker node and ensure that your logs are available in /var/log/containers/.
|
Edit the Fluentd connection
You can edit the Fluentd connection to your Astra Control Center instance.
-
Log in to Astra Control Center using an account with admin/owner privilege.
-
Select Account > Connections.
-
Select Edit from the drop-down list to edit the connection.
-
Change the Fluentd endpoint settings.
-
Select Save.
Disable the Fluentd connection
You can disable the Fluentd connection to your Astra Control Center instance.
-
Log in to Astra Control Center using an account with admin/owner privilege.
-
Select Account > Connections.
-
Select Disconnect from the drop-down list to disable the connection.
-
In the dialog box that opens, confirm the operation.