

View governance details about the data stored in your organization with NetApp Data Classification
 Suggest changes
Gain control of the costs related to the data on your organization's storage resources. NetApp Data Classification identifies the amount of stale data, duplicate files, and very large files in your systems so you can decide whether you want to remove or tier some files to less expensive object storage.
This is where you should begin your research. From the Governance dashboard, you can select an area for further investigation.
Additionally, if you're planning to migrate data from on-premises locations to the cloud, you can view the size of the data and whether any of the data contains sensitive information before moving it.
Review the Governance dashboard
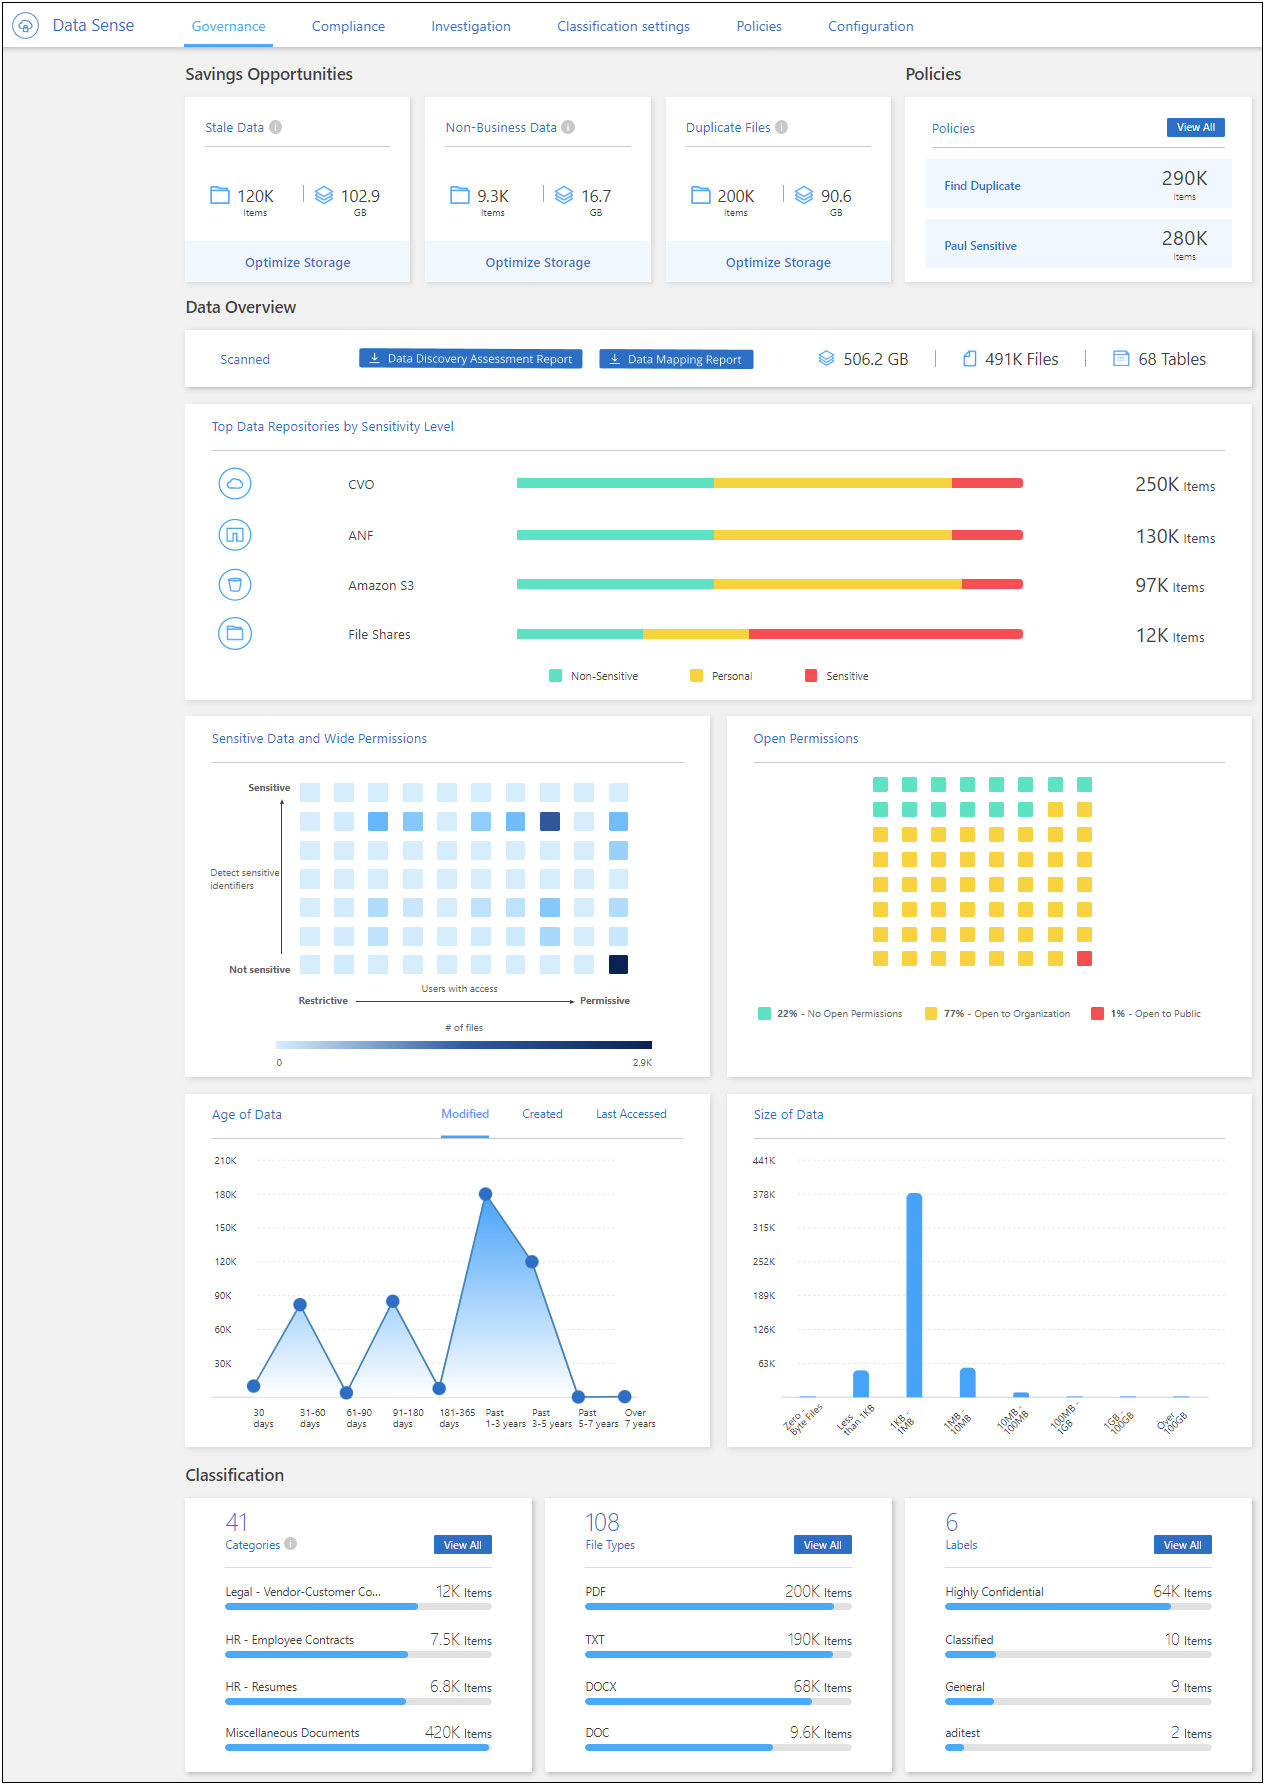
The Governance dashboard provides information so that you can increase the efficiency and control the costs related to the data stored on your storage resources.
-
From the NetApp Console menu, select Governance > Classification.
-
Select Governance.
The Governance dashboard appears.
Review savings opportunities
The Saving Opportunities component shows data that you can delete or tier to less expensive object storage. The data in Saving Opportunities update every 2 hours. You can also manually update the data.
-
From the Data Classification menu, select Governance.
-
Within each Savings Opportunities tile of the Governance dashboard, select Optimize Storage to view the filtered results in the Investigation page. To discover any data you should delete or tier to less expensive storage, investigate the the Saving Opportunities.
-
Stale Data - By default, data is considered stale if it was last modified over 3 years ago. You can [customize the definition of stale data](task-stale-data.html).
-
Duplicate Files - Files that are duplicated in other locations in the data sources you are scanning. See what types of duplicate files are displayed.
-

|
If any of your data sources implement data tiering, old data that already resides in object storage can be identified in the Stale Data category. |
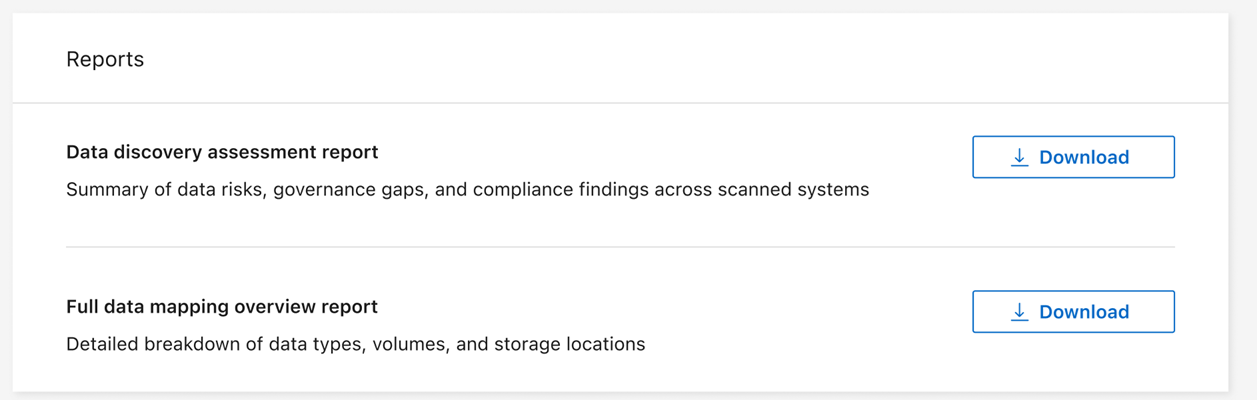
Create the data discovery assessment report
The data discovery assessment report provides a high-level analysis of the scanned environment to show areas of concern and potential remediation steps. The results are based on both mapping and classifying your data. The goal of this report is to raise awareness of three significant aspects of your dataset:
| Feature | Description |
|---|---|
Data governance concerns |
A detailed picture of all the data you own and areas where you may be able to reduce the amount of data to save costs. |
Data security exposures |
Areas where your data is accessible to internal or external attacks because of broad access permissions. |
Data compliance gaps |
Where your personal or sensitive personal information is located for both security and for DSARs (data subject access requests). |
With the report, you can take the following actions:
-
Reduce storage costs by changing your retention policy, or by moving or deleting certain data (stale or duplicate data).
-
Protect your data that has broad permissions by revising global group management policies.
-
Protect your data that has personal or sensitive personal information by moving PII to more secure data stores.
-
From Data Classification, select Governance.
-
In the reports tile, select Data Discovery Assessment Report.
Data Classification generates a PDF report that you can review and share.
Create the data mapping overview report
The data mapping overview report provides an overview of the data being stored in your corporate data sources to assist you with decisions of migration, back up, security, and compliance processes. The report summarizes all systems and data sources. It also provides an analysis for each system.
The report includes the following information:
| Category | Description |
|---|---|
Usage Capacity |
For all systems: Lists the number of files and the used capacity for each system. |
Age of Data |
Provides three charts and graphs for when files were created, last modified, or last accessed. Lists the number of files, and their used capacity, based on certain date ranges. |
Size of Data |
Lists the number of files that exist within certain size ranges in your systems. |
-
From Data Classification, select Governance.
-
In the reports tile, select Full data mapping overview report.
Data Classification generates a PDF report that you can review and send to other groups as needed.
If the report is larger than 1 MB, the PDF file is retained on the Data Classification instance and you'll see a pop-up message about the exact location. When Data Classification is installed on a Linux machine on your premises, or on a Linux machine you deployed in the cloud, you can navigate directly to the PDF file. When Data Classification is deployed in the cloud, you need to authorize with SSH to the Data Classification instance to download the PDF file.
Review the top data repositories listed by data sensitivity
The Top Data Repositories by Sensitivity Level area of the Data Mapping Overview report lists the top four data repositories (systems and data sources) that contain the most sensitive items. The bar chart for each system is divided into:
-
Non-sensitive data
-
Personal data
-
Sensitive personal data
This data refreshes every two hours and can be manually refreshed.
-
To see the total number of items in each category, position your cursor over each section of the bar.
-
To filter results that will appear in the Investigation page, select each area in the bar and investigate further.
Review sensitive data and wide permissions
The Sensitive Data and Wide Permissions area of the Governance dashboard shows the counts for files that contain sensitive data and have wide permissions. The table shows the following types of permissions:
-
From the most restrictive permissions to the most permissive restrictions on the horizontal axis.
-
From the least sensitive data to the most sensitive data on the vertical axis.
-
To see the total number of files in each category, position your cursor over each box.
-
To filter results that will appear in the Investigation page, select a box and investigate further.
Review data listed by types of open permissions
The Open Permissions area of the Data Mapping Overview report shows the percentage for each type of permissions that exist for all files that are being scanned. The chart shows the following types of permissions:
-
No Open Permissions
-
Open to Organization
-
Open to Public
-
Unknown Access
-
To see the total number of files in each category, position your cursor over each box.
-
To filter results that will appear in the Investigation page, select a box and investigate further.
Review the age and size of data
You can investigate the items in the Age and Size graphs of the Data Mapping Overview report to see if there is any data you should delete or tier to less expensive object storage.
-
In the Age of Data chart, to see details about the age of the data, position your cursor over a point in the chart.
-
To filter by an age or size range, select that age or size.
-
Age of Data graph - Categorizes data based on the time it was created, the last time it was accessed, or the last time it was modified.
-
Size of Data graph - Categorizes data based on size.
-
|
|
If any of your data sources implement data tiering, old data that already resides in object storage might be identified in the Age of Data graph. |