

What's New with Data Infrastructure Insights
 Suggest changes
NetApp is continually improving and enhancing its products and services. Here are some of the latest features and functionalities available in Data Infrastructure Insights (formerly Cloud Insights).
July 2026
New AI Assistant Starting Page
The DII AI Assistant now features a dedicated starting page, putting intelligent infrastructure analysis front and center. Start new conversations instantly, resume your last session with one click, or get started quickly with suggested prompts.
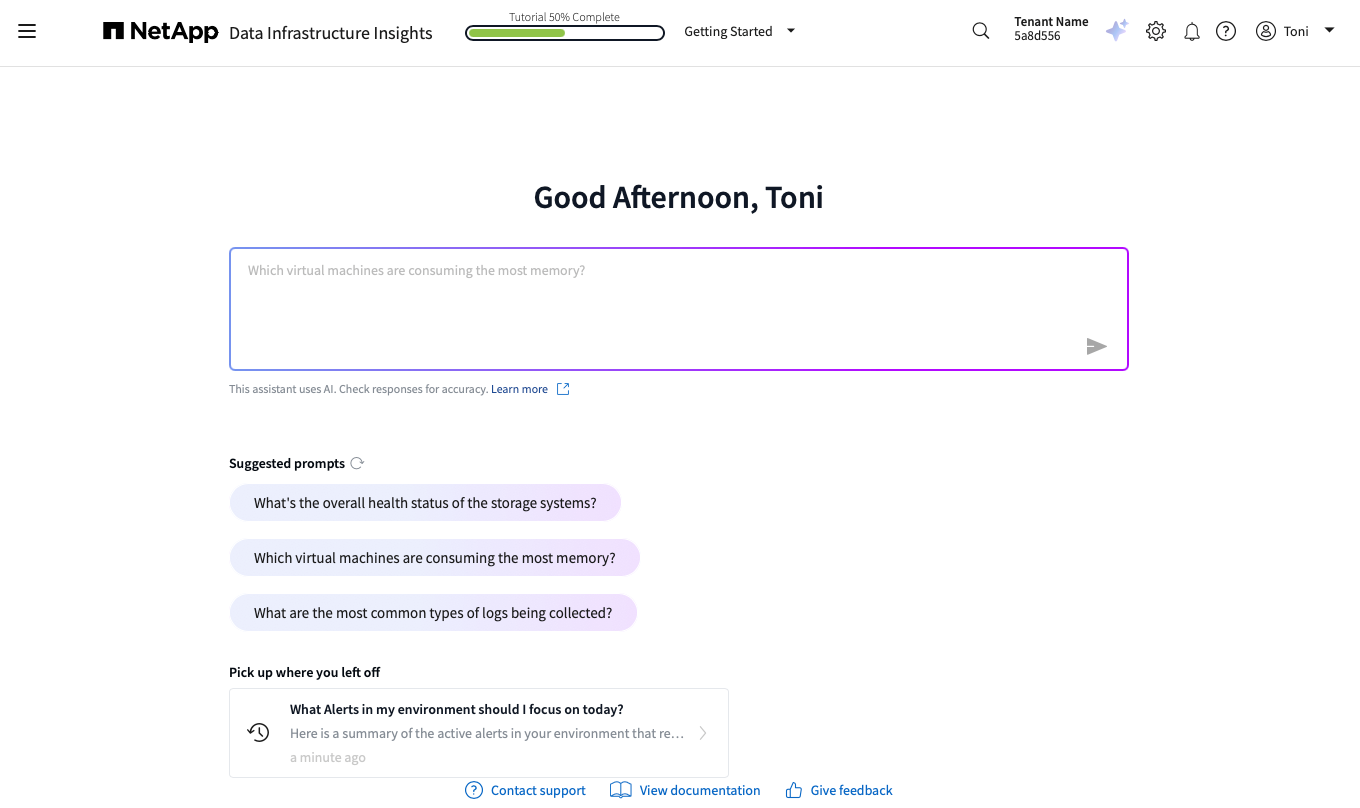
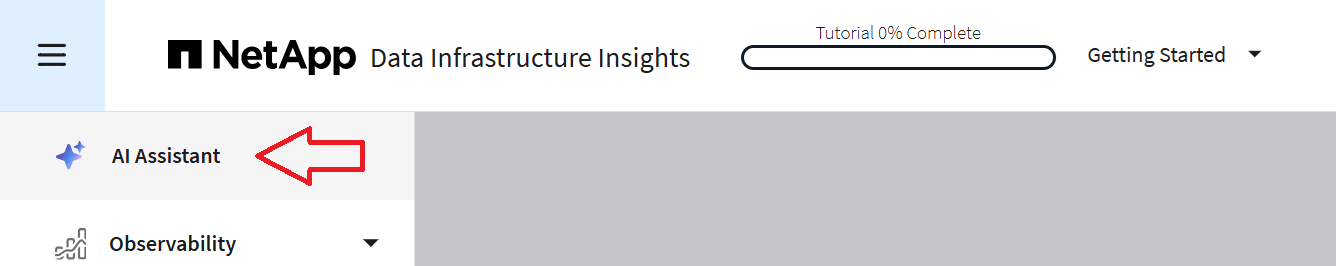
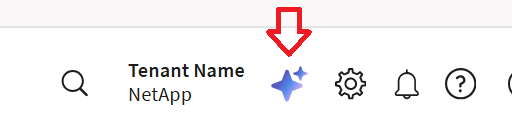
Access the starting page from AI Assistant in the navigation menu or open the AI Assistant from anywhere using the "stars" icon in the top left.
June 2026
Share Important Updates with Login Messages
Keep your team informed and aligned with customizable login messages. Communicate important announcements, maintenance schedules, or policy updates directly to users when they log in. With markdown support, you can format messages for clarity and ensure critical information reaches every DII user. Accounts with admin privileges can find the configuration in the Admin menu under Notifications.
More Workspace, Less Clutter
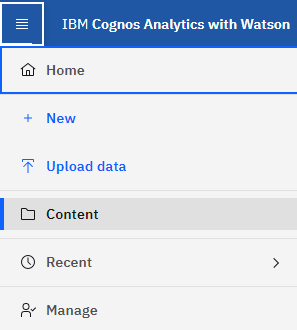
The DII navigation menu has a fresh new look, now matching the colors and behavior of Console for a more unified experience. The previously static main menu will be collapsed by default for a more focused workspace and efficient use of on-screen real estate. Simply click the hamburger icon (☰) in the top left corner to access it.
Expand Device Visibility with Intelligent AI Assistance
Accelerate onboarding of new devices with AI-powered device identification. Data Infrastructure Insights analyzes your environment and suggests Automatic Device Resolution rules, helping you quickly identify and manage more devices. Simply review and approve the AI-generated rules and DII handles the rest, improving device visibility and management across your infrastructure.
A Smarter AI Assistant for Global Teams
The AI Assistant now supports more than a dozen languages, empowering your team to engage naturally in their preferred language. See the full list here.
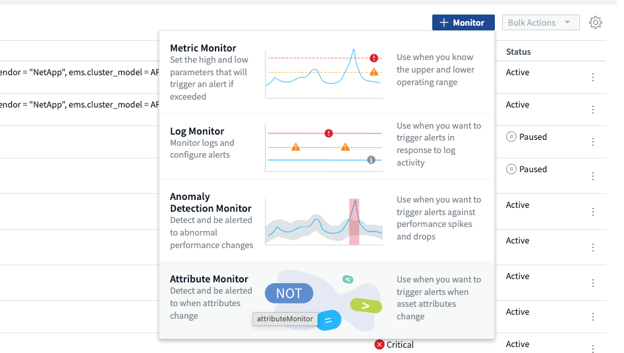
New Monitors for Infrastructure Attribute Changes
Attribute Monitors are now available to automatically alert your team when assets move between data centers, a storage pool is not encrypted, or any attribute modifications occur. This helps to maintain configuration baselines and helps ensure nothing slips through the cracks during new deployments or changes.
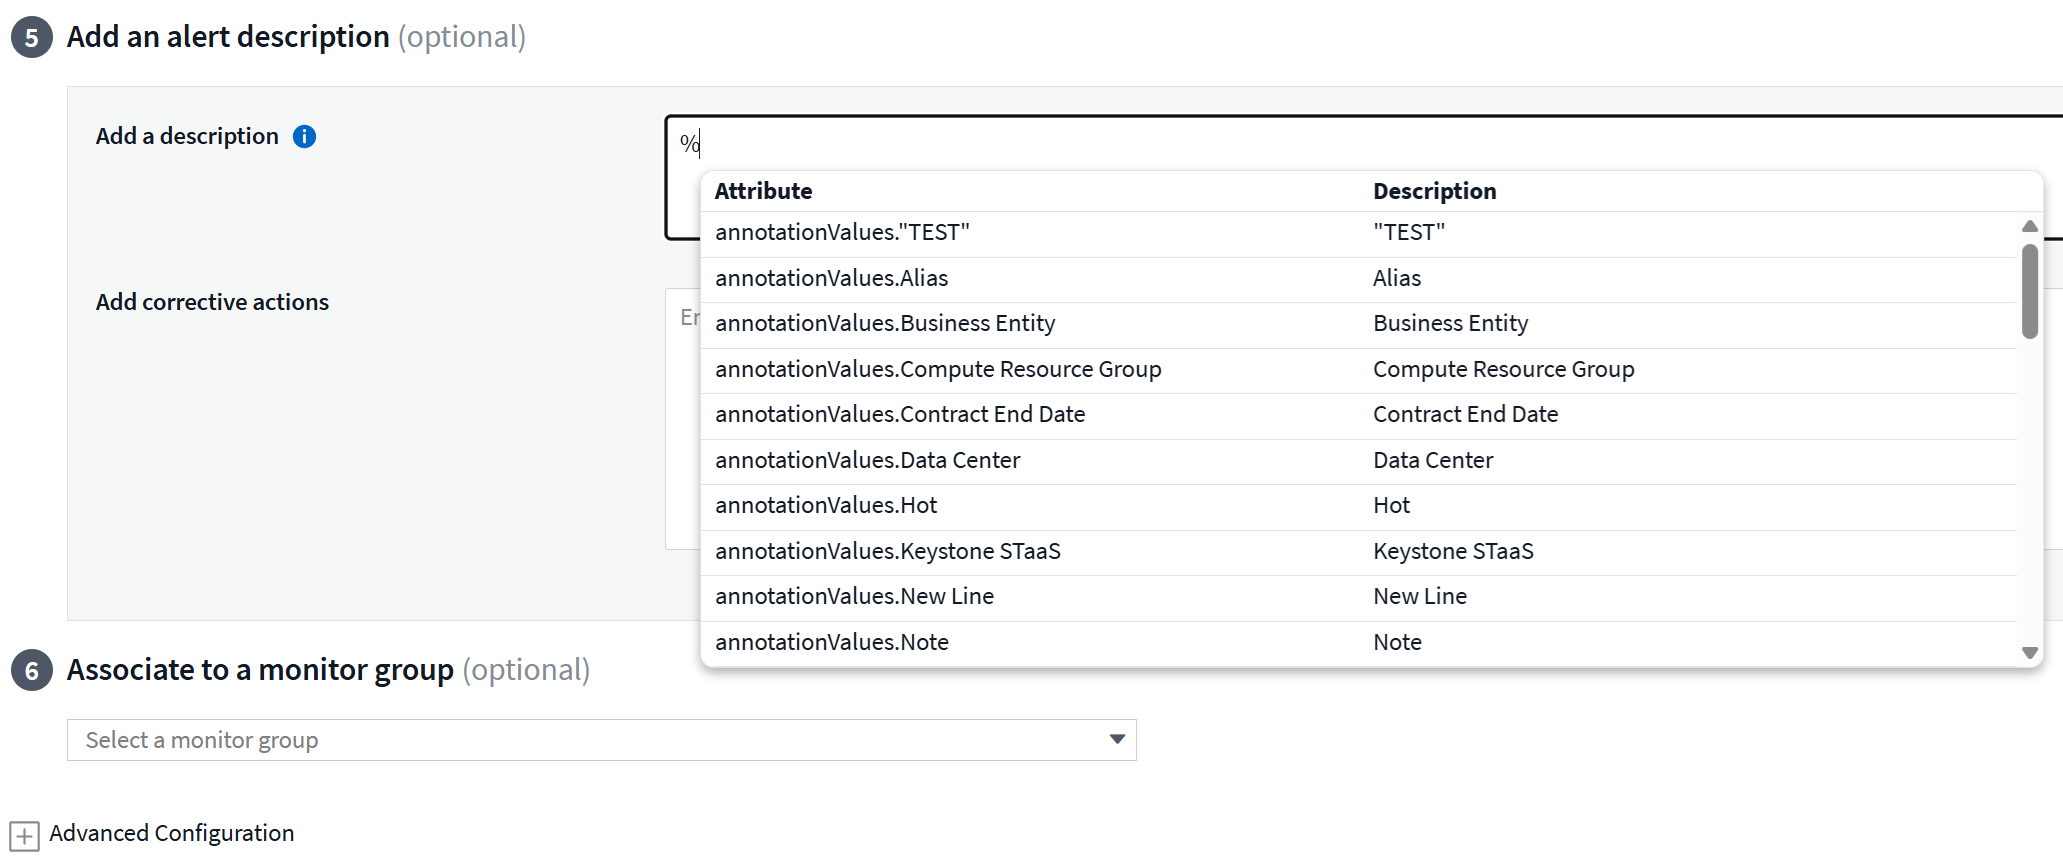
Build smarter alerts and webhooks with dynamic, context rich messages
When creating a monitor or webhook, simply type "%" in the alert description or webhook URL, header, or body to select from a dynamically populated list of available object attributes and annotations. Give your alerts the right context to improve clarity, enhance webhook integration, and speed up response times.
April 2026
DII Knows Your Environment Better Than Ever
We've made enhancements to how the AI in Data Infrastructure Insights understands your setup. Drawing on richer context about your current usage of the service, the configuration, and the performance patterns before it responds. The result is initial guidance that reflects your environment rather than a generic starting point, with fewer follow-ups needed to get to a useful answer.
For example, navigate to a storage device and the AI Assistant provides one-click answers to questions such as:
-
How is this storage's capacity utilization trending, and which StoragePools are consuming the most space?
-
Can you show me the capacity utilization trend for this device over the last 24 hours?
-
Which volumes are consuming the most space on this storage?
March 2026
AI Assistant is now Generally Available
The Data Infrastructure Insights AI Assistant is now generally available to all customers for DII sites hosted on AWS.
Note that the AI Assistant on Azure sites is still in Preview. Watch this space for announcement of general availability.
Infrastructure Insights features removed
DII's "Infrastructure Insights" features of Shared Resources Under Stress, Kubernetes Namespaces Running out of Space, and Reclaiming ONTAP Cold Storage are no longer available in DII.
February 2026
Instant intelligent answers about your infrastructure
Meet your infrastructure's new intelligent partner: The Data Infrastructure Insights AI Assistant transforms how you interact with your data, turning complex queries into simple conversations. Instantly uncover hidden patterns, accelerate troubleshooting, and make data-driven decisions with confidence. Get instant answers to questions like:
-
How can I configure a monitor to alert for persistent unacceptable latency?
-
What are the top storage pools with the highest utilization in the environment?
-
How many alerts were generated in the last hour?
The DII AI Assistant Preview is available now to most customers with service hosted on AWS regions; Azure region is coming soon. Learn more about Data Infrastructure Insights Preview features.
![]()
Monitor Improvements
Customize System Monitors Faster, Without Duplicating
Modify default system monitors directly to suit your needs—change names, filters, and grouping in one place. No need to create duplicate monitors for simple adjustments. A helpful banner reminds you which monitors have been customized, maintaining full visibility into your monitoring configuration.
Streamline Monitor Management with Bulk Actions
Manage multiple monitors at once through Bulk Actions. Quickly adjust Health Monitoring settings for groups of monitors, saving you time and reducing complexity. Update your monitoring strategy across the board in seconds, not minutes.
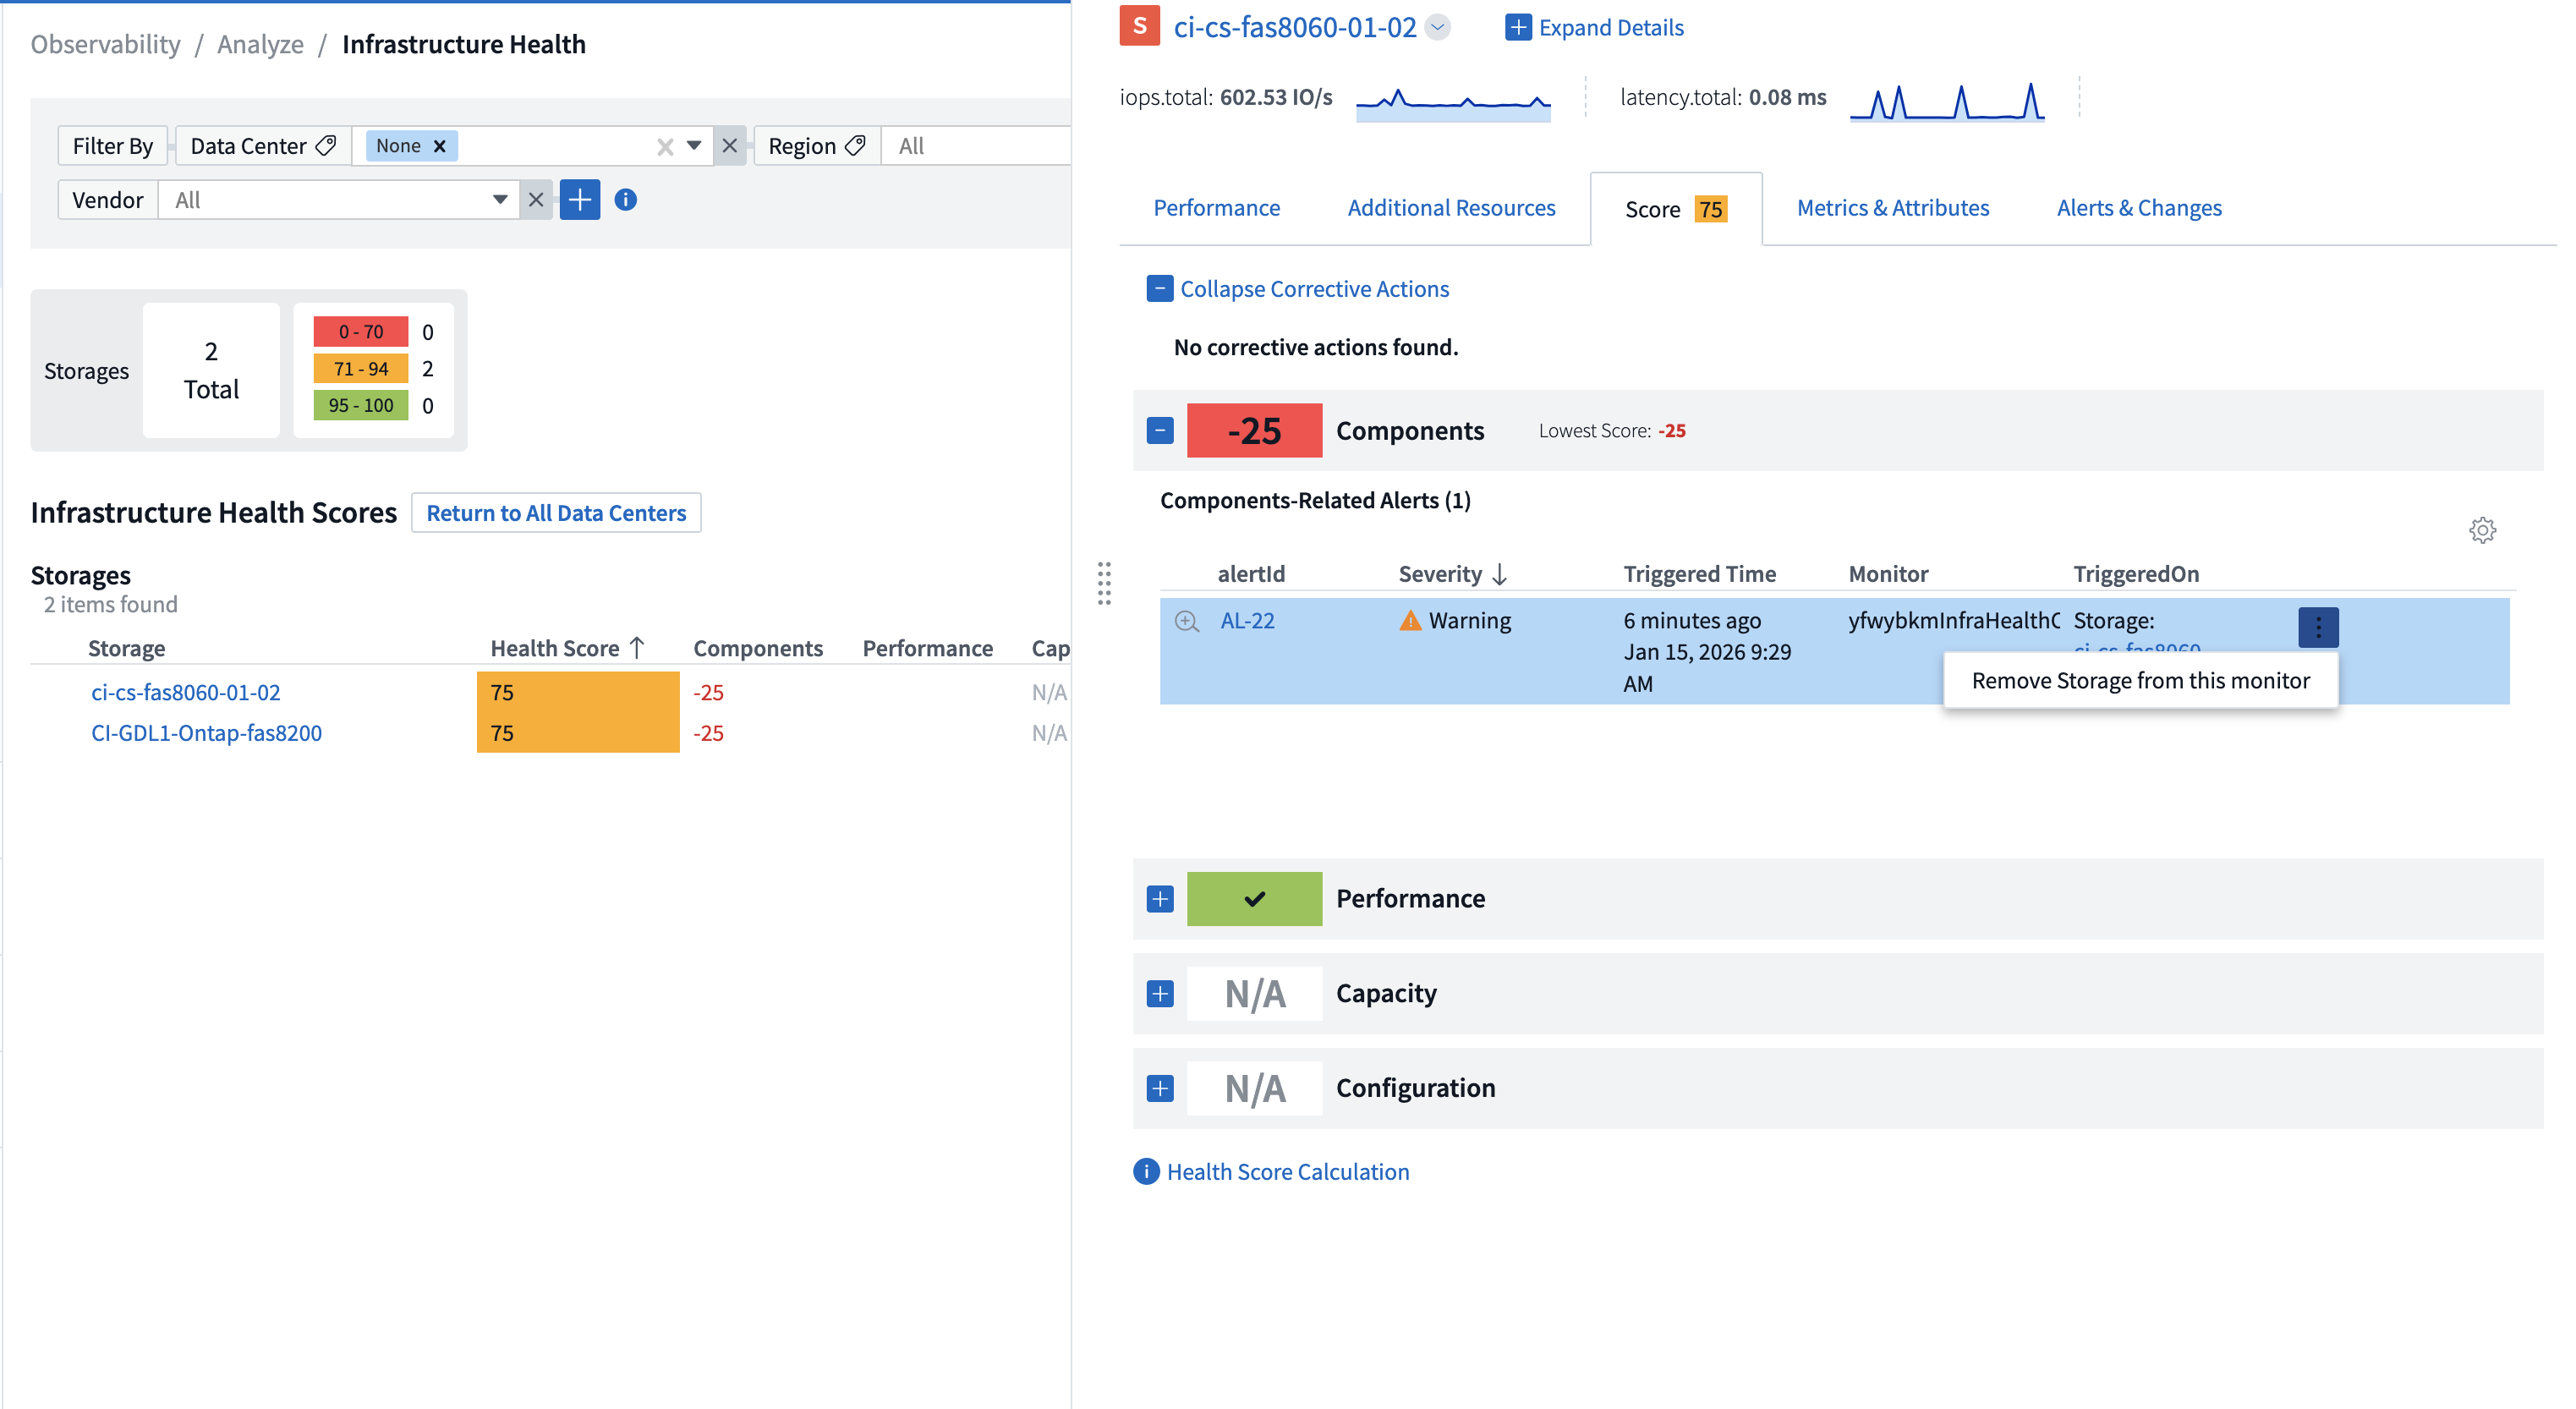
Focus Your Infrastructure Health Scores on What Matters Most
Exclude specific objects from your Infrastructure Health scores to maintain accuracy and relevance. When viewing your Infrastructure Health dashboard, instantly remove objects you want to deprioritize without modifying the monitor configuration. This focuses your alerts on the infrastructure elements that drive your business priorities.
Operating System support
The following Linux operating systems are currently supported with Data Infrastructure Insights Acquisition Units:
-
AlmaLinux 9.5 and 10
-
Centos (64-bit): Stream 9
-
Debian (64-bit): 11 through 13
-
OpenSUSE Leap 15.2 through 15.6, 16
-
Oracle Enterprise Linux (64-bit): 8.10, 9.2, 9.4, 9.6, 10
-
Red Hat (64-bit): 8.10, 9.2, 9.4, 9.6, 10
-
Rocky 9.2 through 9.6
-
SUSE Linux Enterprise Server 15 SP4 through 15 SP7, 16
-
Ubuntu Server: 20.04, 22.04, 24.04 LTS
-
SELinux on the above platforms
December 2025
Control Query Access with Shared Queries
Share queries you create with fine-grained permission controls. Choose read-only Viewer mode to prevent modifications or Edit mode to allow changes. Private queries are accessible by creators, while Shared queries can be leveraged in Annotation Rules or duplicated for specialized use cases, giving you complete control over how queries are used and modified across your organization.
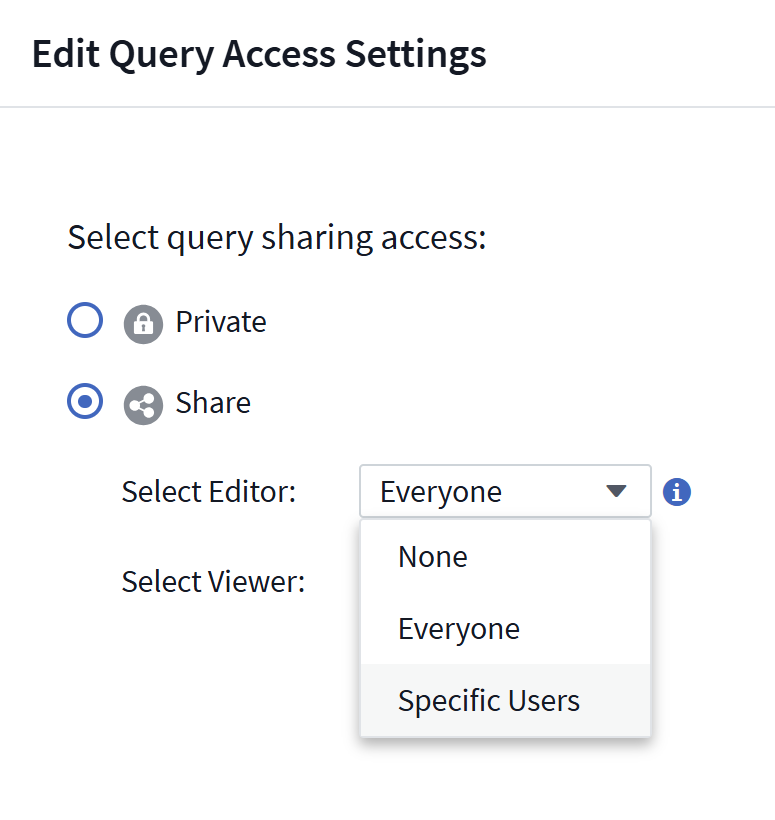
Additionally, users with Guest role can now create and manage their own private queries.
Better Filtering When Managing Monitors
Filtering for Monitor lists and groups is improved to add wildcard support, multiple filters, include/exclude functionality, and more.

Cleaner dashboard visualizations
Improved dashboard design helps you see what matters most. Enhanced visual clarity with drop shadow borders that separate widgets and removed separator lines to reduce clutter so you can focus on your data insights. These refinements create a cleaner, more intuitive dashboard experience that makes spotting trends and anomalies faster and easier.
November 2025
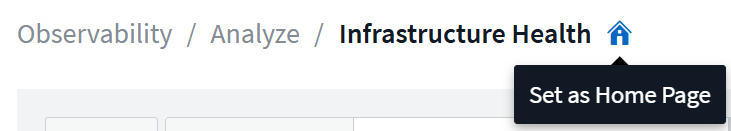
Set Your Personalized Home Page
Streamline your daily monitoring workflow by setting any Data Infrastructure Insights page as your personalized home page. Each user can select a different home page to focus on what's important to them: a critical dashboard, alerts, infrastructure health, workload security, or more.
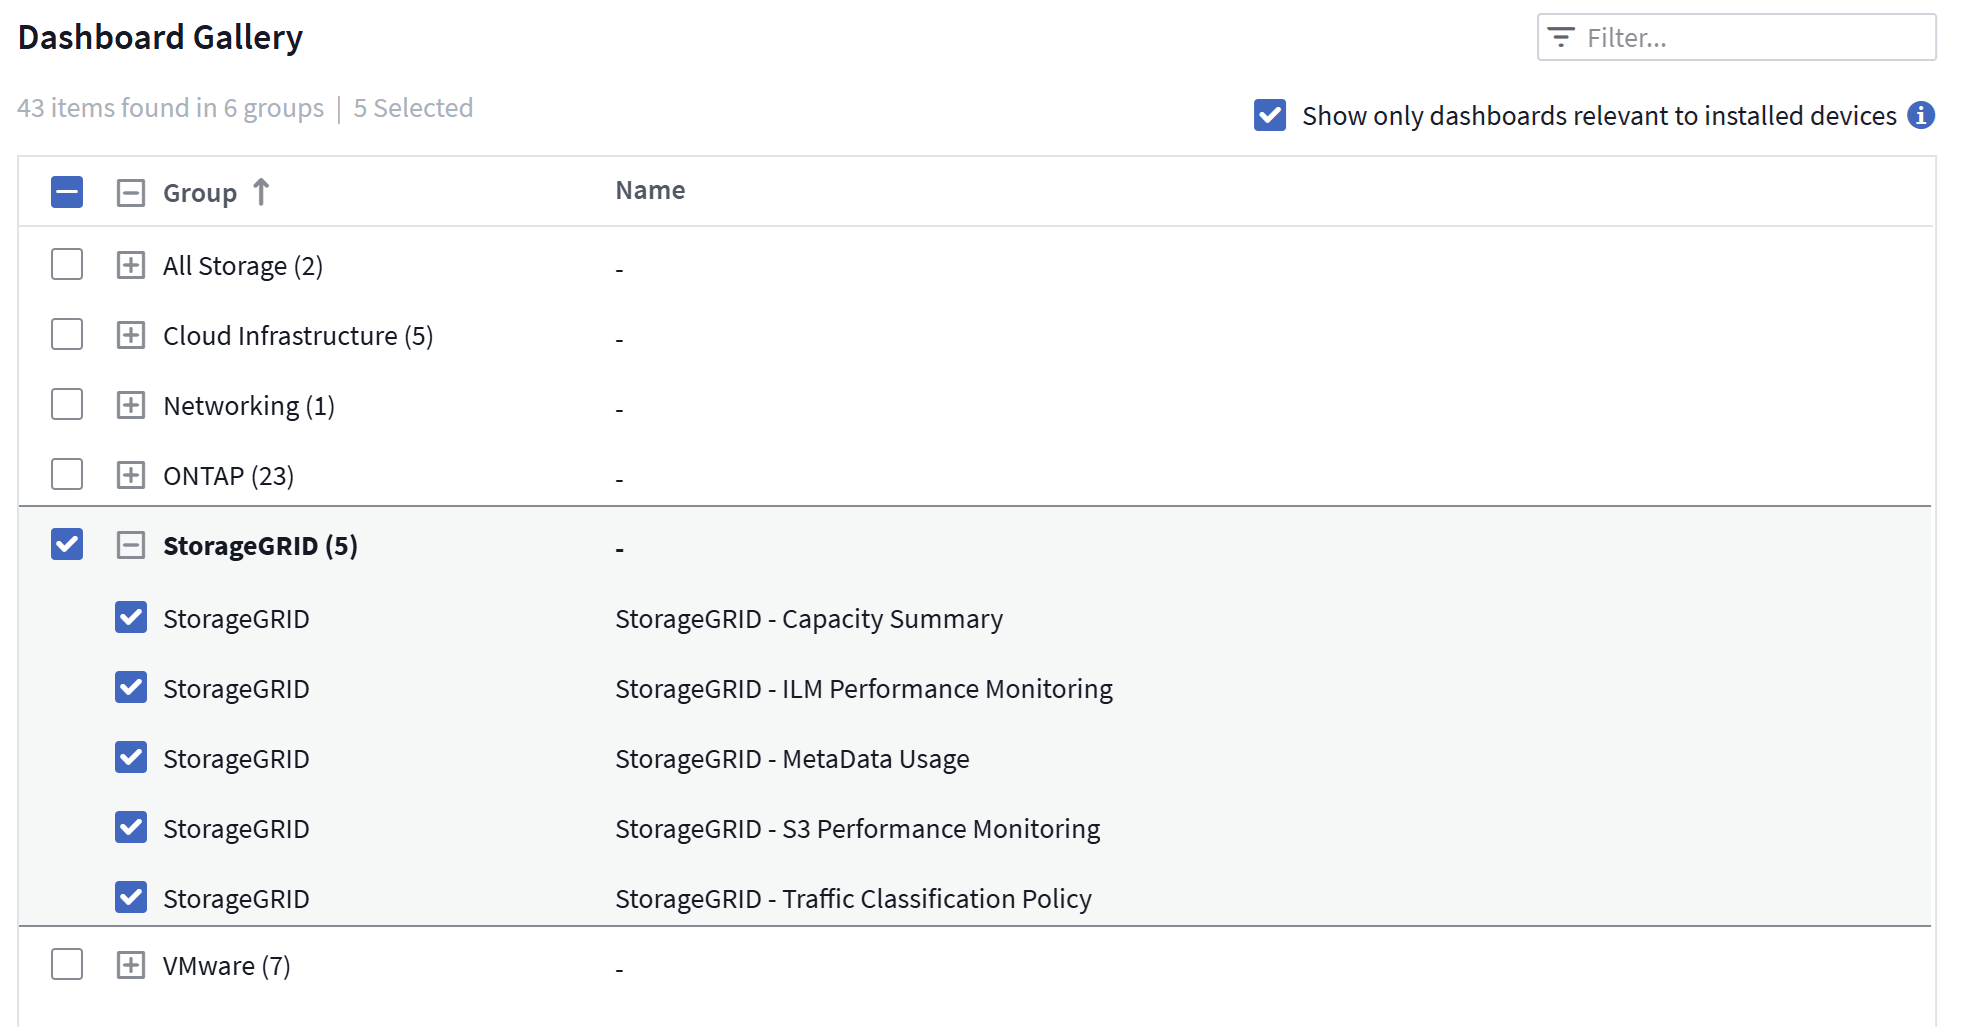
Stay Organized with Automatic Dashboard Grouping
Transform your dashboard experience with intelligent grouping that automatically organizes imported Gallery dashboards into logical categories. The new grouping feature makes importing dashboards a snap and places each dashboard in the appropriate group based on its function and relevance to your environment.
October 2025
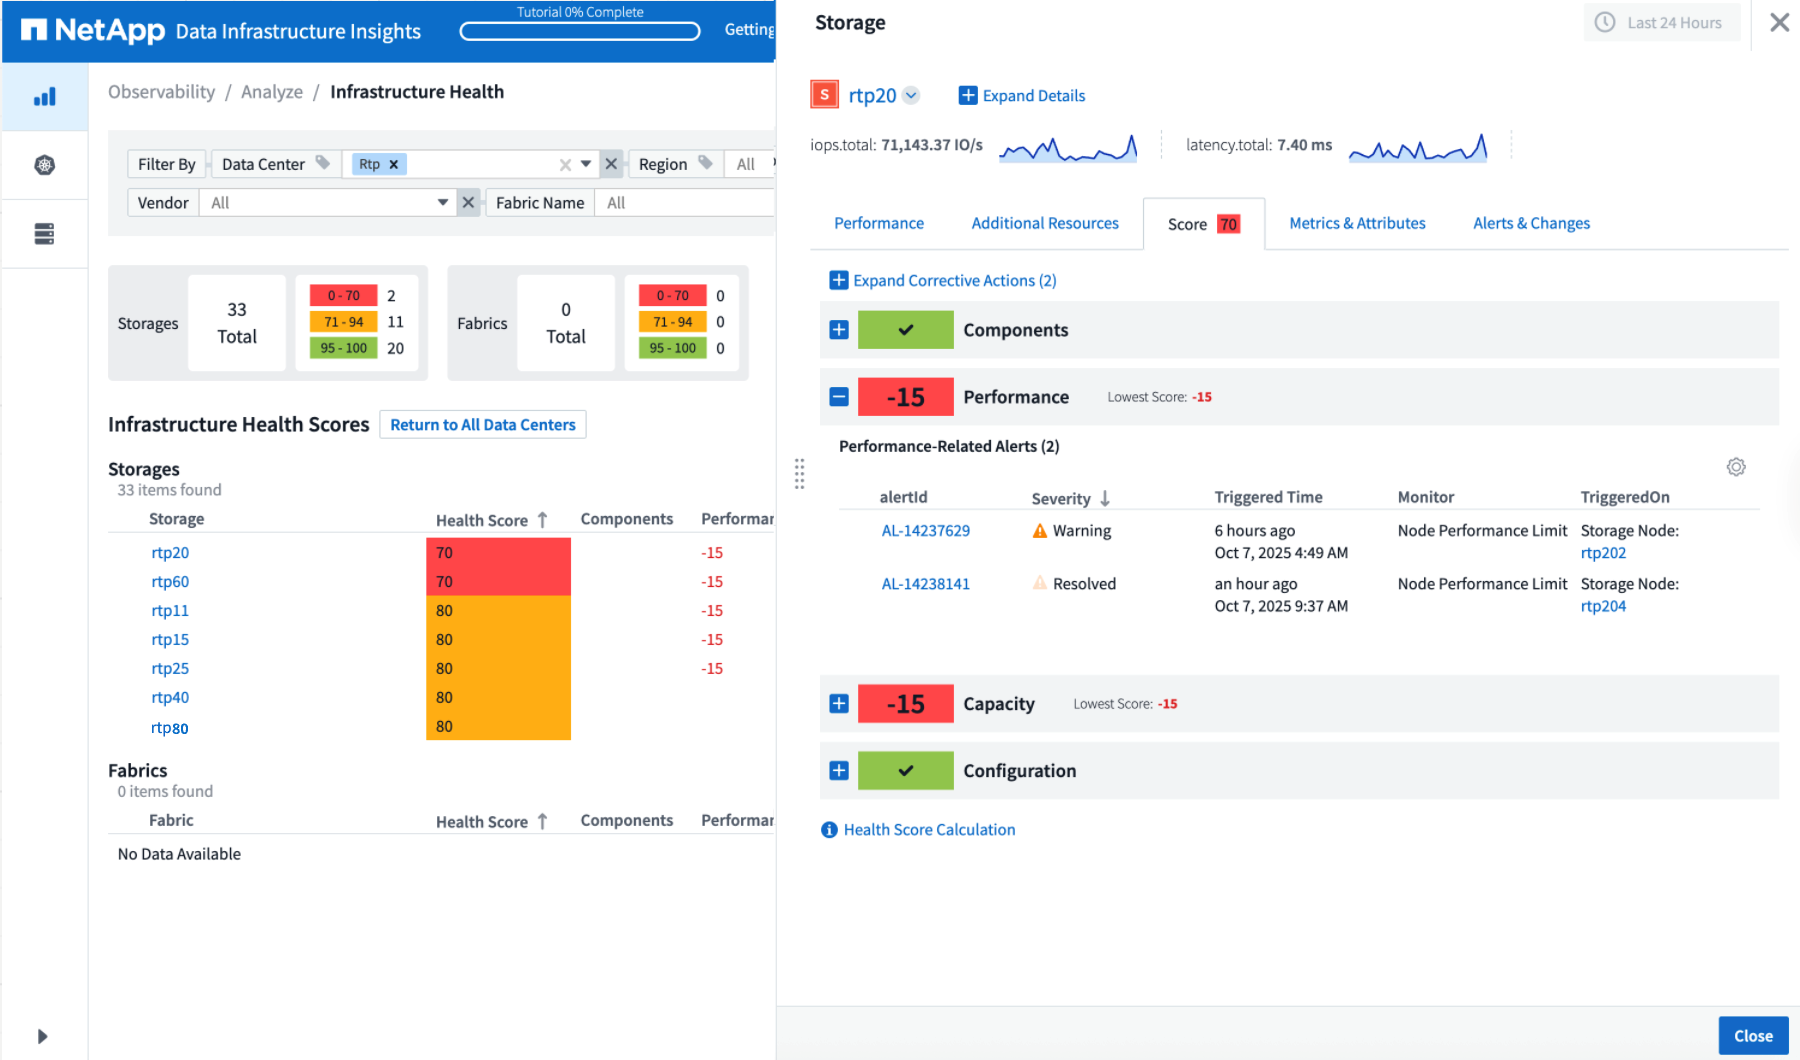
Infrastructure Health: Instant Visibility Into Storage and Fabric Risk
Gain instant visibility into potential risks across your storage and fabrics with our new Infrastructure Health feature. A single, color-coded dashboard gives you unified risk visibility, helping you minimize downtime and quickly alleviate revenue loss.
Scores below 100 indicate potential problems; the lower the score, the less healthy the resources. Grouping resources by Data Center or Region for intuitive, consolidated health scores let you easily prioritize and troubleshoot critical areas.
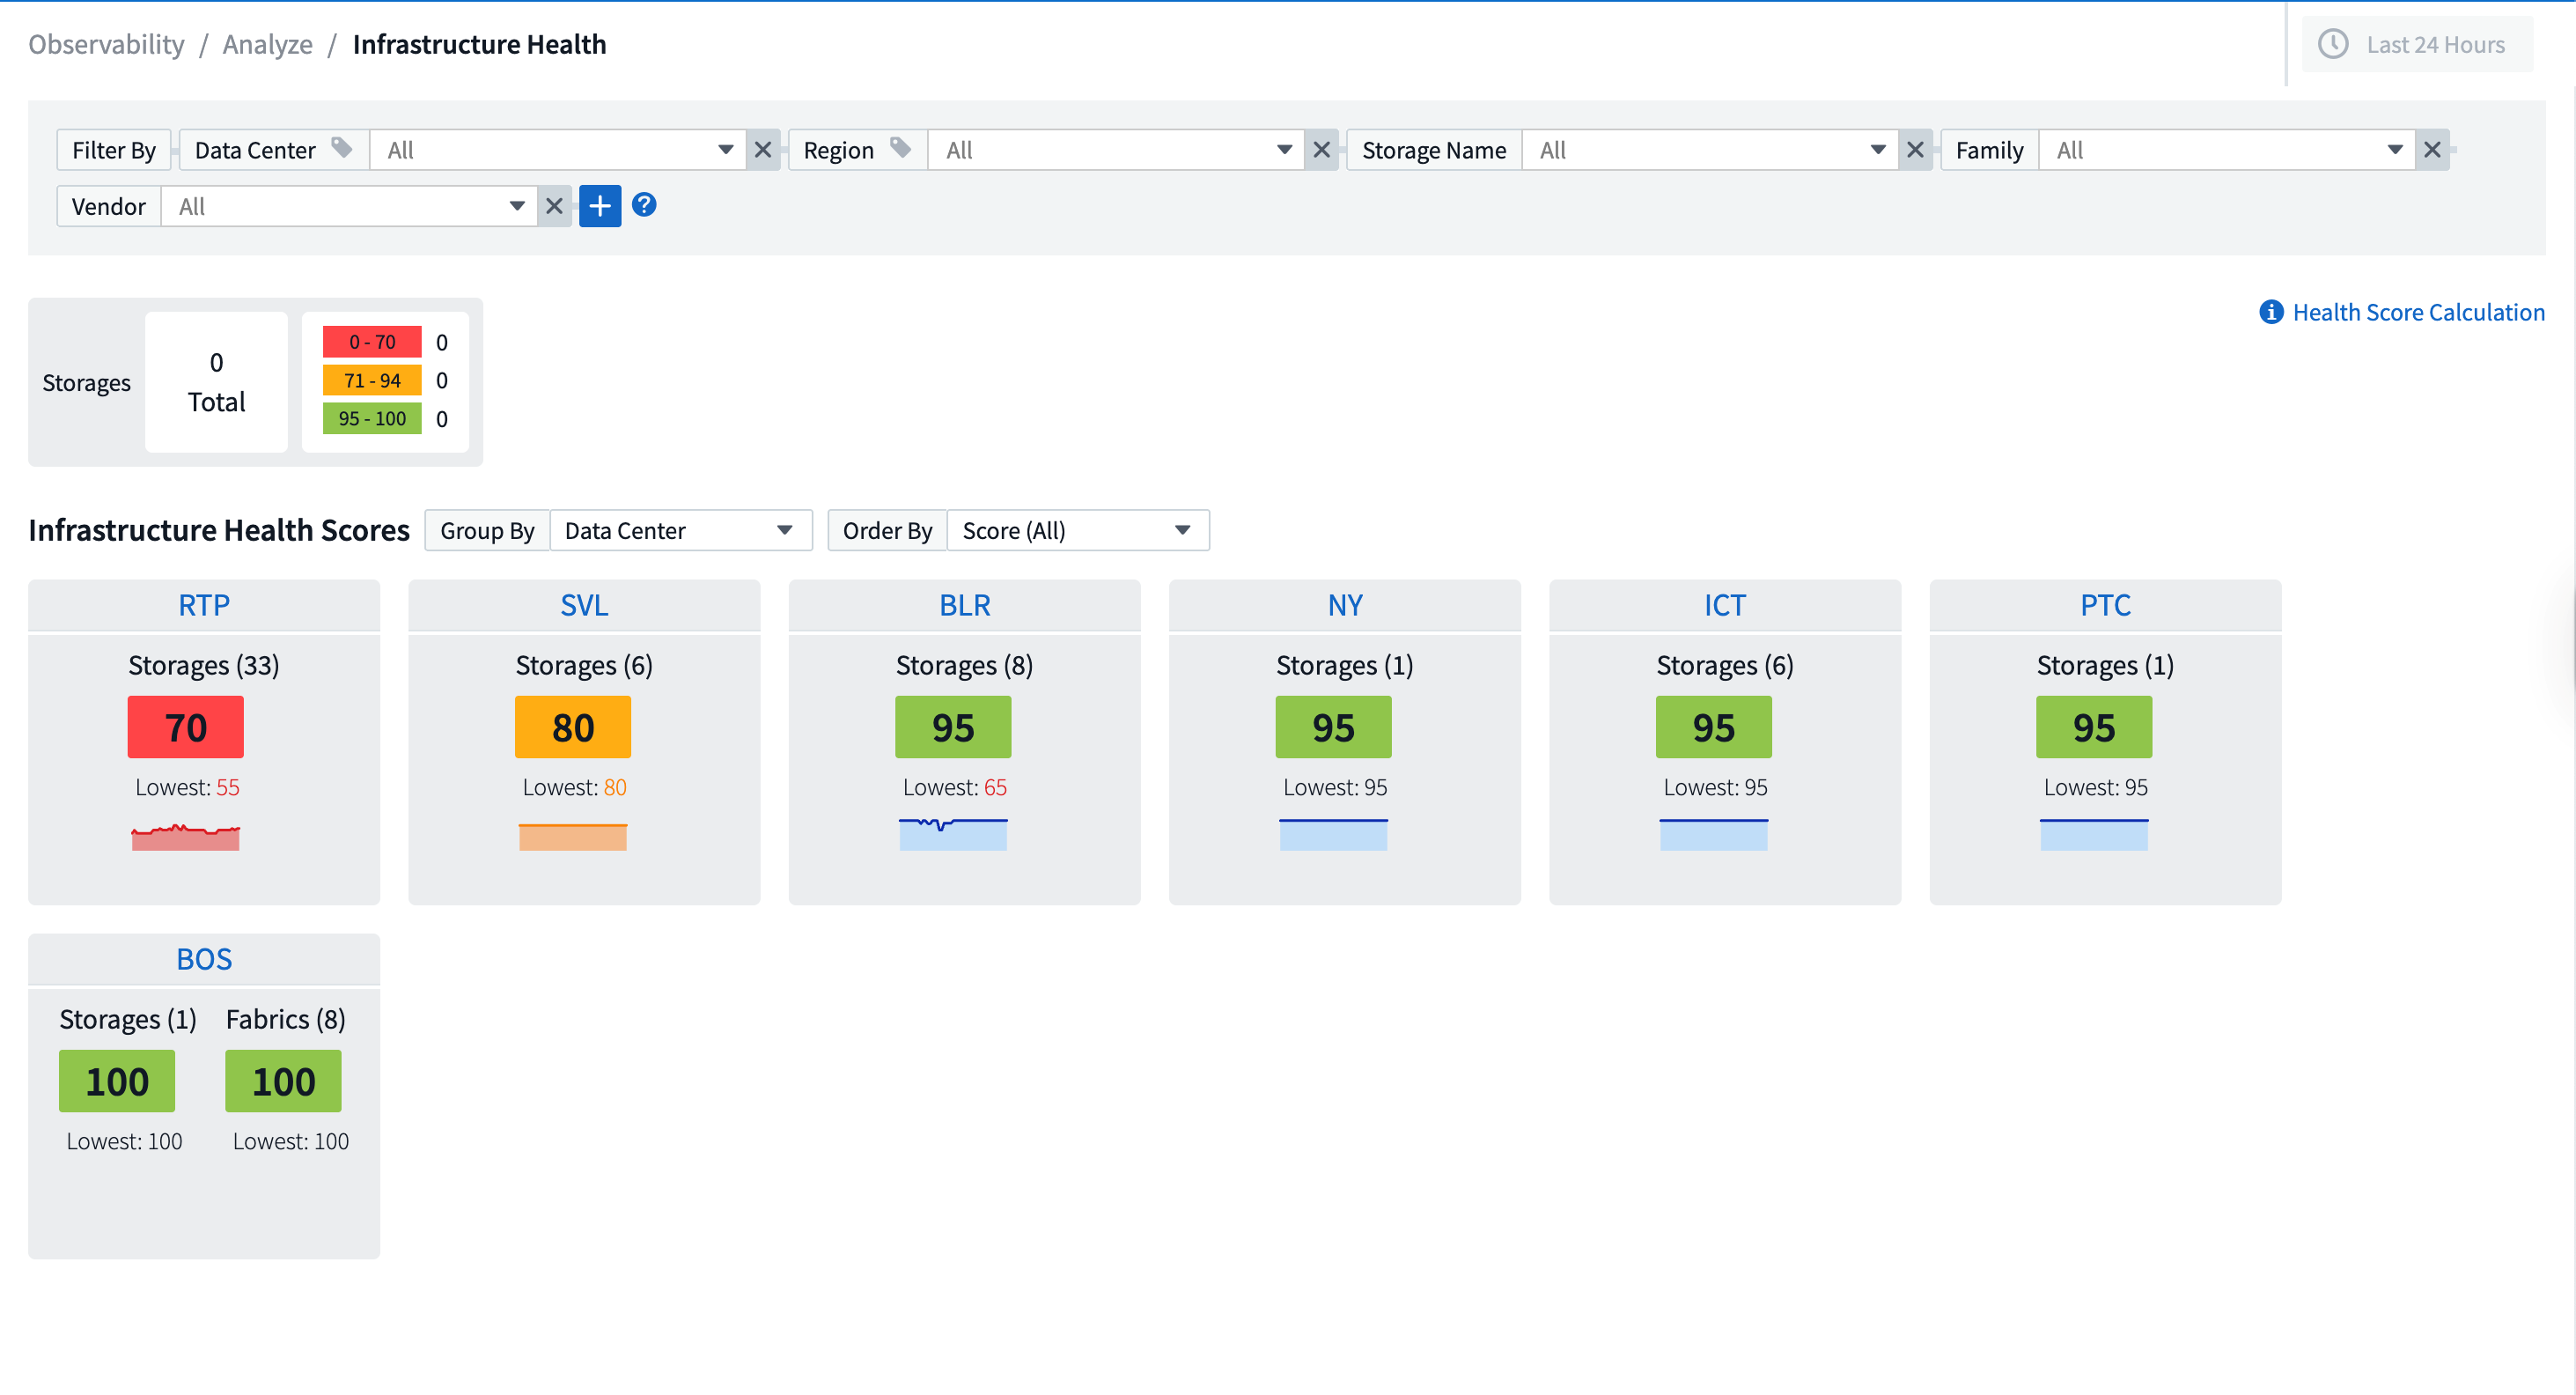
View detailed information in an on-screen slideout panel with the click of a button, quickly pinpointing issues requiring attention and keeping your systems secure and resilient.
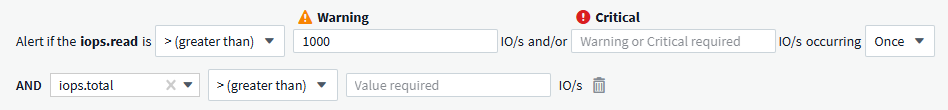
Multi-Condition Monitors for Precise Alerting
Reduce alert noise and improve monitoring precision by adding an optional second condition to any metric monitor. Alerts are triggered only when both conditions are met, giving you more targeted notifications that focus on the scenarios that matter most to you.
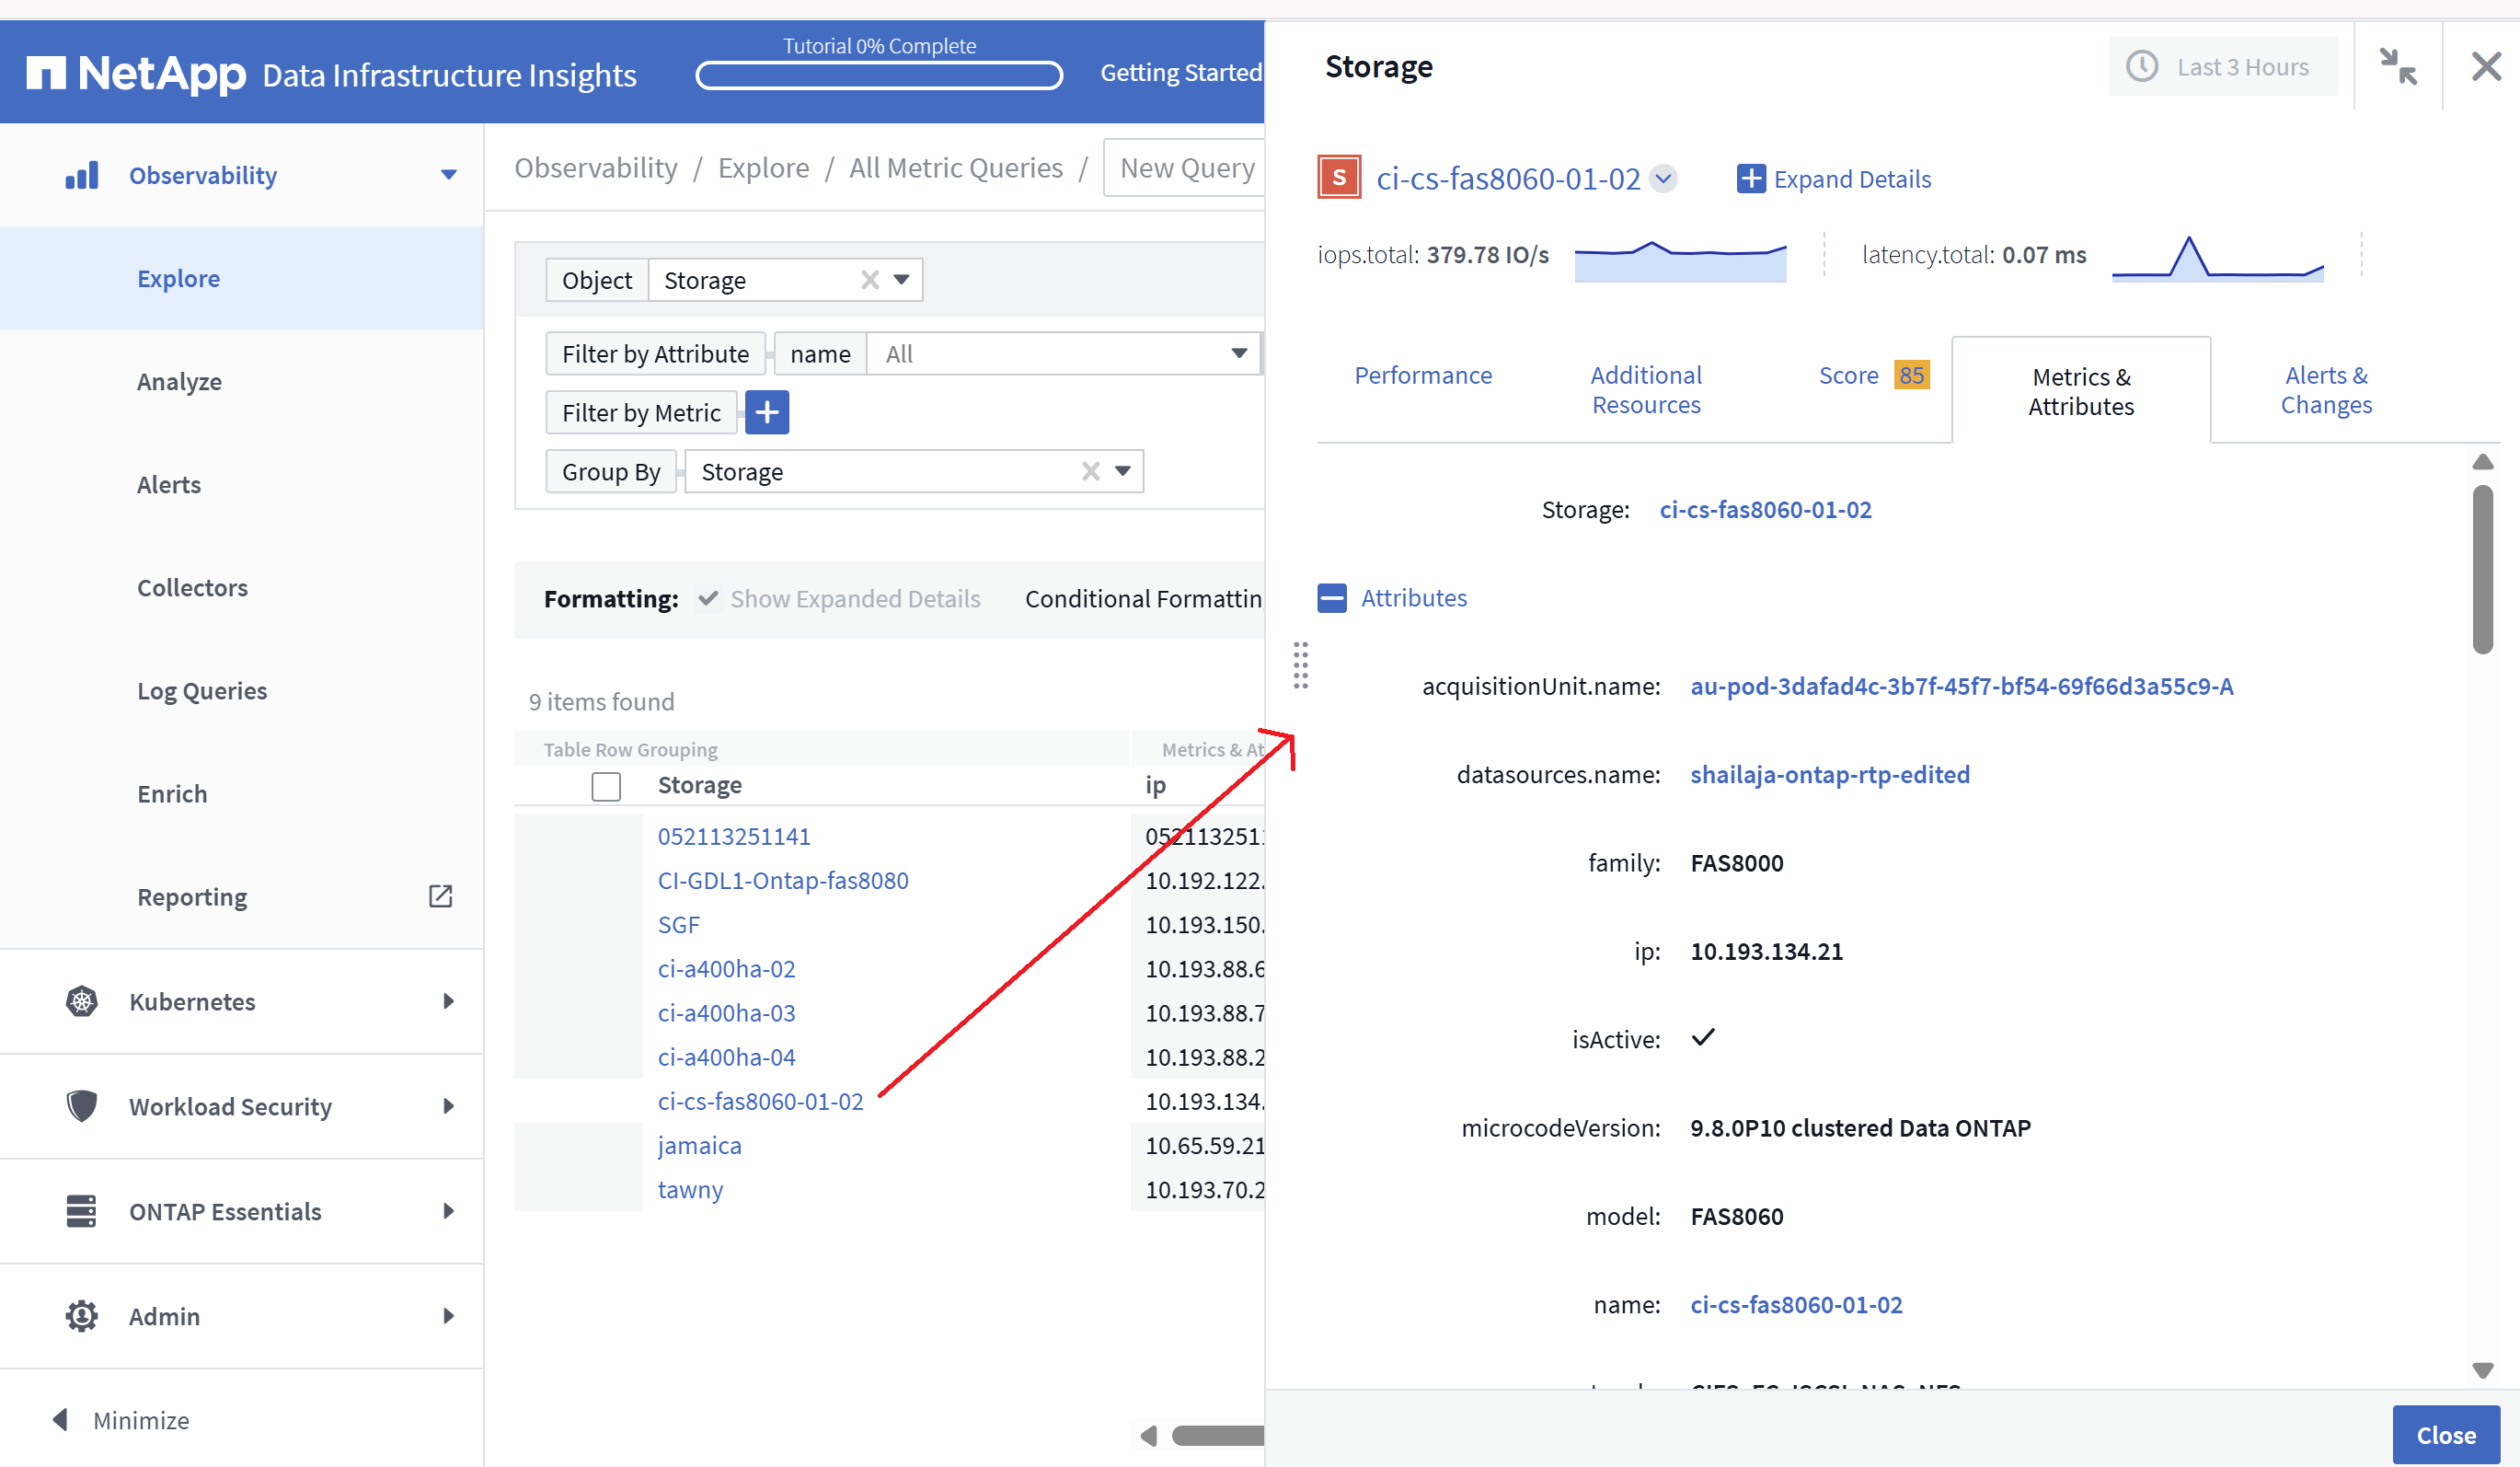
Query Improvements: At-A-Glance Object Details
Selecting a row in an object query result list opens a detail panel for the selected object. Quickly view metrics and attributes (the default view for object queries), alerts and changes, performance, and health scores, or explore related resources. All relevant object information is at your fingertips.
Workload Security Improvements
Two new APIs give you more control over your Workload Security environment:
-
View and manage Groups with GET /rest/v1/cloudsecure/activities/groups.
-
Pause and resume data collectors with POST /rest/v1/cloudsecure/collectors/{collector-uuid}/status
Additionally, Workload Security role permission checks are now even more secure. As a result of the improved security, some existing users may experience permission issues when adding a collector. Confirm user permissions by following the instructions in the documentation.
August 2025
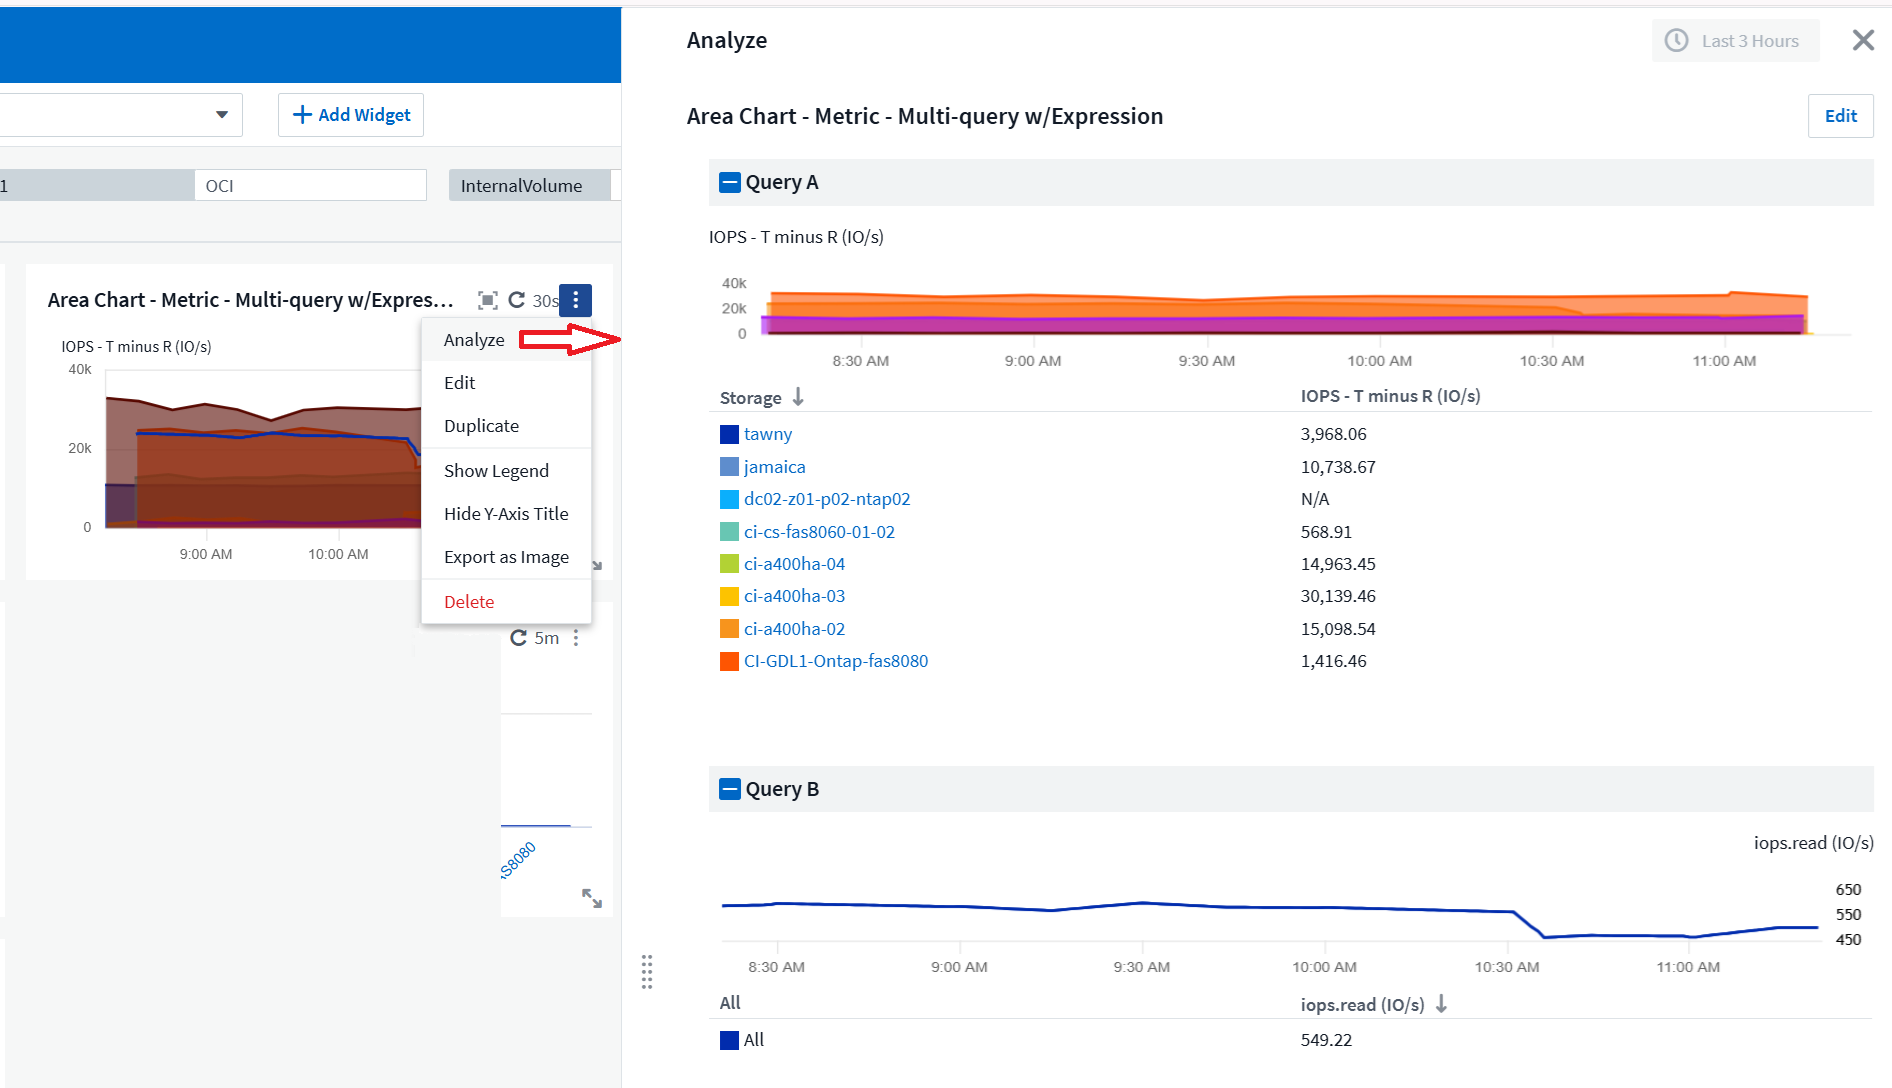
Focused Widget Data at Your Fingertips
The new Analyze feature in most widgets allows you to take a closer look at the data in one widget at a time. Simply click the "Analyze" button on a widget to open a detailed view, where you can interactively explore the underlying data and zoom in for deeper insights—without leaving your dashboard context.
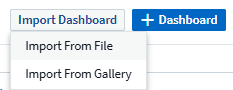
Export and Import Dashboards
If you manage multiple tenants and have developed a useful dashboard, you can export the dashboard and import it to another tenant.
Enhanced Cloud Integration: Google Cloud NetApp Volumes (GCNV) support
Google Cloud NetApp Volumes (GCNV) is now fully supported as a data collector in DII, completing our ecosystem for hybrid cloud monitoring. Gain visibility into critical storage objects like organizations, pools, and volumes across the infrastructure. Now you can track all your storage environments—on-prem or in the cloud—from a single platform.
Enhanced StorageGRID Monitoring
StorageGRID Log collection is now enabled by default, providing event tracking data to DII, and we've expanded StorageGrid monitoring with over 50 default alerts, real-time event tracking, and new dashboards to simplify complex storage grid operations. Stay ahead of issues with deeper insights into traffic policies and bucket performance.
Operating System support
The following operating systems are now supported with Data Infrastructure Insights Acquisition Units, in addition to those already supported:
-
AlmaLinux (64-bit) 10
-
Red Hat (64-bit) 10
-
Rocky (64-bit) 9.6
June 2025
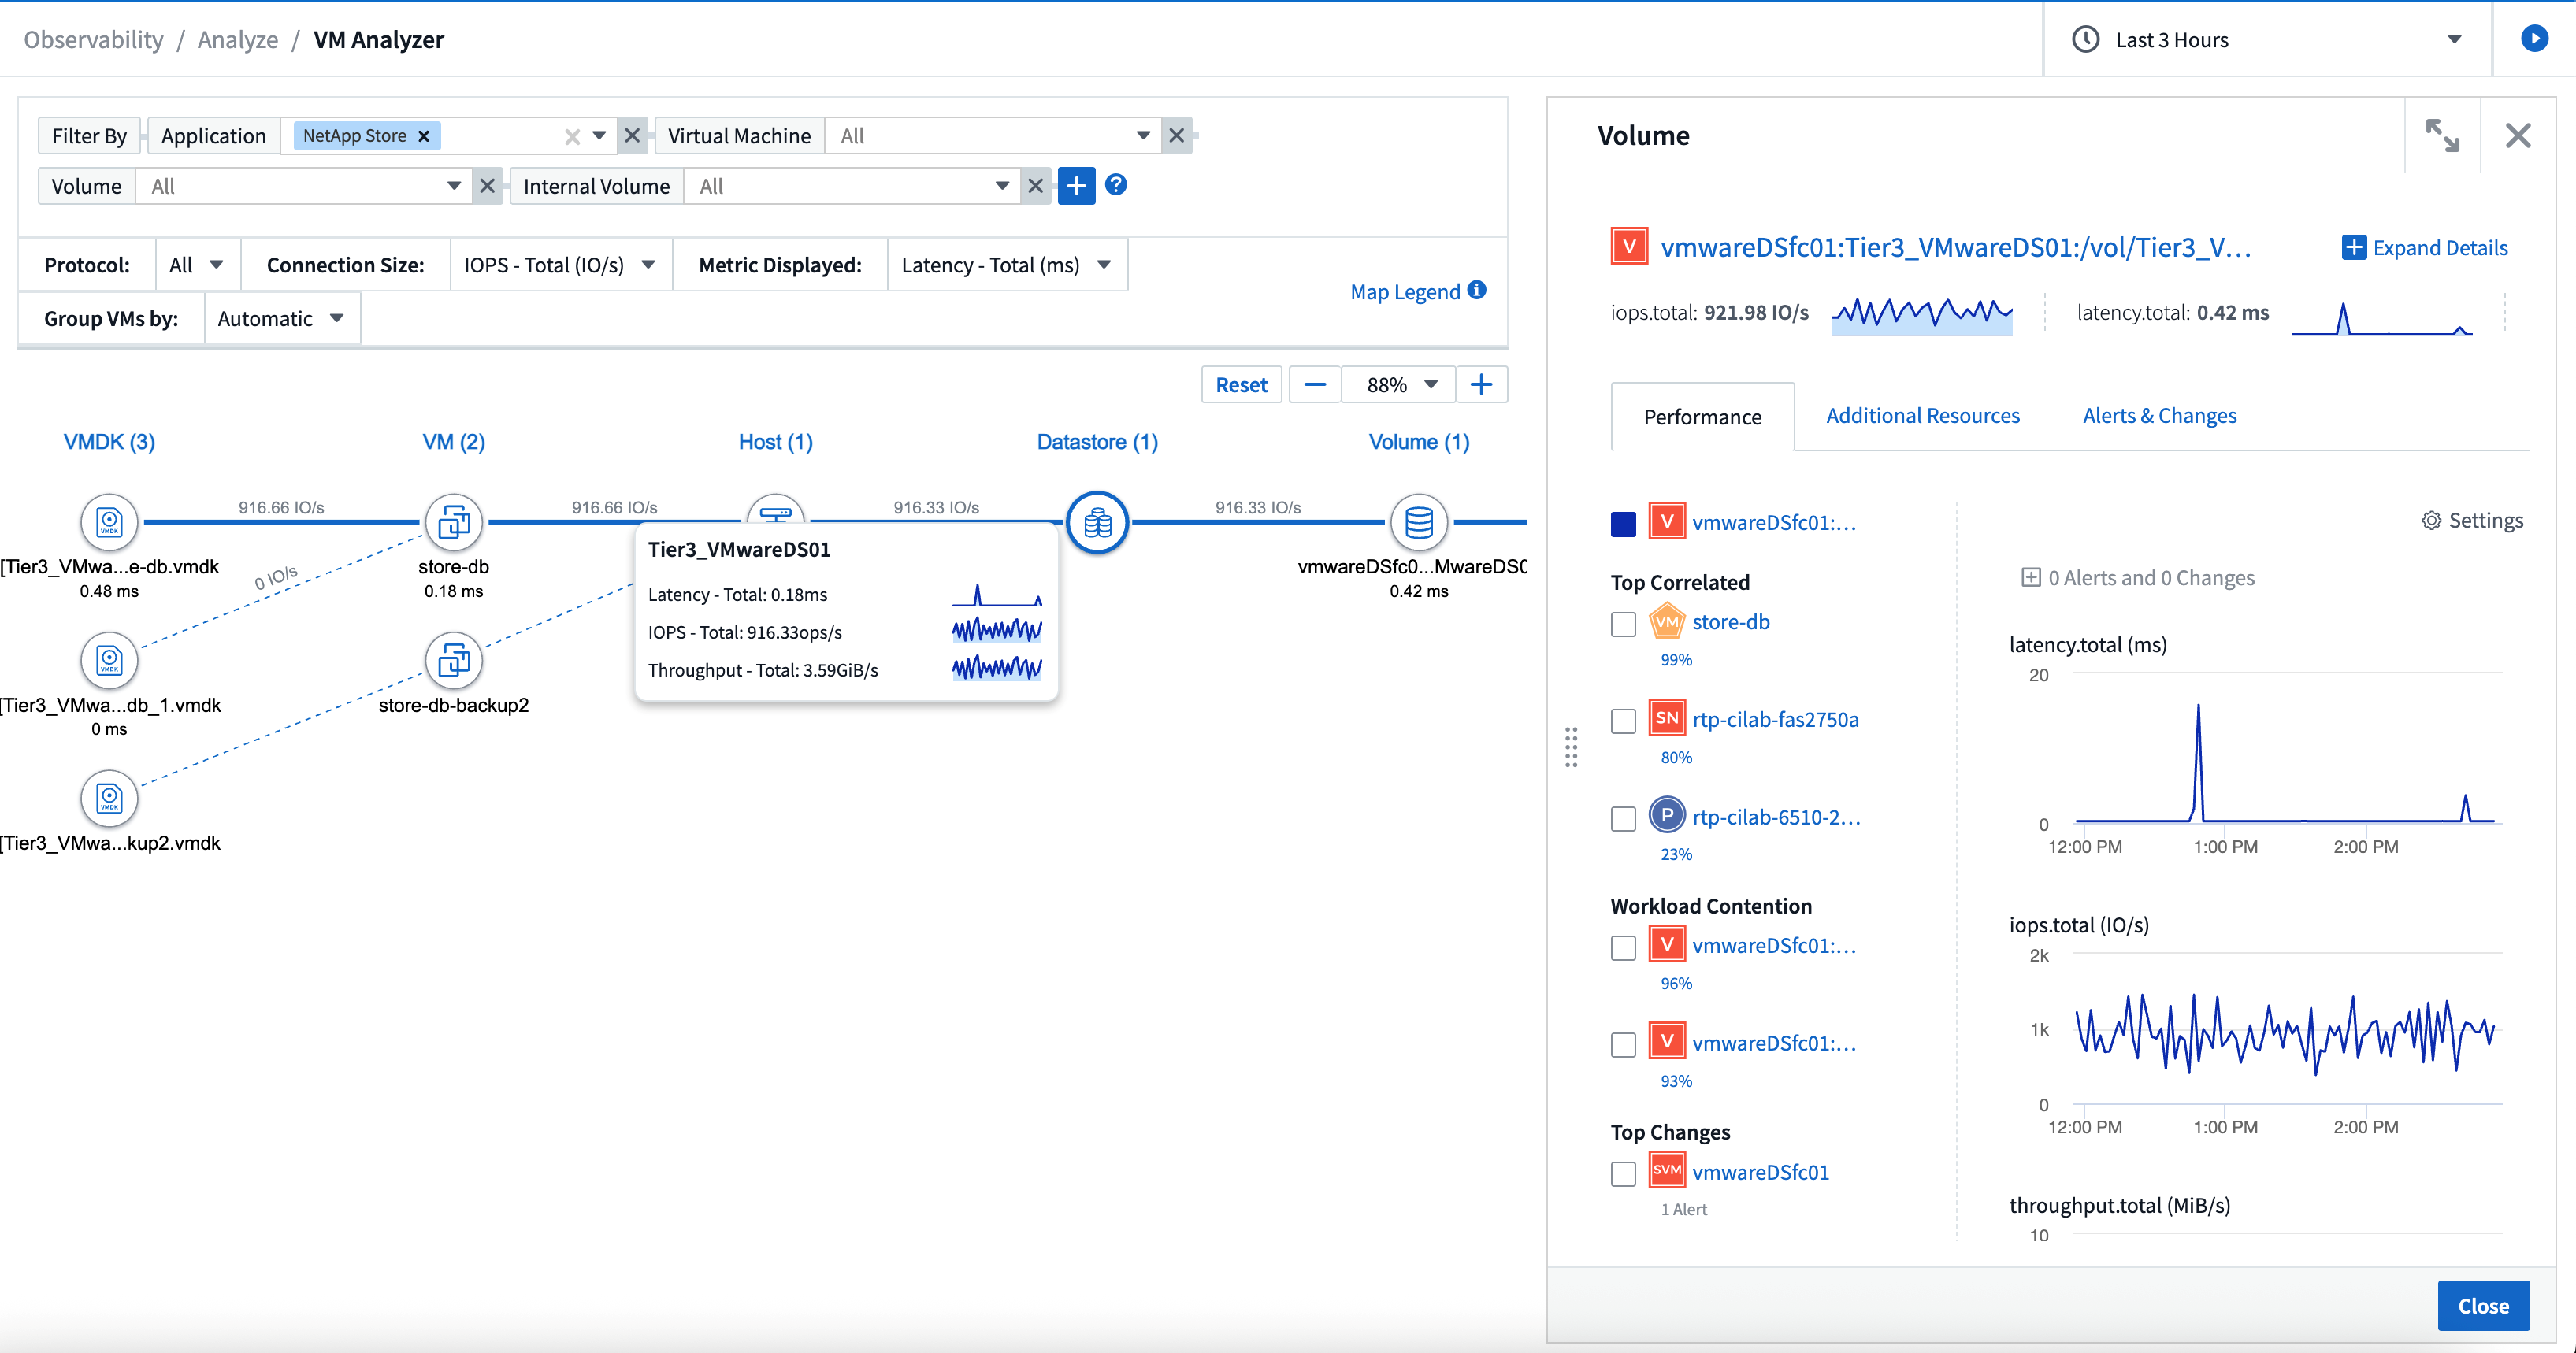
VM Analyzer: Holistic VM-to-Storage Visibility & Troubleshooting
DII's VM Analyzer feature provides a comprehensive, end-to-end view of your virtualized environments. The VM Analyzer streamlines troubleshooting by mapping the entire path from virtual machines to storage, allowing users to quickly pinpoint performance issues across virtual disks, VMs, hosts, datastores, volumes, and storage. With an intuitive topology view, filtering, and detailed performance metrics, administrators can easily identify bottlenecks, analyze traffic imbalances, and optimize overall storage performance.
Operating System support
The following operating systems are now supported with Data Infrastructure Insights Acquisition Units, in addition to those already supported:
-
Debian (64-bit) 12
-
Oracle Enterprise Linux (64-bit) 9.6
-
Red Hat (64-bit) 9.6
May 2025
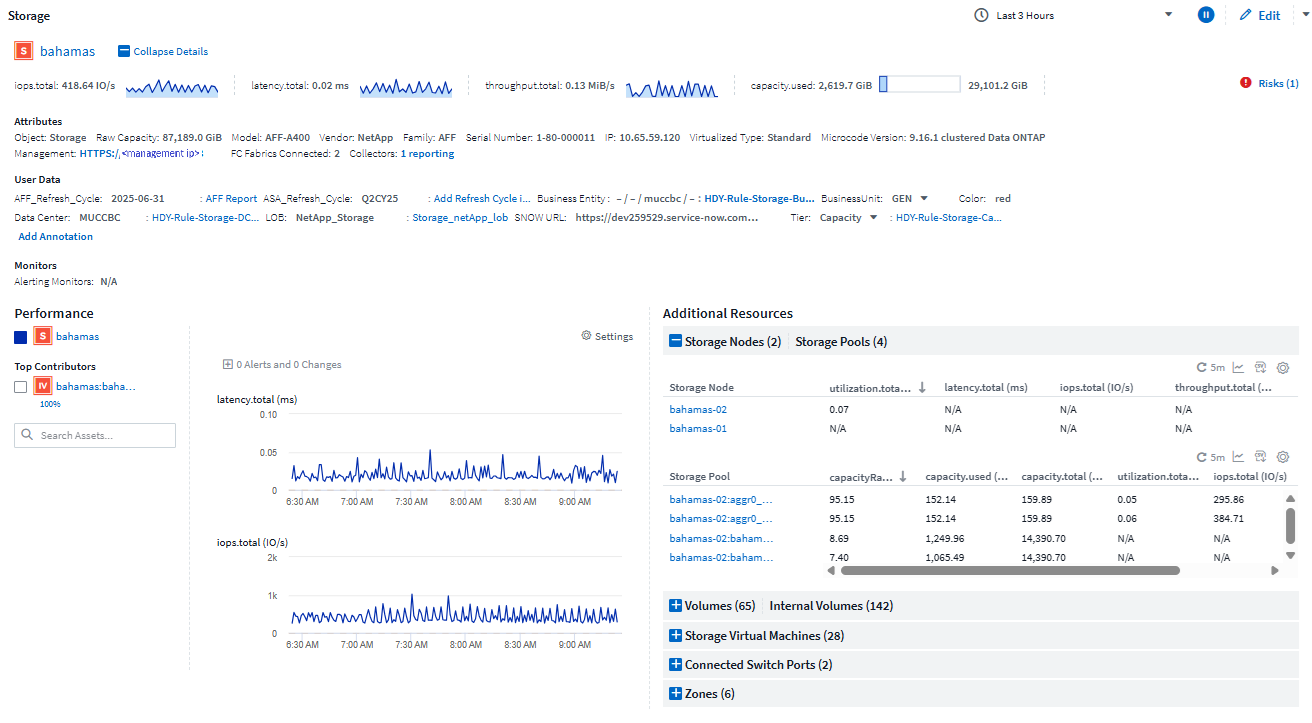
New Landing Pages keep you in the flow
The redesigned Landing Pages surface everything you need—summary data, performance charts, correlations, alerts and changes, and key resources—in one view.
Now you can troubleshoot faster and stay in flow, without jumping between tabs or losing context.
Workload Security Improvements
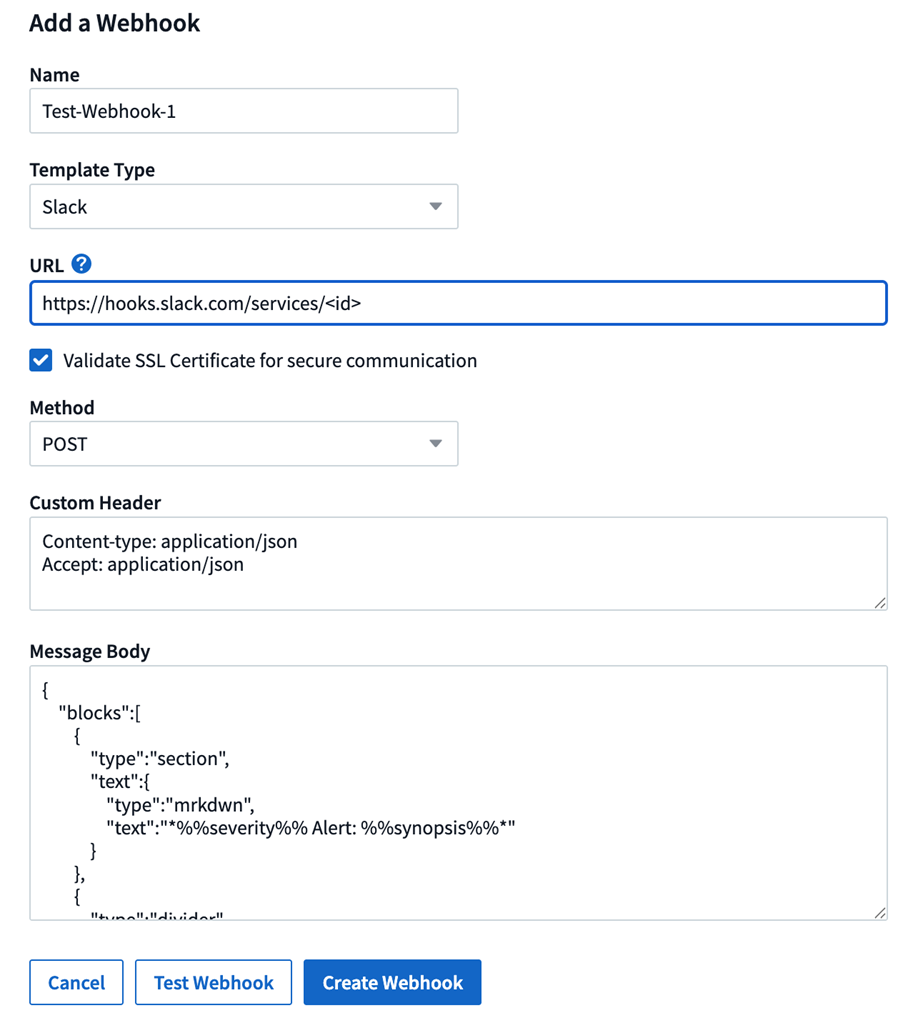
Webhooks now available for Workload Security alerts
Workload Security now supports out-of-the-box webhook notifications to tools like Slack, PagerDuty, Teams, and more. Additionally, we offer customizable templates that allow you to tailor the message or integrate with any other SIEM or third-party application. Route critical alerts directly into your existing security workflows, so your team can investigate and respond faster.
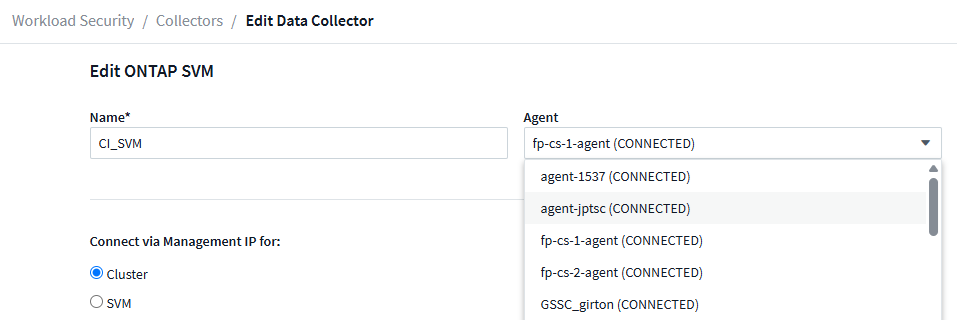
Migrate Workload Security collectors across agents
You can easily migrate a Workload Security collector from one agent to another, allowing for efficient load balancing of collectors across agents.
Migrating is as easy as editing the collector and selecting the destination agent from the list.
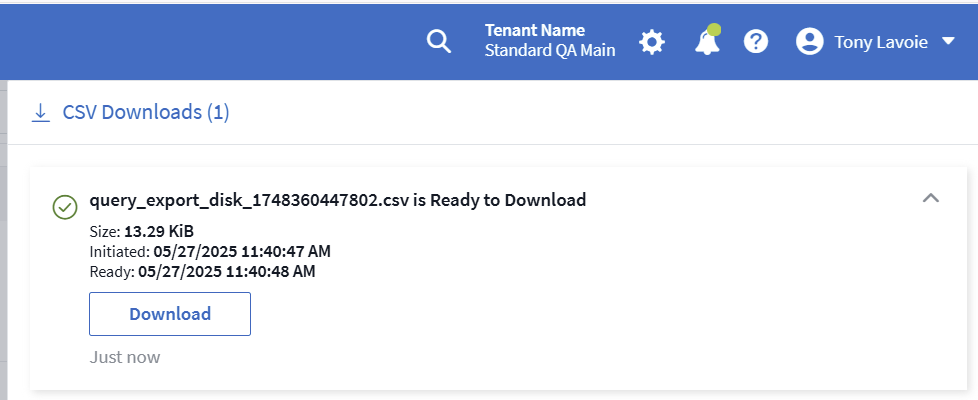
.CSV Asynchronous Export
Exporting data to .CSV can take anywhere from a few seconds to a number of hours, depending on the amount of data to export. Data Infrastructure Insights now exports that data asynchronously, so you can continue working while the .CSV is being compiled.
View your .CSV exports by selecting the "Bell" icon in the upper-right toolbar.
April 2025
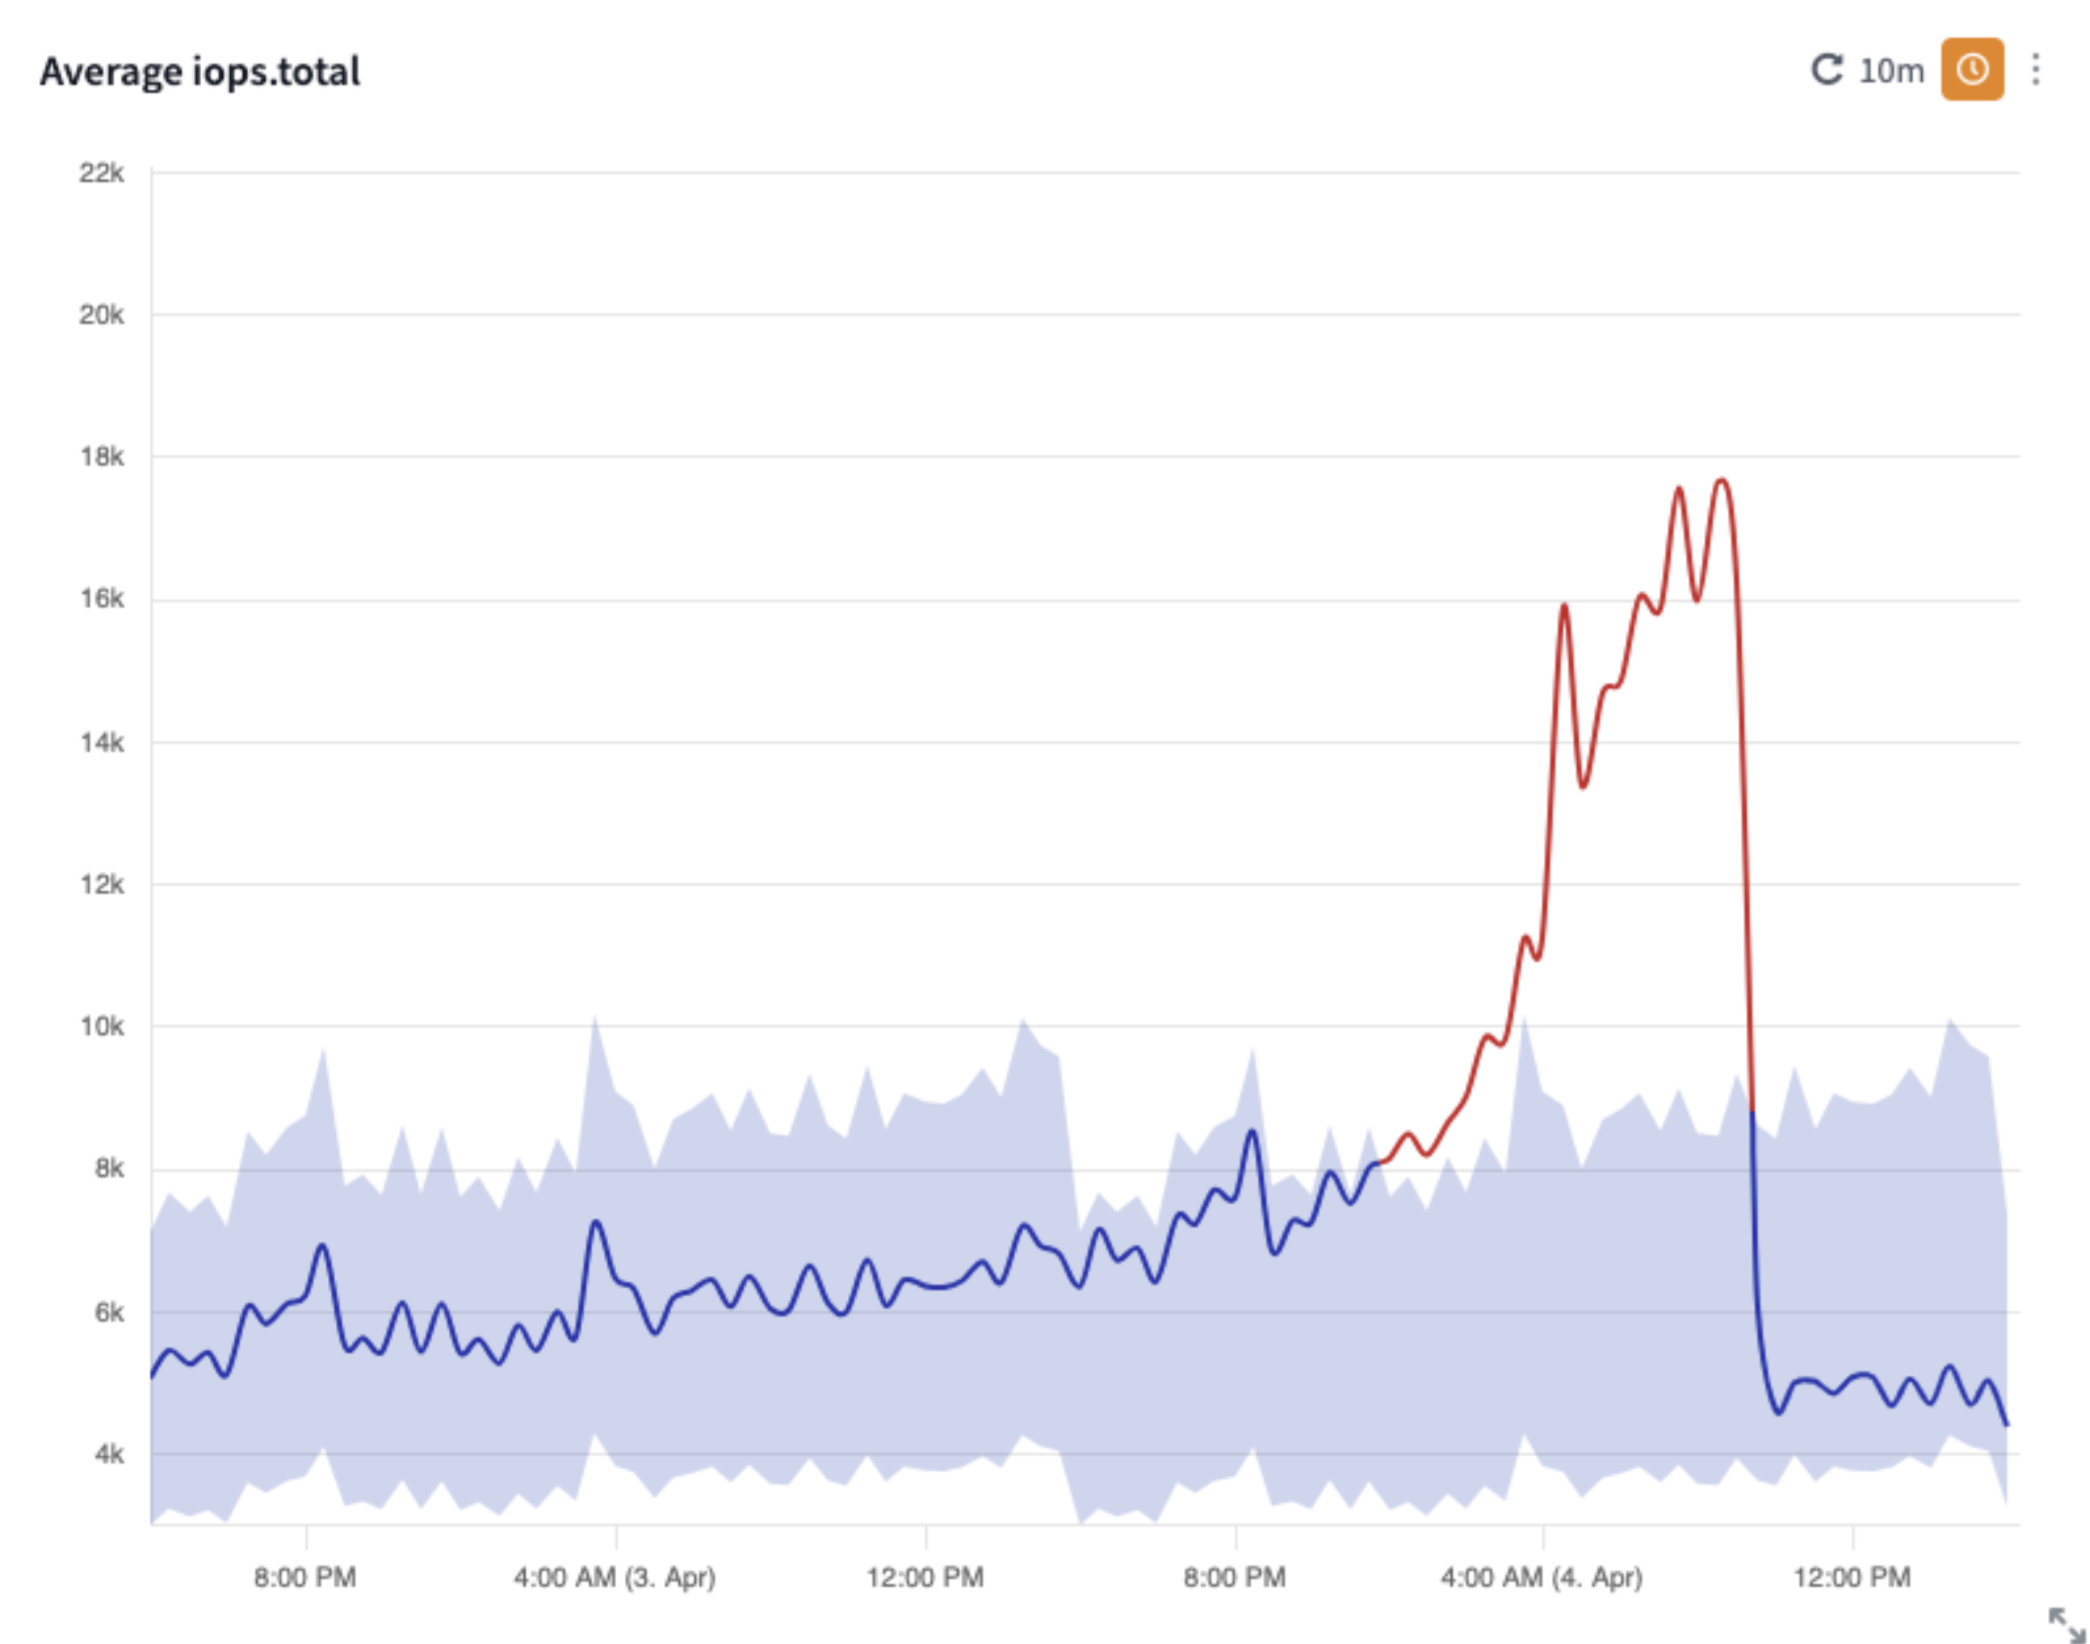
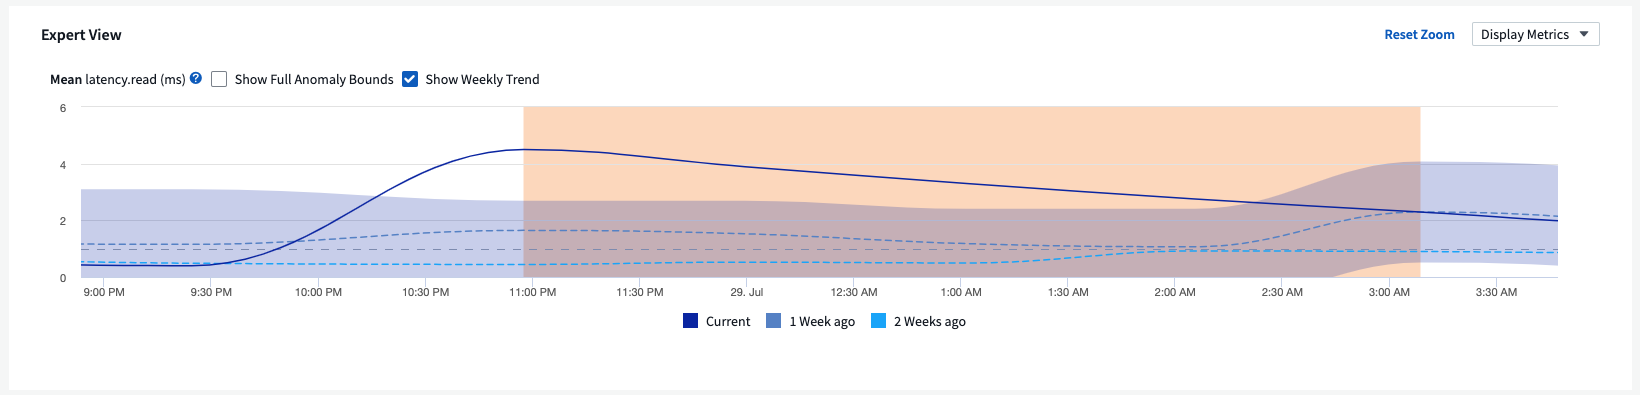
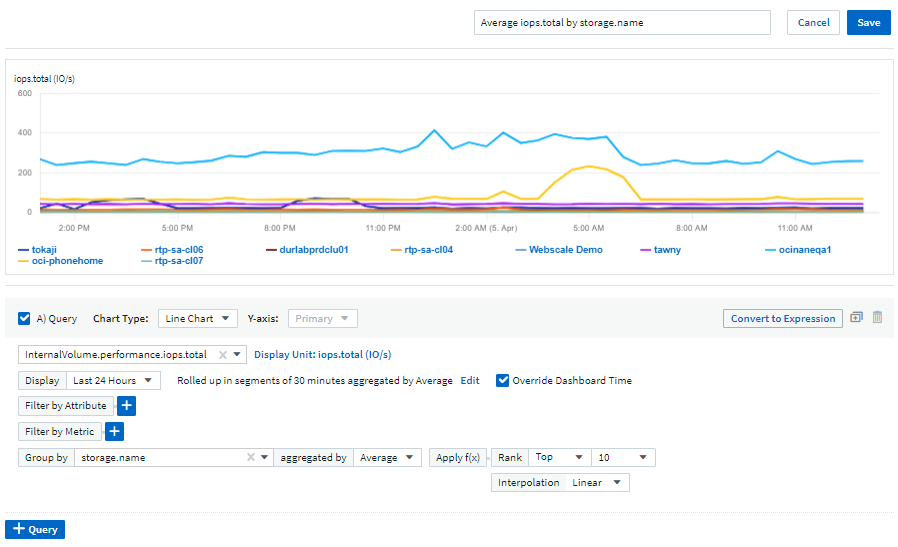
ML-Powered Anomaly Bounds in Line Widgets for Proactive Issue Resolution
To troubleshoot performance issues with Line or Spline chart widgets, you can now display expected behavior boundaries alongside actual metrics, allowing you to distinguish between normal and abnormal metric trends.
DII machine learning with seasonal data analysis establishes intelligent thresholds based on historical patterns. When metrics deviate from expected ranges, the system highlights these as anomalies, enabling quick issue identification, reducing mean time to resolution, and addressing problems before they impact operations.
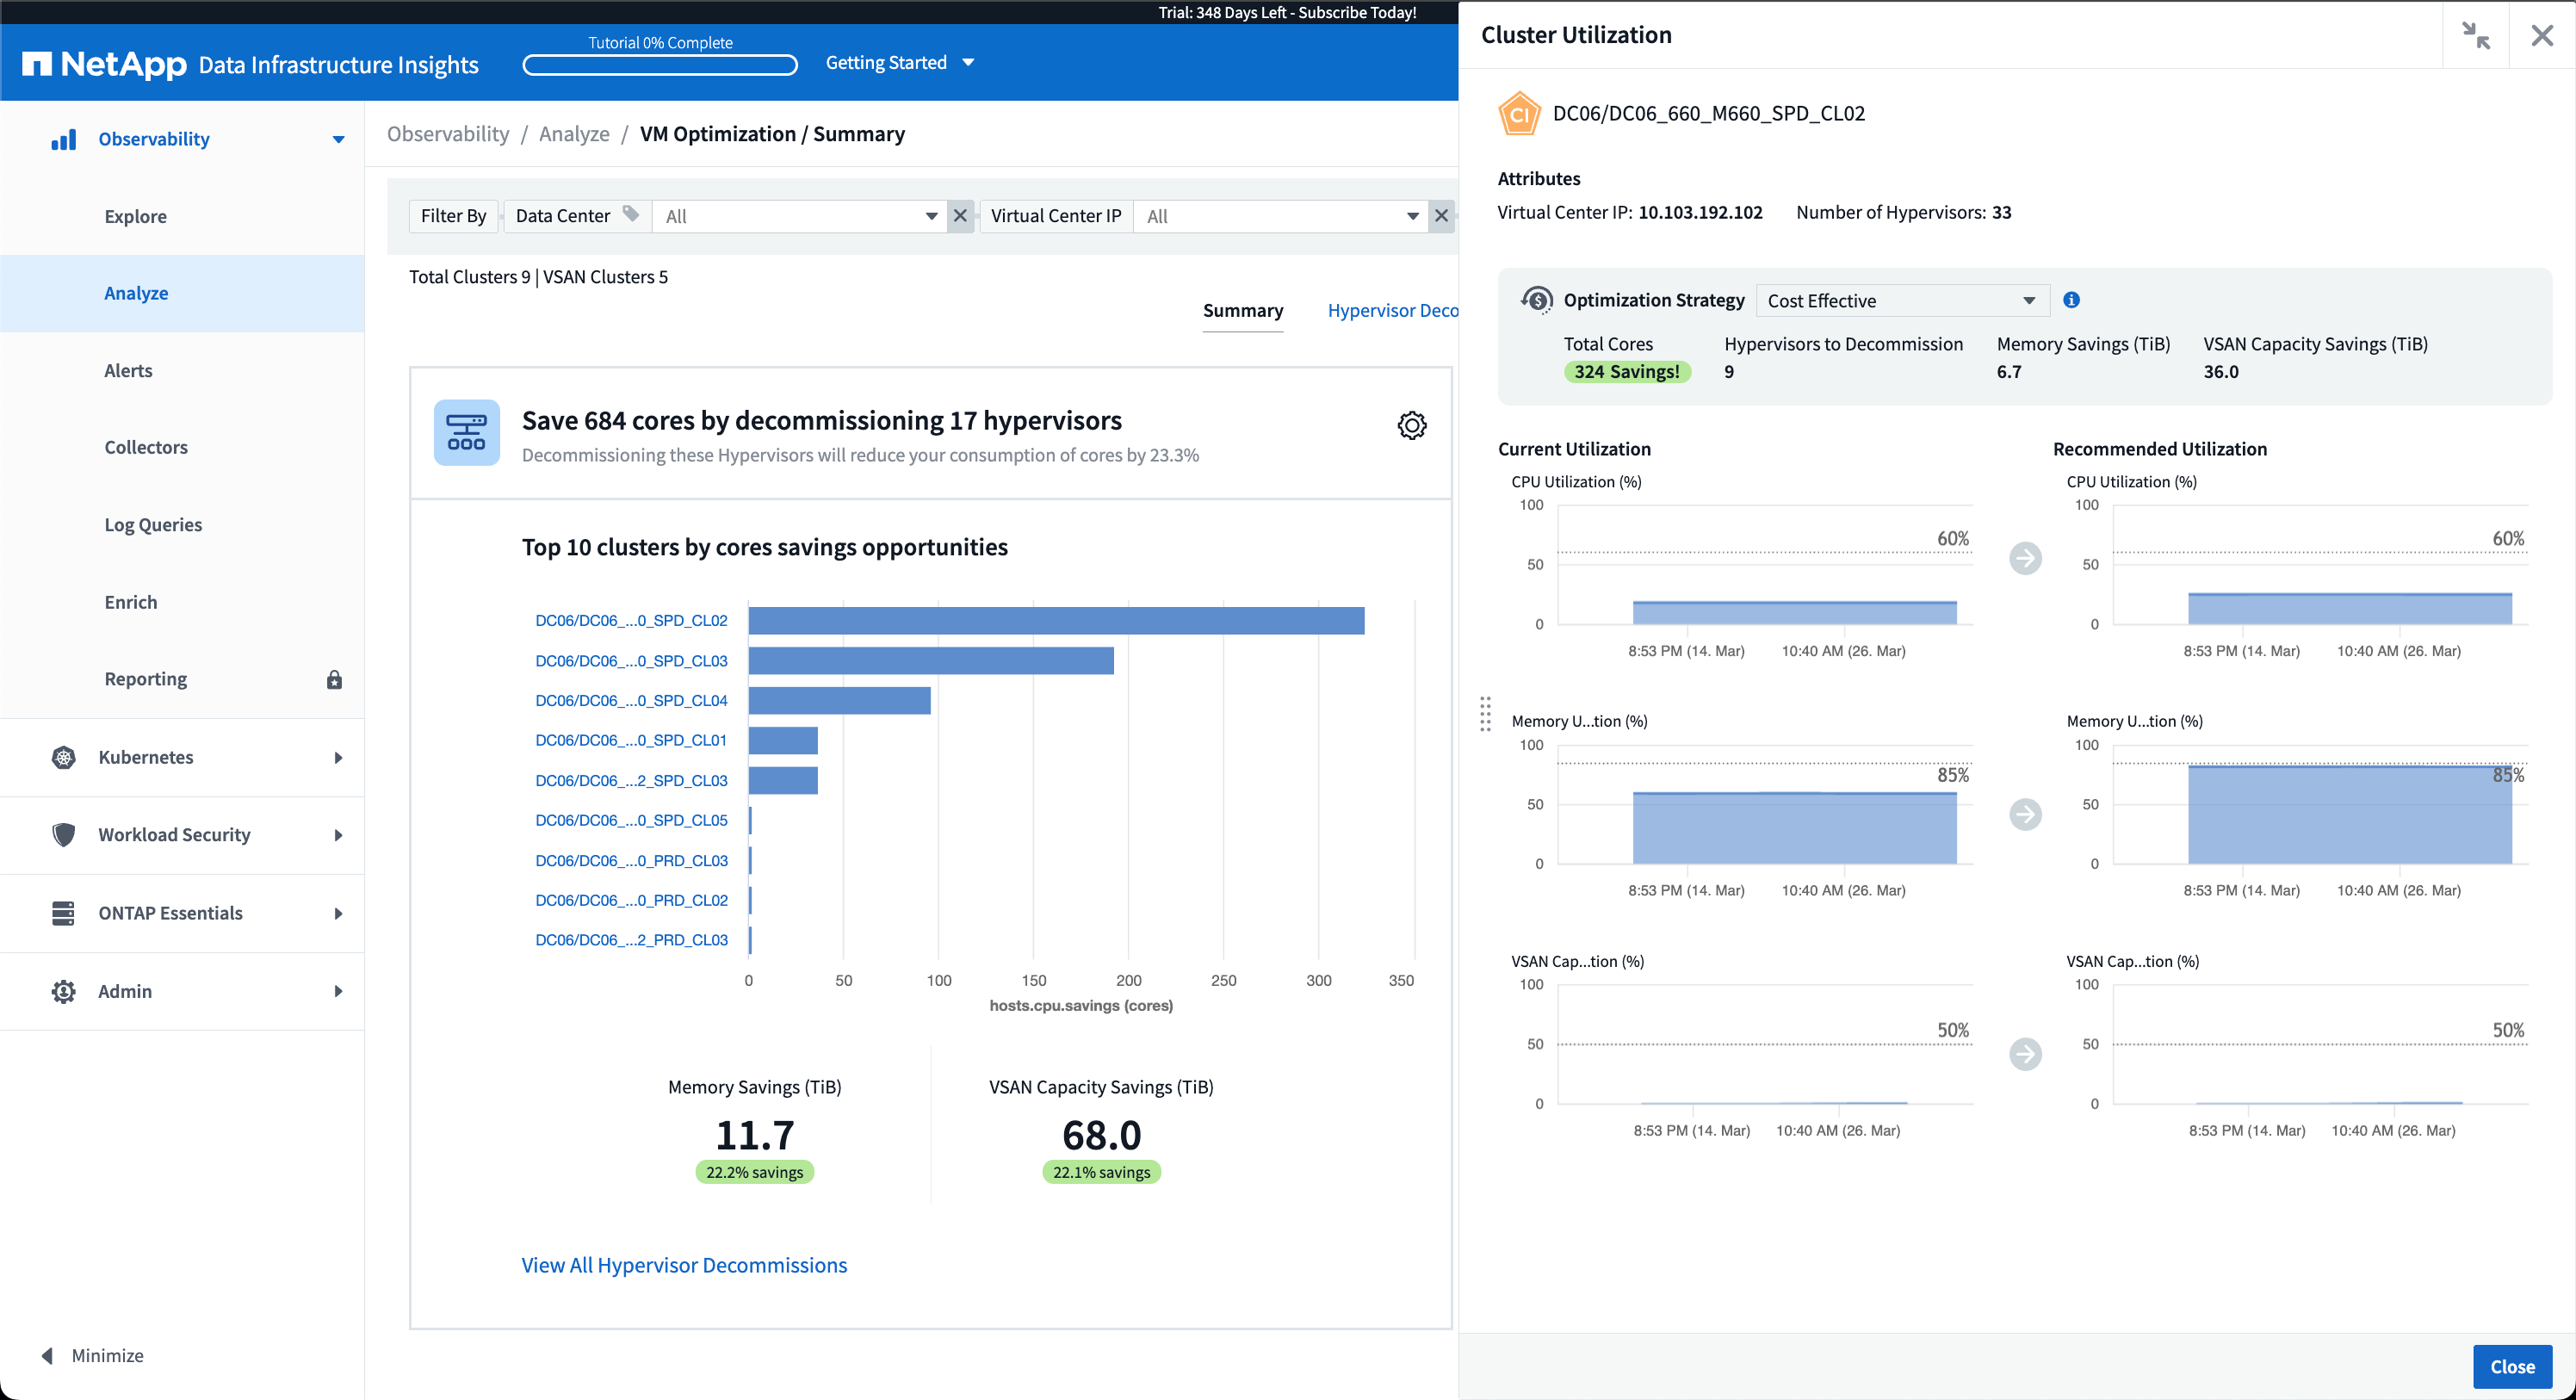
Optimize VMware Costs with VSAN Storage Support
Our VM Optimization feature now includes support for VMWare environments with VSAN storage. In addition to CPU and memory usage, the analysis now considers local VSAN storage for reclamation recommendations, helping you further reduce licensing costs.
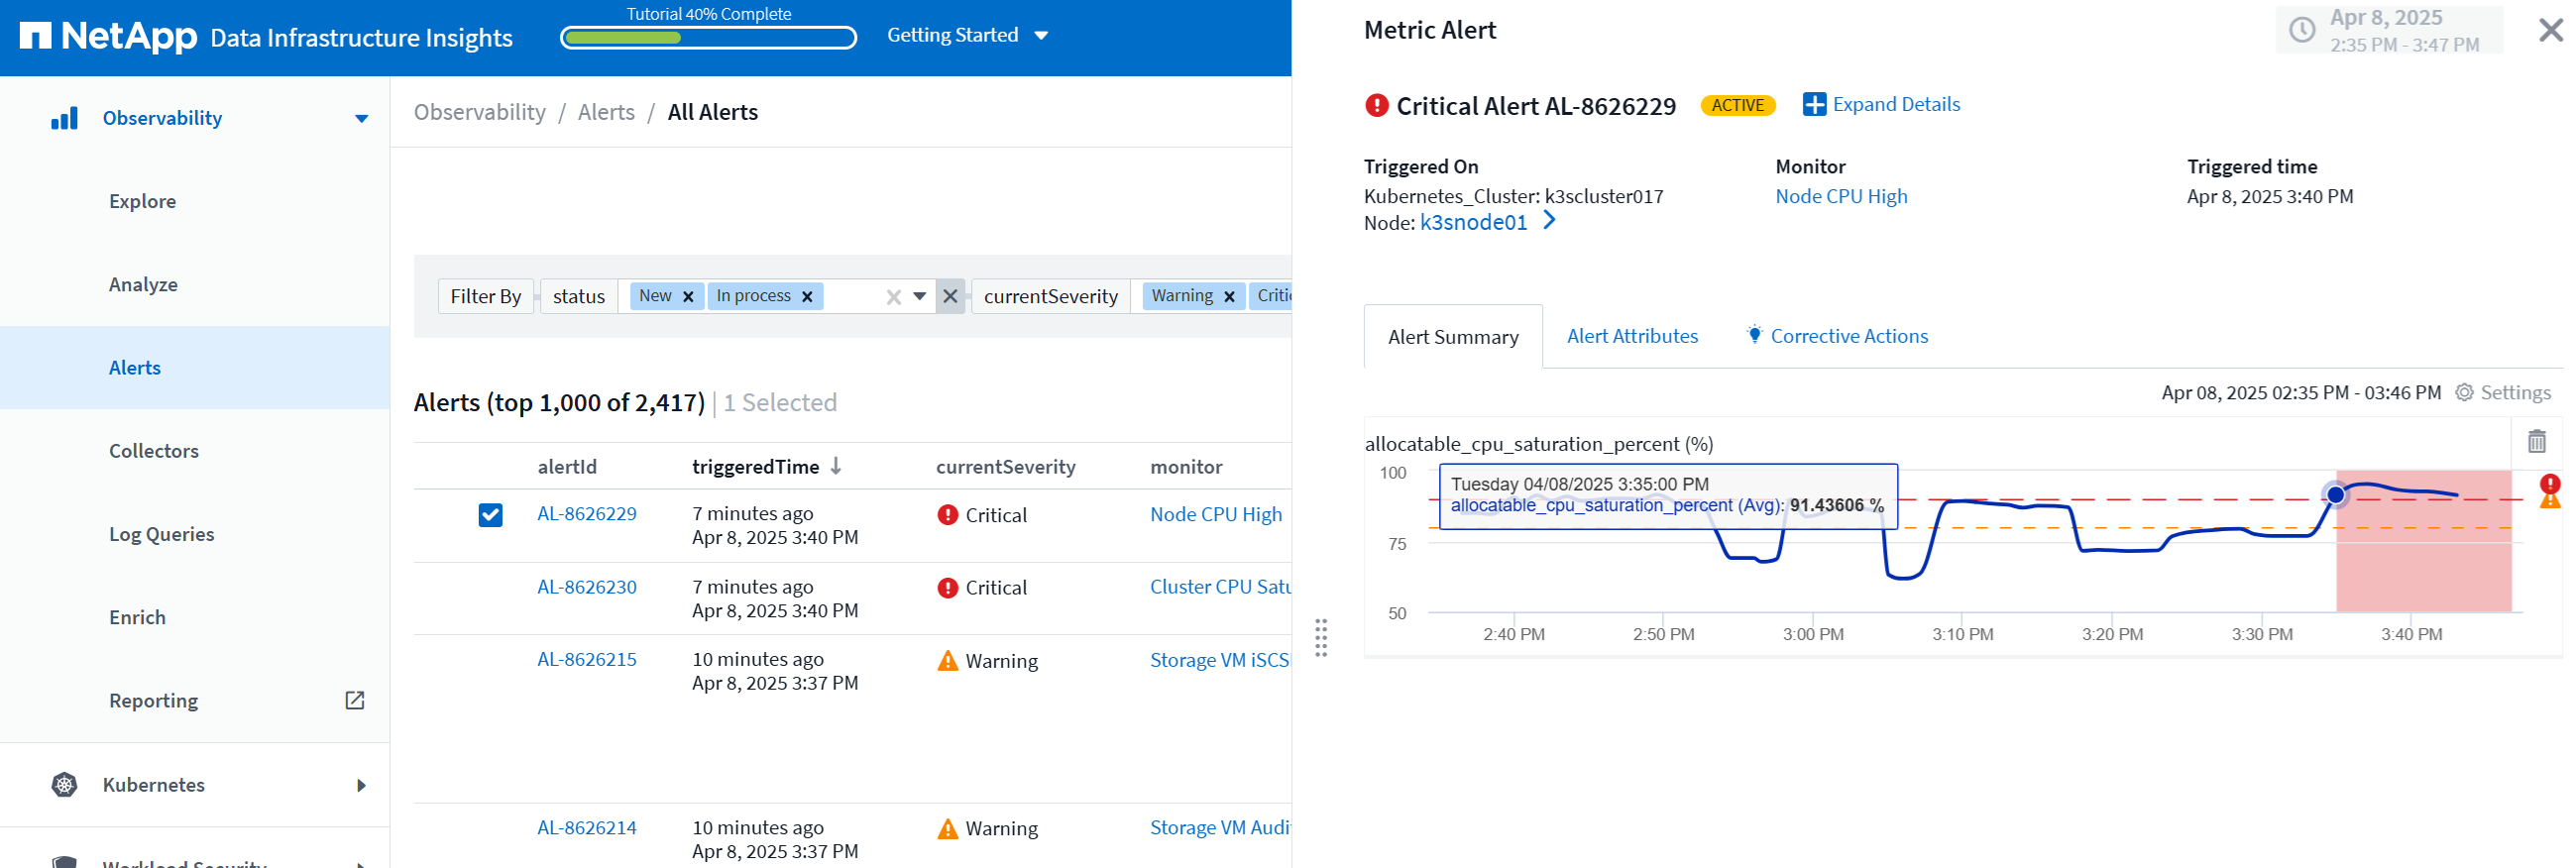
Alert details at your fingertips
Investigating alerts is easier than ever with the new slideout panel. Select an alert to view details for that alert, and easily switch between alerts without losing your place while investigating issues.
Workload Security Forensics Asynchronous Export
Exporting forensics data can take anywhere from a few seconds to a number of hours, depending on the amount of data to export. Workload Security exports that data asynchronously, so you can continue working while the .CSV is being compiled.
Data Collector Notifications grouped into Rules
If you have configured notifications on data collectors, starting April 15 those notifications will be handled in Notification Rules, with a single rule for collectors that have identical recipients. Collectors with different recipients will have separate rules. Existing collector notifications are migrated to notification rules.
March 2025
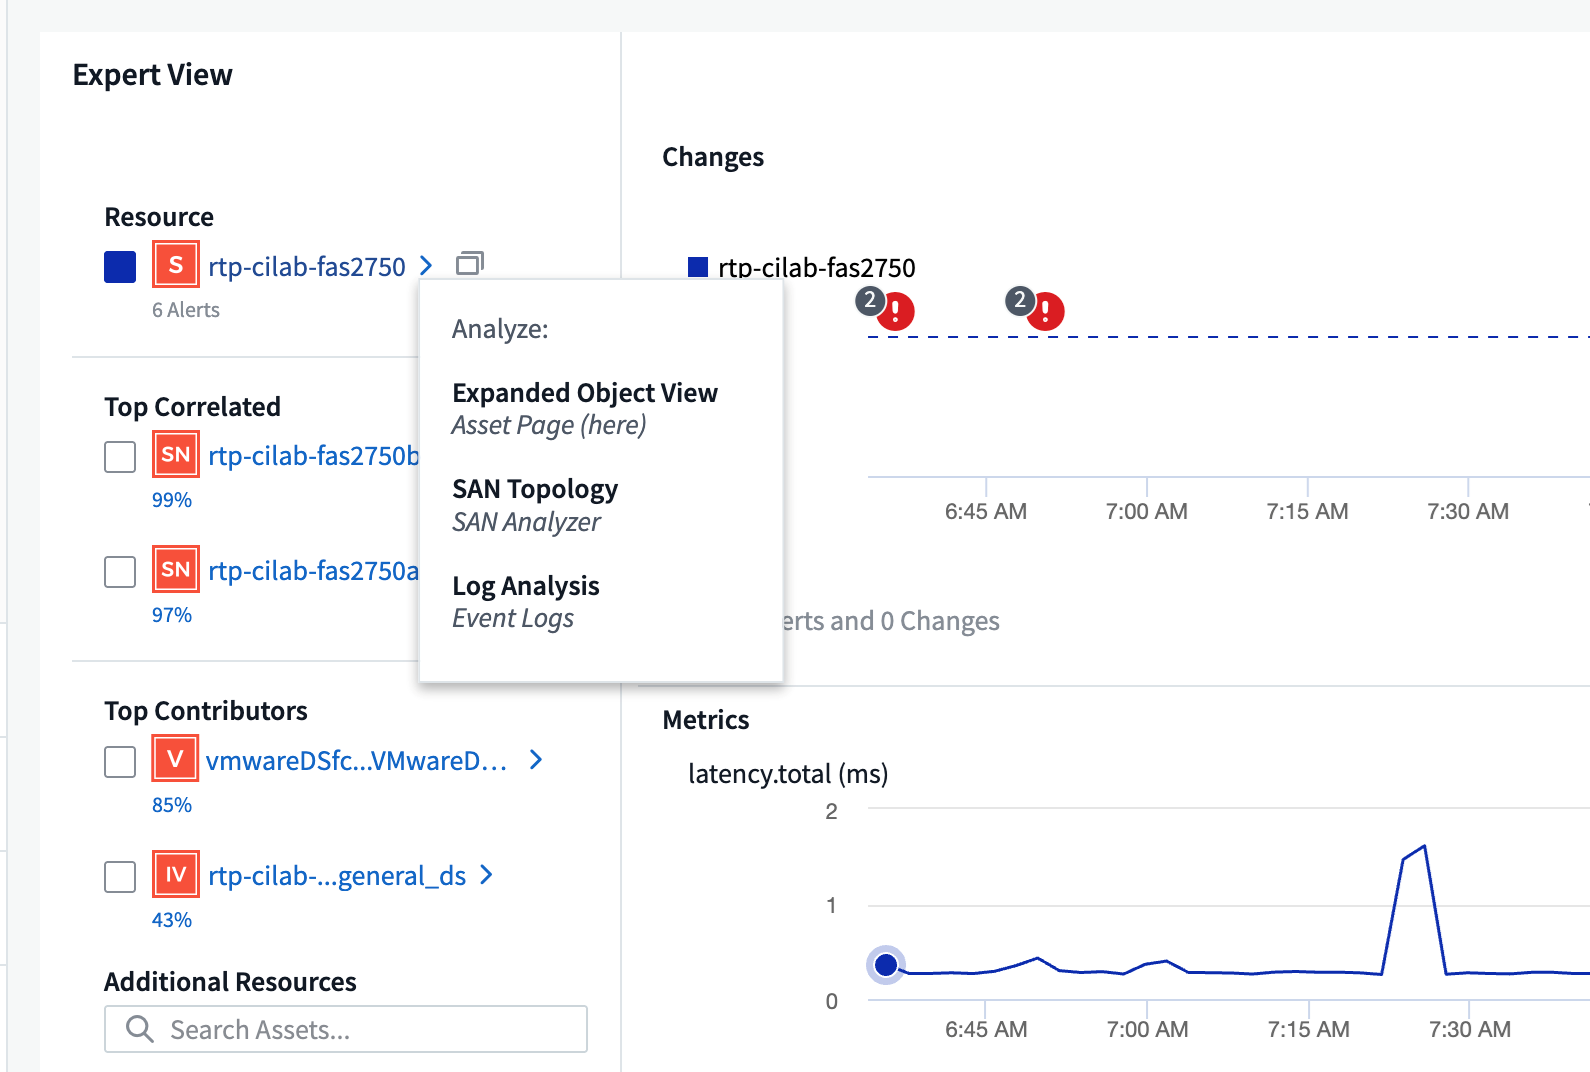
Enhanced Contextual Navigation for Efficient Infrastructure Management
Save time by leveraging Data Infrastructure Insights for operational excellence. We are now adding contextual menu links that allow you to jump directly from any object to the asset landing page for device performance insights, SAN Analyzer for network topology visualization, logs for operational awareness, or Change Analyzer for configuration management.
With instant access to key data across multiple views, you gain a clearer understanding of object relationships more quickly. This streamlined workflow accelerates decision-making and issue resolution, ultimately saving you time and enhancing your overall analysis capabilities.
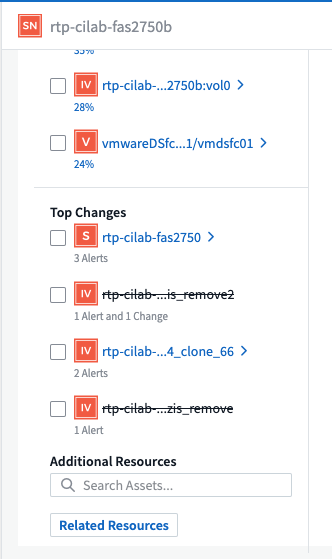
Preserve the History of Removed Assets
Our enhanced Infra Change Feature now preserves the history of removed assets like qtrees and volumes that have moved and are no longer available.
Missing something in your troubleshooting puzzle? Not any more! You'll see everything—including deleted objects marked with a strike-through—giving you complete context even after assets were removed, ensuring you never miss critical elements from past changes or alerts across the end-to-end path.
The result? Quicker resolution times and more confident infrastructure decisions, even when the assets in question no longer exist.
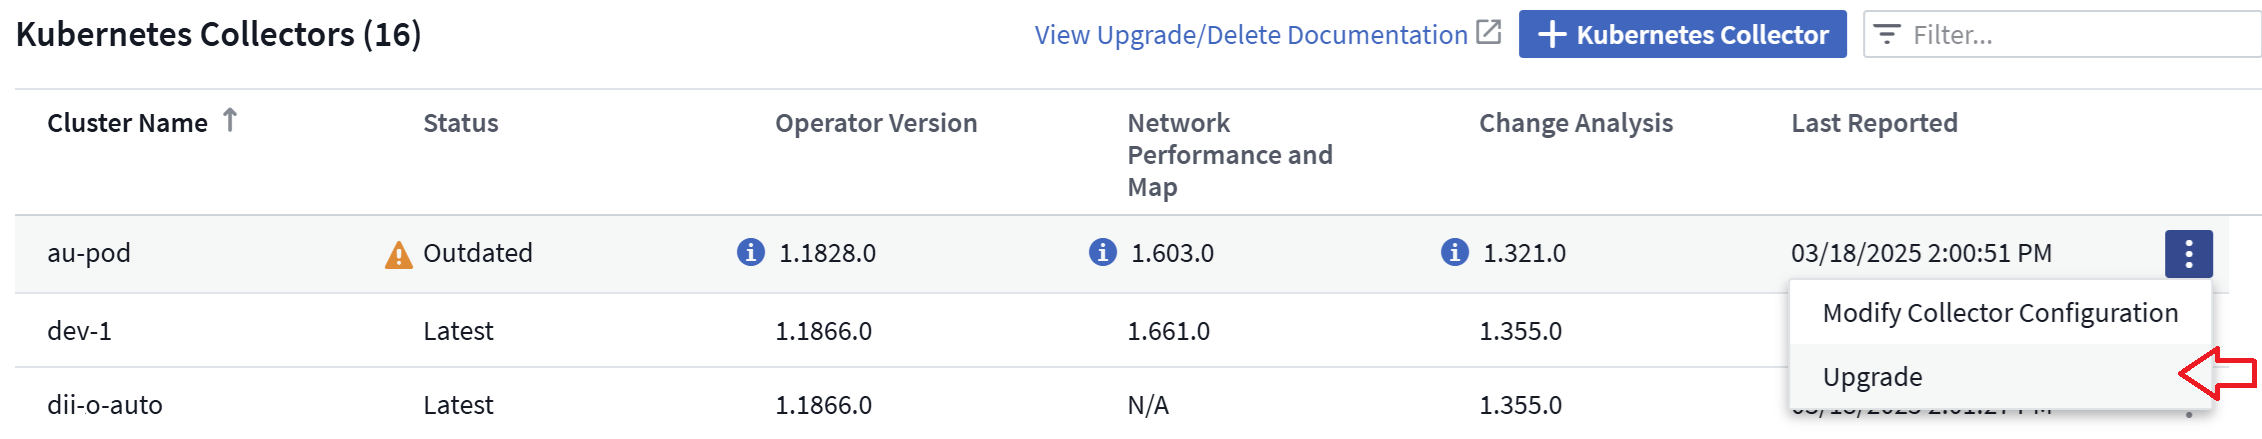
Kubernetes Operator Push-Button Upgrade
Want to be sure you have the latest Kubernetes Operator? Upgrade the operator on-demand from the DII Kubernetes Collectors cluster menu. Simply select Upgrade from the menu, and the operator will verify the image signatures, capture a snapshot of your current installation, and perform the upgrade.
The Push-Button Upgrade is an optional feature, and its activation can be managed on a per-cluster basis.
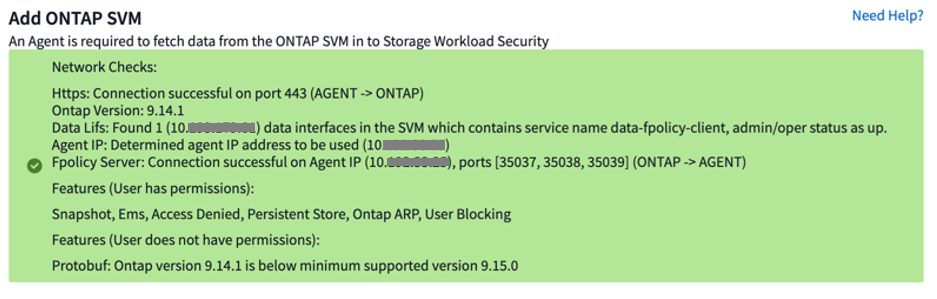
Test Connectivity for Storage Workload Security Data Collectors
The test connectivity feature aims to help end users identify the specific causes of failures when setting up data collectors in Data Infrastructure Insights (DII) Workload Security. This allows the users to self-correct issues related to network communication or missing roles.

Operating System support
The following operating systems are now supported with Data Infrastructure Insights Acquisition Units, in addition to those already supported:
-
AlmaLinux 9.5
-
Debian (64-bit) 11
-
OpenSUSE Leap 15.6
-
Oracle Enterprise Linux (64-bit) 8.9, 8.10, 9.5
-
Red Hat (64-bit) 8.9, 8.10, 9.5
-
Rocky 9.5
-
SUSE Linux Enterprise Server 15 SP6
-
Ubuntu Server 24.04 LTS
February 2025
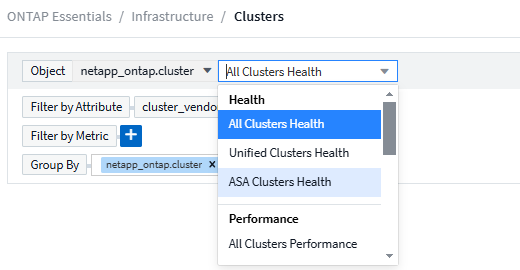
ONTAP essentials now includes out-of-the-box manageability for the latest generation of ASA devices. This includes SAN Analyzer for VM-to-LUN topologies of workloads running on ONTAP, now also available with NetApp support as part of Data Infrastructure Insights Basic Edition.
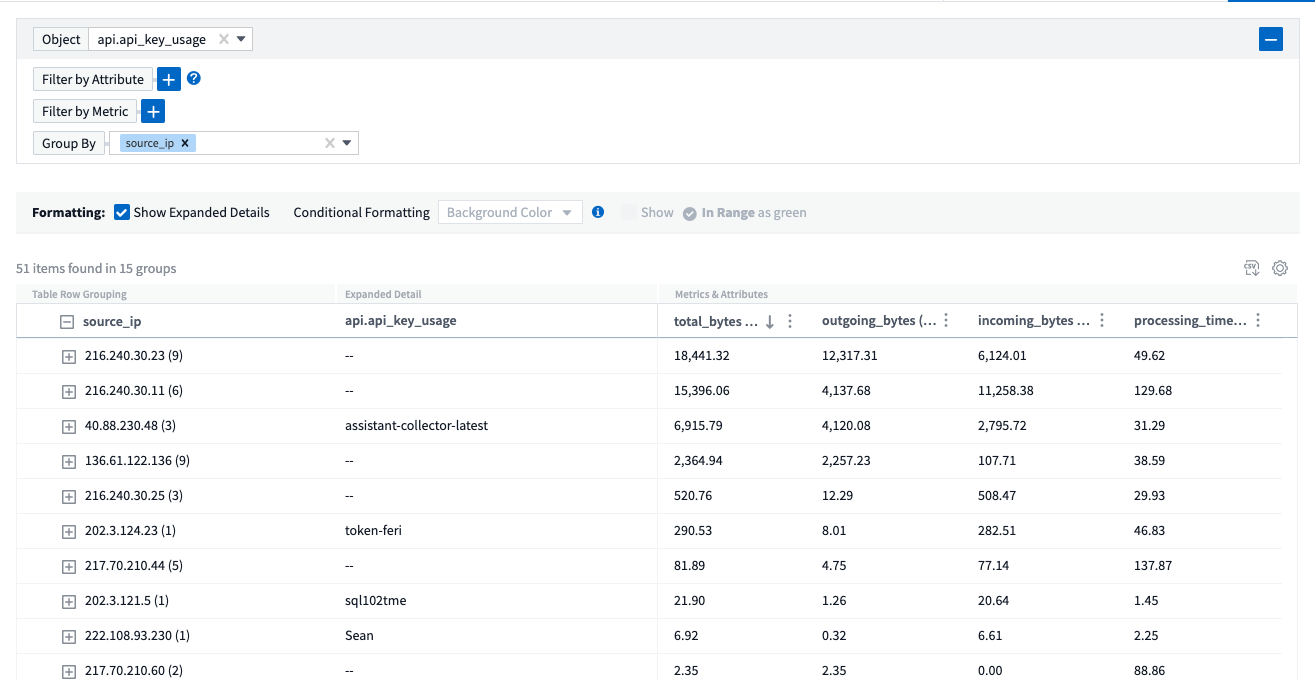
DII API Usage Tracking: Enhance Security and Efficiency
Strengthen your security posture and streamline resource management with enhanced REST API Usage tracking, available for Admin users. With API usage tracking you can see which API tokens are being used, from which IP addresses, and the volume of traffic they generate. By linking tokens to specific IP addresses and usage levels, you'll gain powerful insights into system access and usage trends, giving you the control you need to maintain a safe, efficient environment and keep operations running smoothly.
To view API Usage, navigate to Observability > Admin > API Access and select View API Usage. Note that this API is available for DII Observability APIs only; it does not apply to Workload Security.
Workload Security API to restrict users
A new API has been added to manage user restriction in Workload Security. With the API you can block or unblock a user, or change the duration of their restricted access. See the Admin > API Access > API Documentation page for the cloudsecure_actions.block API.
January 2025
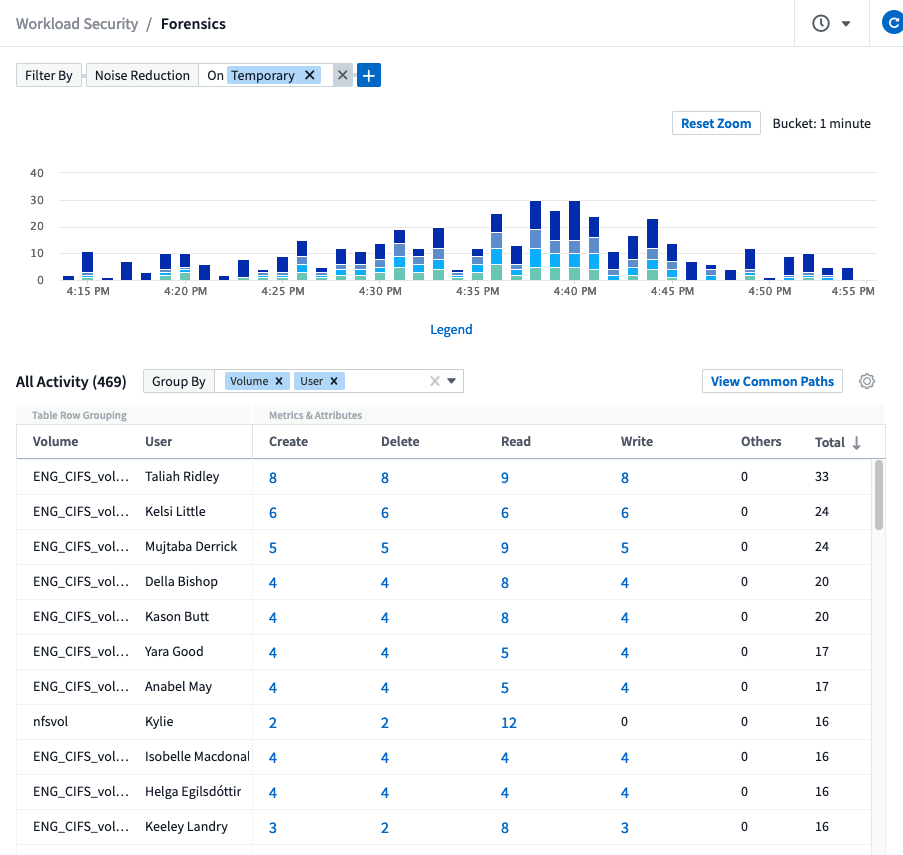
Proactively manage risk with Forensics Grouping
Introducing our latest feature designed to enhance your security and resource management capabilities! With advanced group-by functionality and hierarchical multiple group-by support, you can now easily identify users who accessed specific folders, determine the most active users and shares, and proactively manage risk by tracking active client IP addresses. Optimize your storage and bandwidth usage by pinpointing the most accessed files and folders, and gain increased control over system access by identifying users.
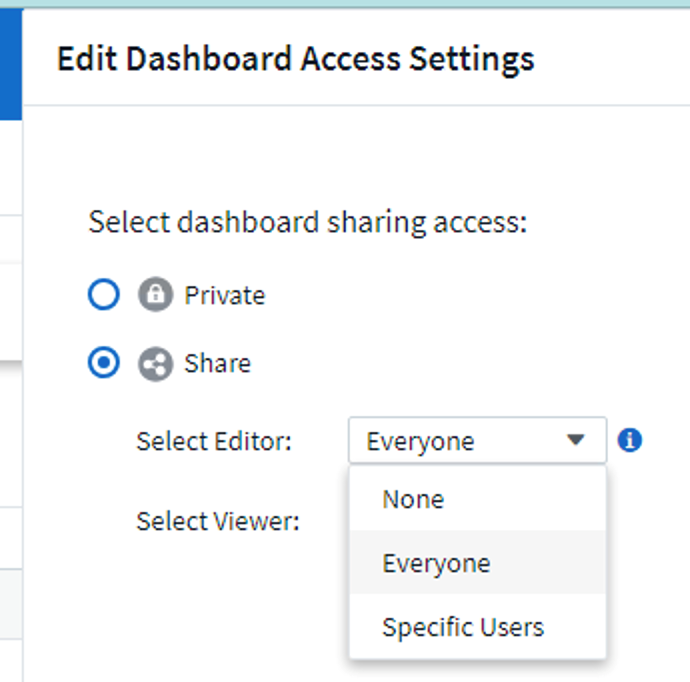
Dashboard Access Control
Data Infrastructure Insights now gives you greater control over access to the dashboards you create. You choose who can modify your graphs. You control exposure to potentially sensitive information. Still working on a dashboard that isn’t ready for general visibility? You can keep it private until you are ready to share it.
December 2024
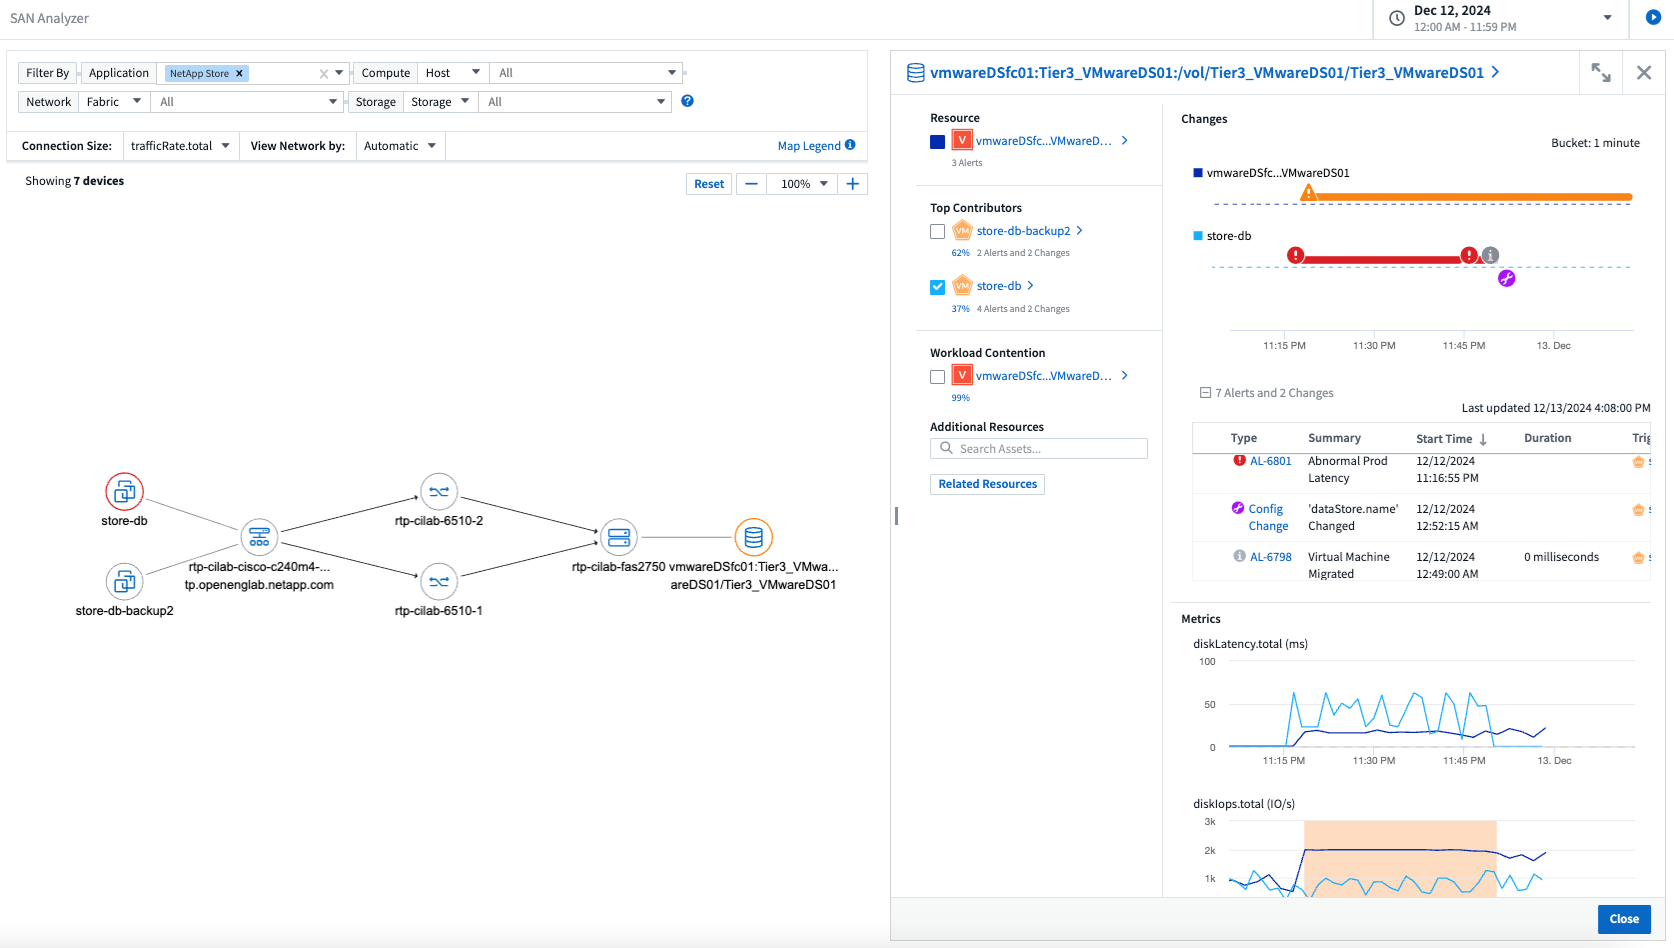
Introducing SAN Analyzer: Enhanced Visibility for Block Workloads
SAN plays a crucial role in handling vital workloads, but its complexity can result in significant outages and customer disruptions. With DII's SAN Analyzer, managing SAN becomes simpler and more efficient. This powerful tool offers end-to-end visibility, mapping dependencies from VM/Host to network to LUN and storage.
By providing an interactive topology map, SAN Analyzer enables you to pinpoint issues, understand changes, and enhance comprehension of data flow. Streamline SAN management in complex IT environments with SAN Analyzer and increase your visibility into block workloads.
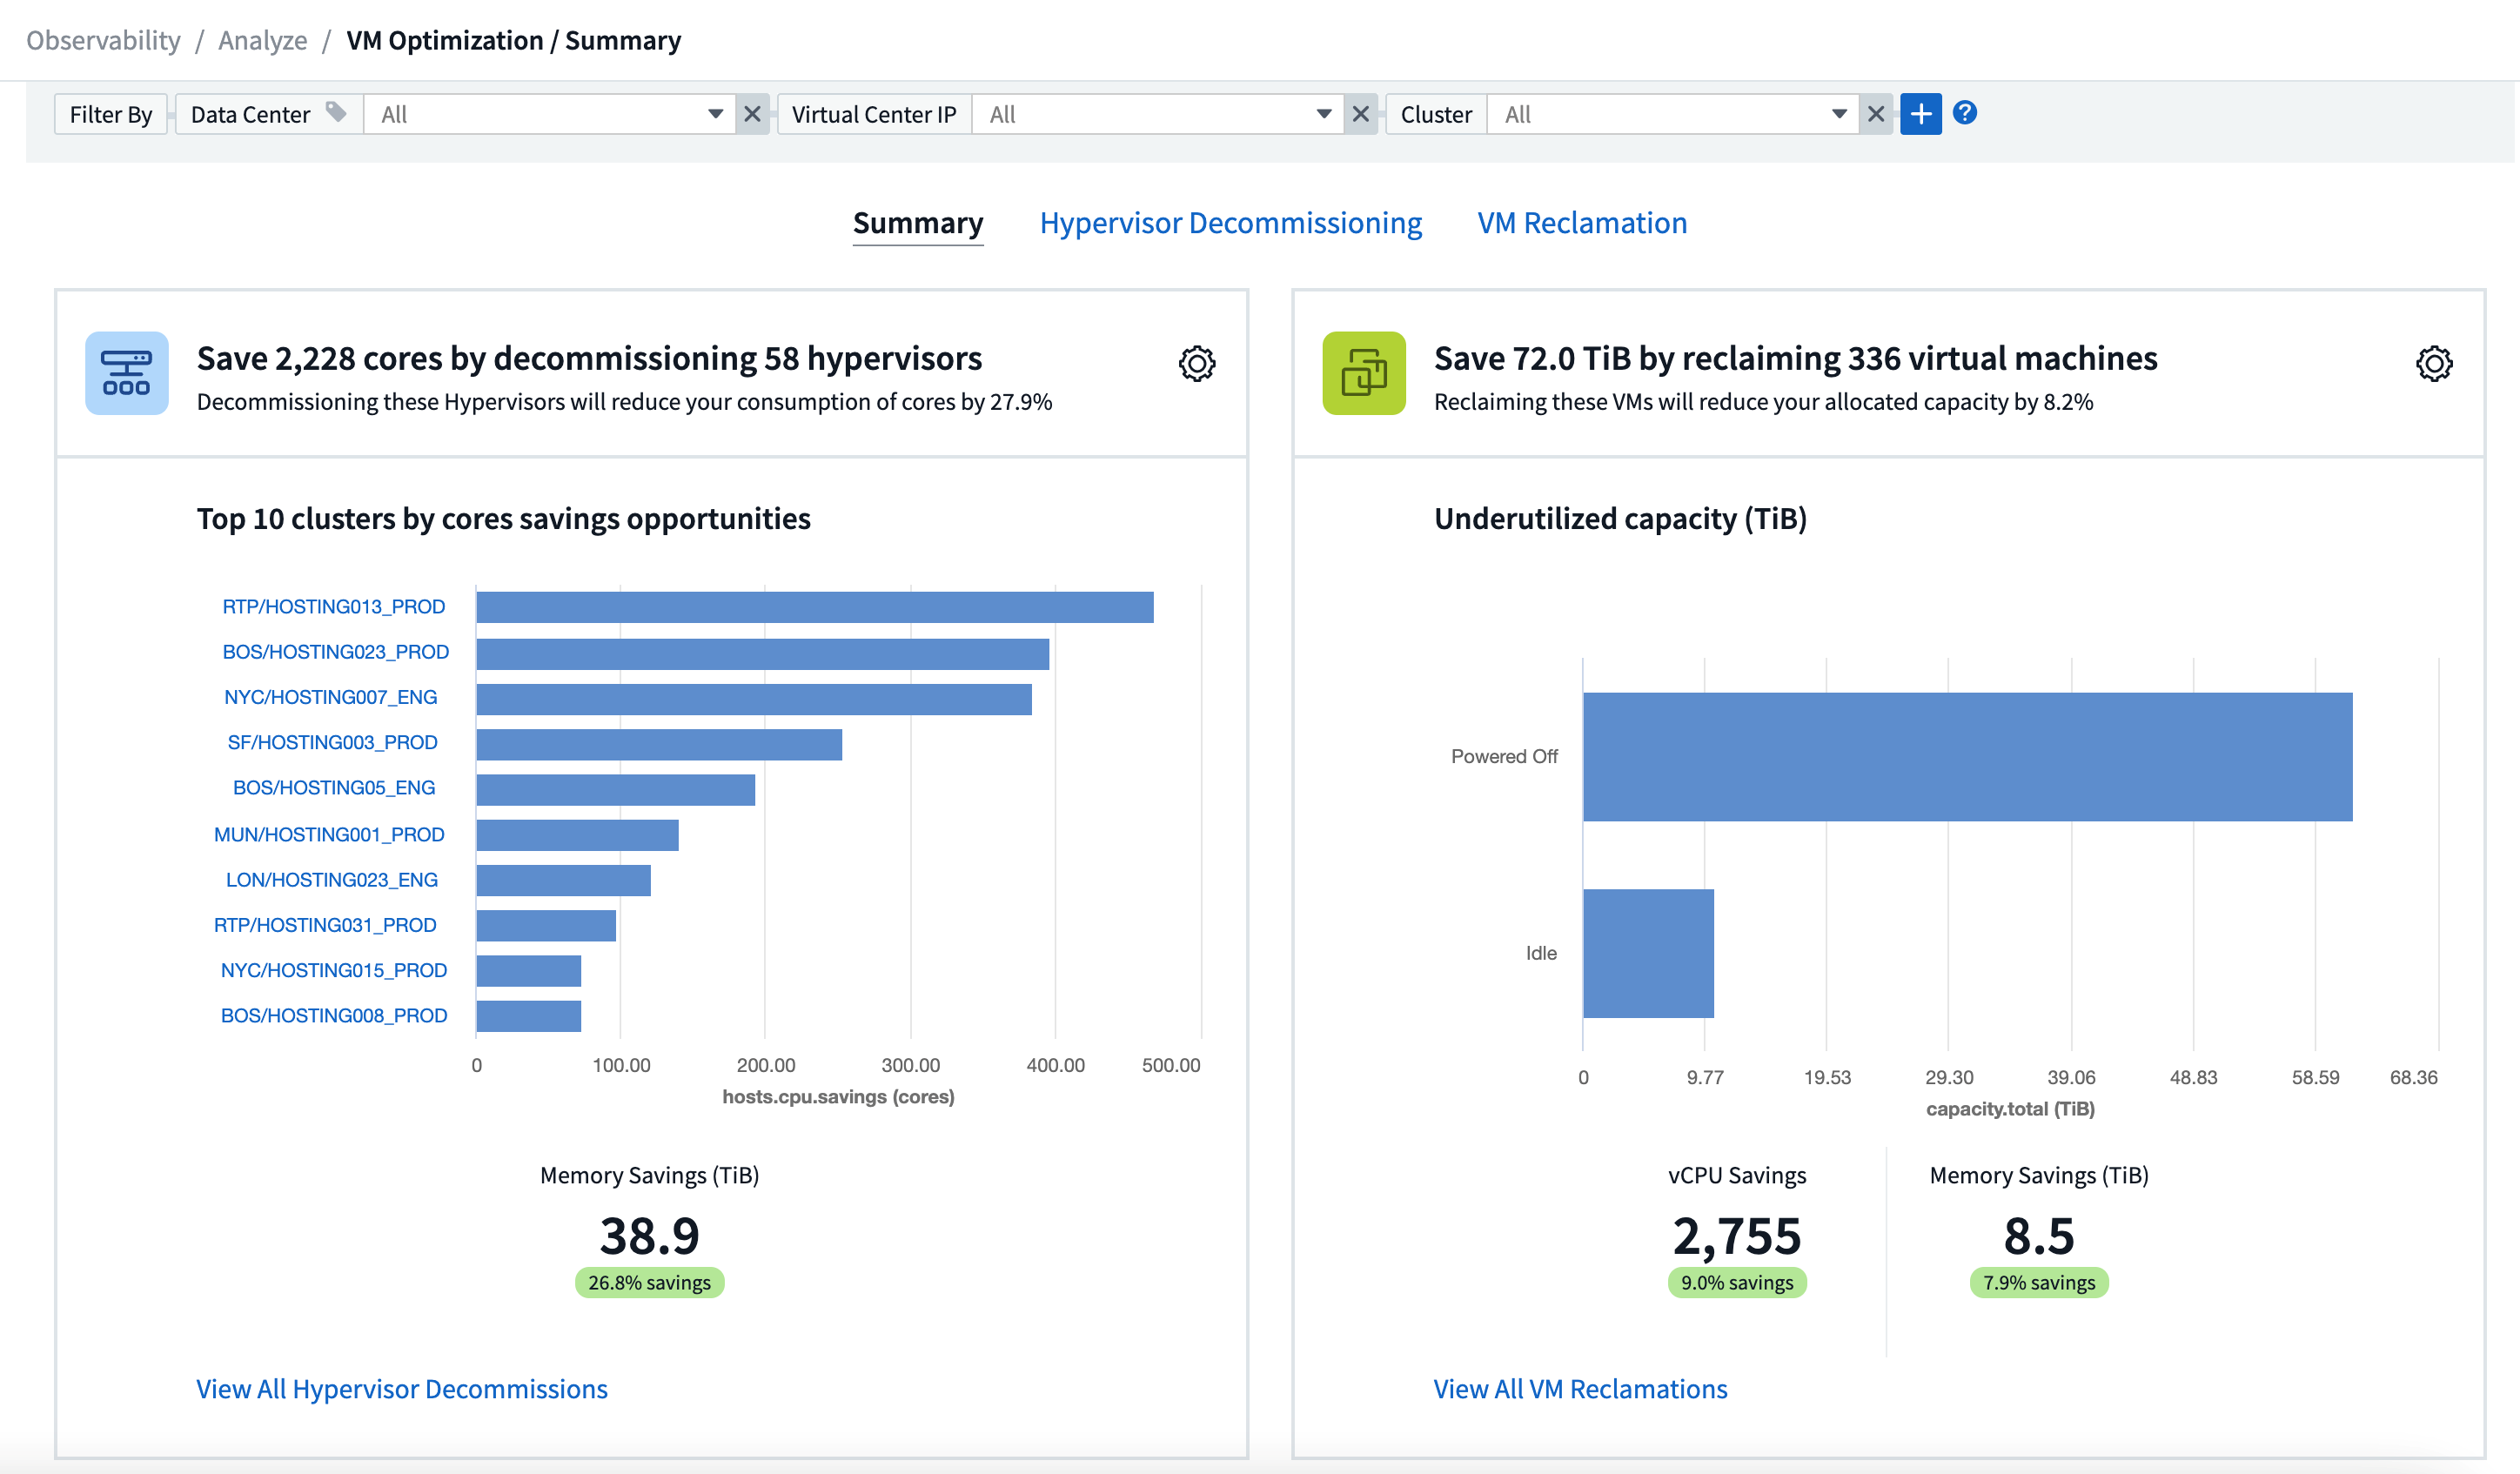
Optimize VM Costs with Intelligent Host Decommissioning and VM Reclamation
Data Infrastructure Insights helps you manage infrastructure and licensing costs by analyzing the historical behavior of the environment and establishing short- and long-term predictions, generating detailed recommendations for host decommissioning and reclamation of powered-off and idle VMs. These recommendations help you ensure performance stability, free up unused capacity, and reduce memory and CPU allocation.
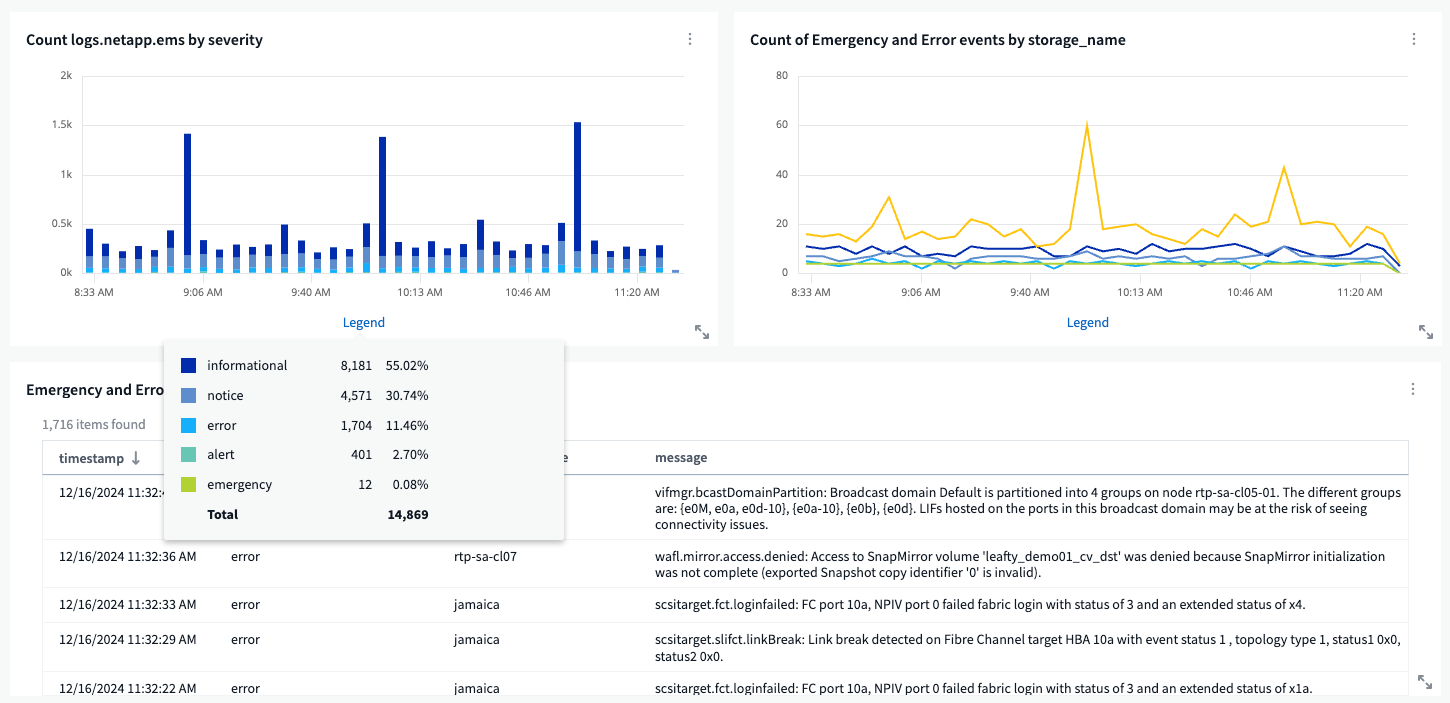
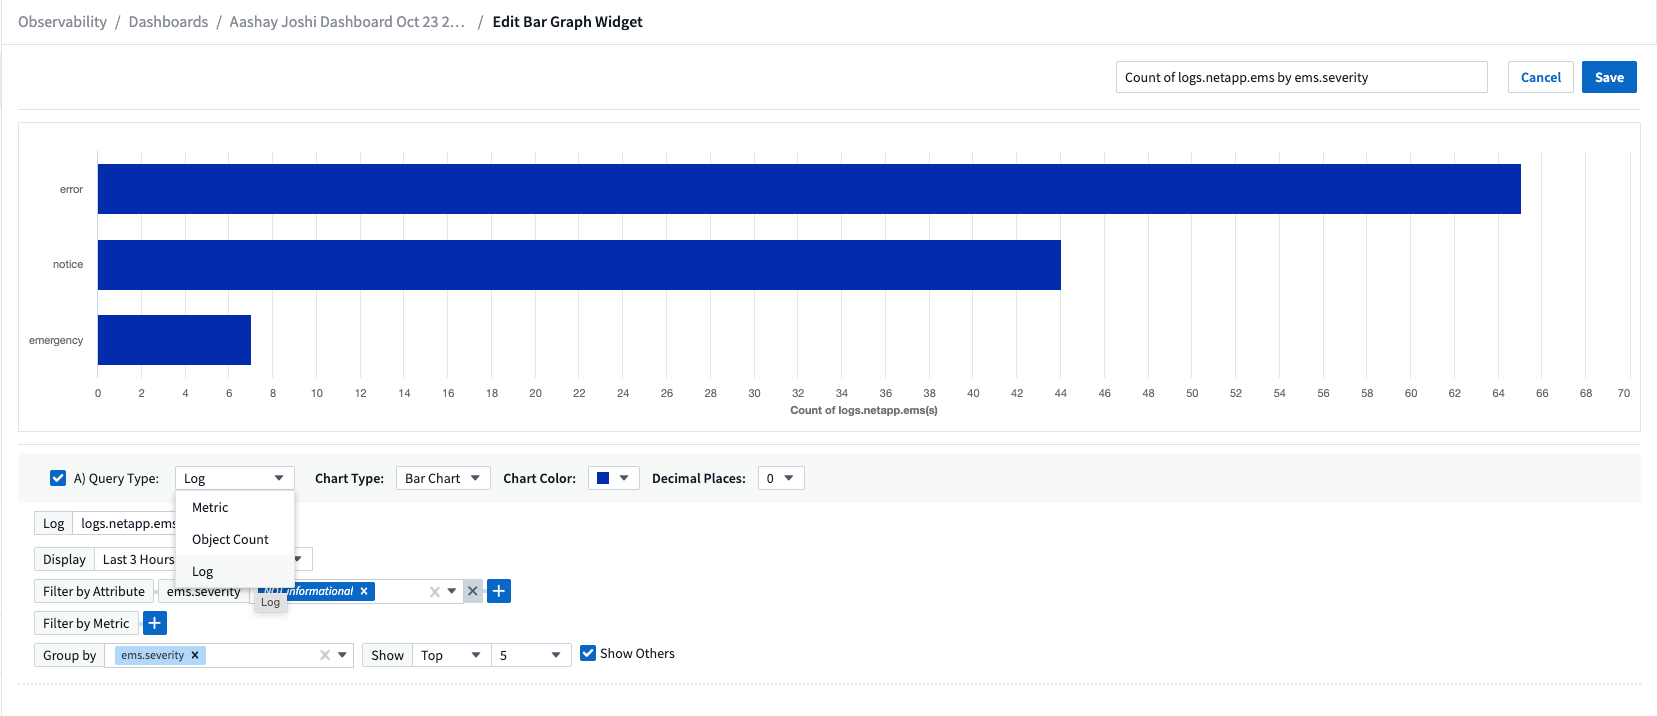
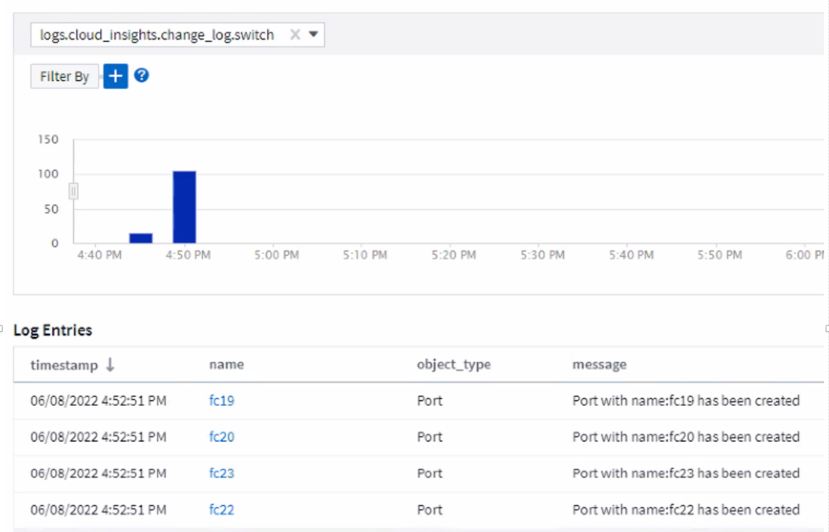
Uncover Log Insights with Time Charts and Table Widget Support
Now you can leverage time charts (bar, line, area) to identify trends and patterns in log data, such as recurring errors or spikes in activity, providing valuable insights into system behavior over time. Additionally, with tables, you can now include log messages directly in the dashboard, enabling a more comprehensive view of log details.
November 2024
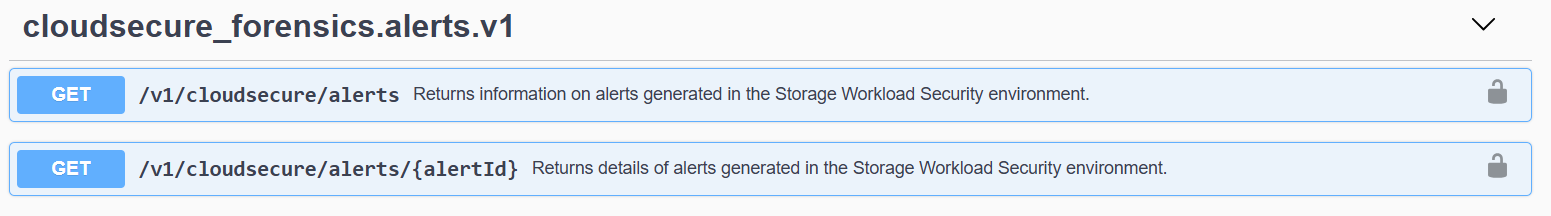
New Workload Security Alerts API
Retrieve forensics alert details with the new Workload Security cloudsecure_forensics.alerts API.
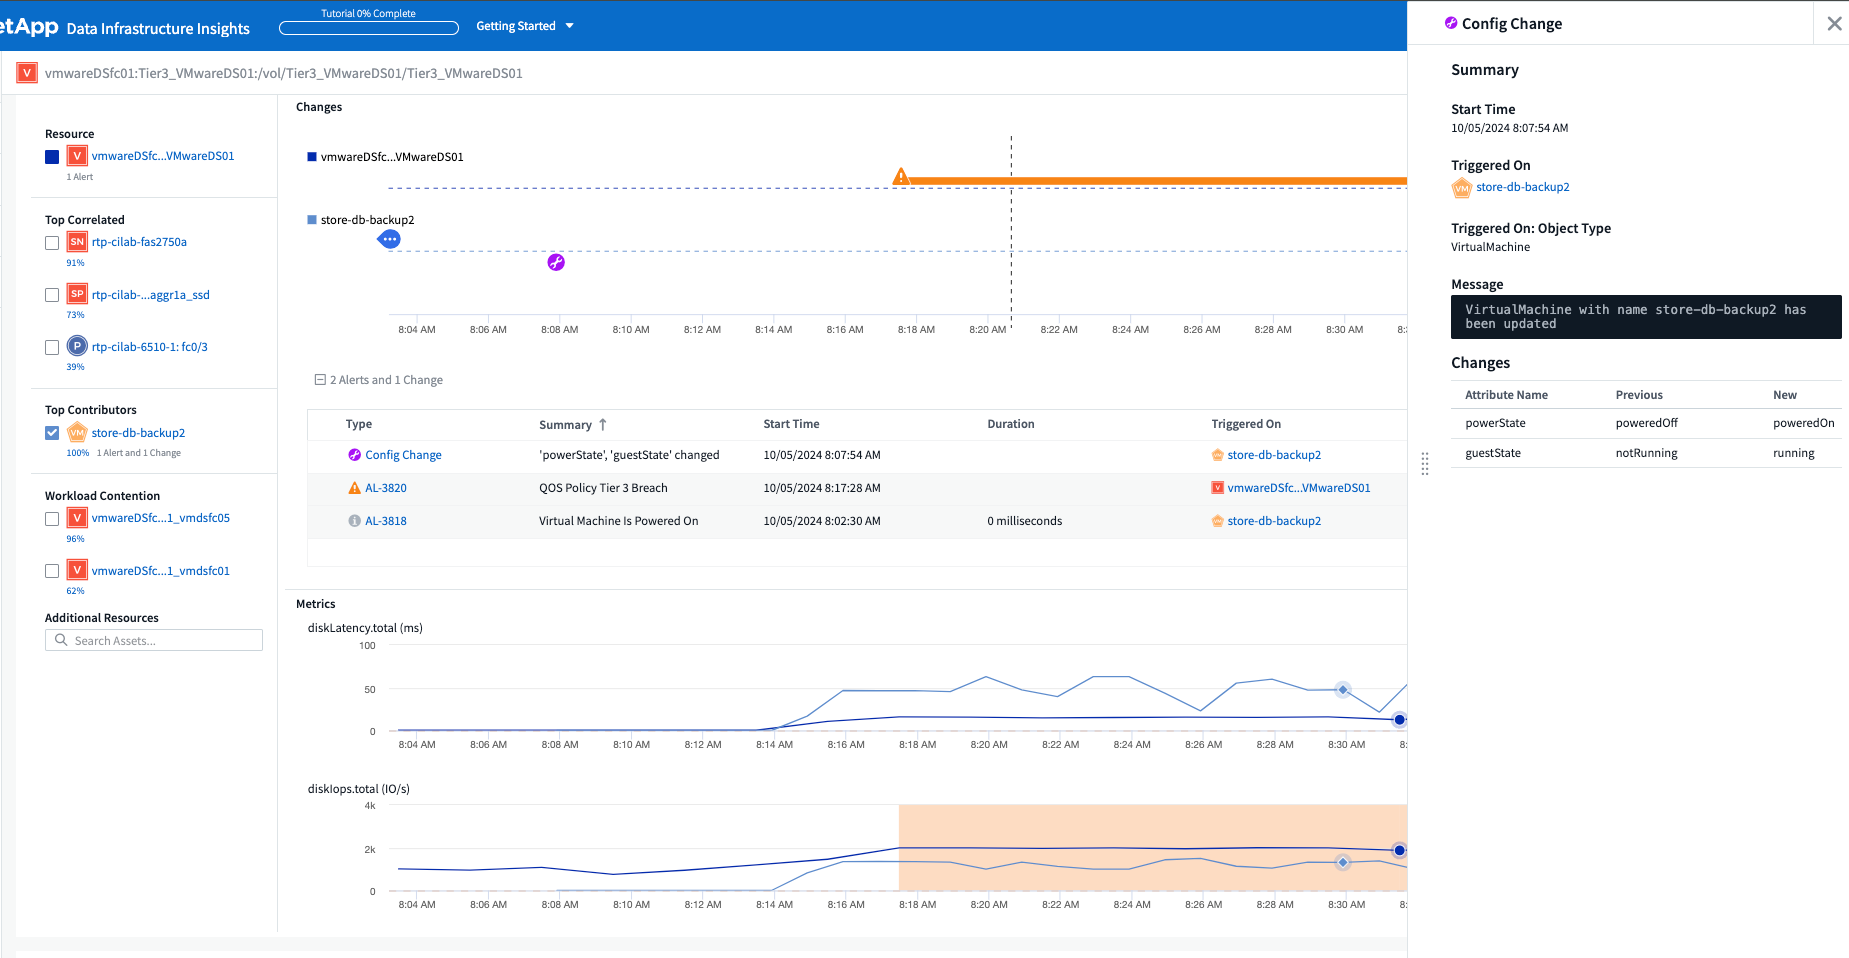
Analyze Configuration Changes in your Environment
Configuration changes are one of the most common causes of issues in modern IT. Data Infrastructure Insights' (DII’s) new change analysis capability lets you clearly understand changes that cause issues in your environment. Accelerate troubleshooting time by showing all changes in devices and related infrastructure components that may have led to an issue. Additionally, when you or your team perform planned changes, you can validate those changes quickly and ensure there are no unexpected effects before service levels are impacted.
KubeVirt Support: Monitor Virtual Machine workloads running within your Kubernetes Cluster
DII now fully supports KubeVirt, the Kubernetes-native virtualization solution used by platforms like OpenShift Virtualization and Harvester. Gain full visibility into the metrics, events, configuration changes, and network traffic of both Virtual Machines and Container workloads within your Kubernetes clusters.
October 2024
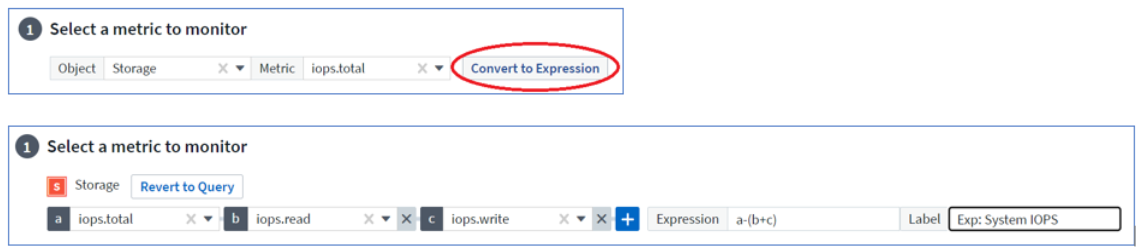
Unlock New Insights with Custom Expressions in Monitors
Expressions enable you to perform arithmetic operations in Metric and Anomaly Detection Monitors. Here are some examples:
-
Ratio: IOPS/TB to detect where service level limits are being reached on cloud storage providers.
-
Percentage: Used/Available to calculate utilization
-
Aggregation: Combine multiple types of physical port errors into one monitor
-
Comparison: Compare current resource headroom utilization with the optimal headroom point to identify resources that are not running at full capacity.
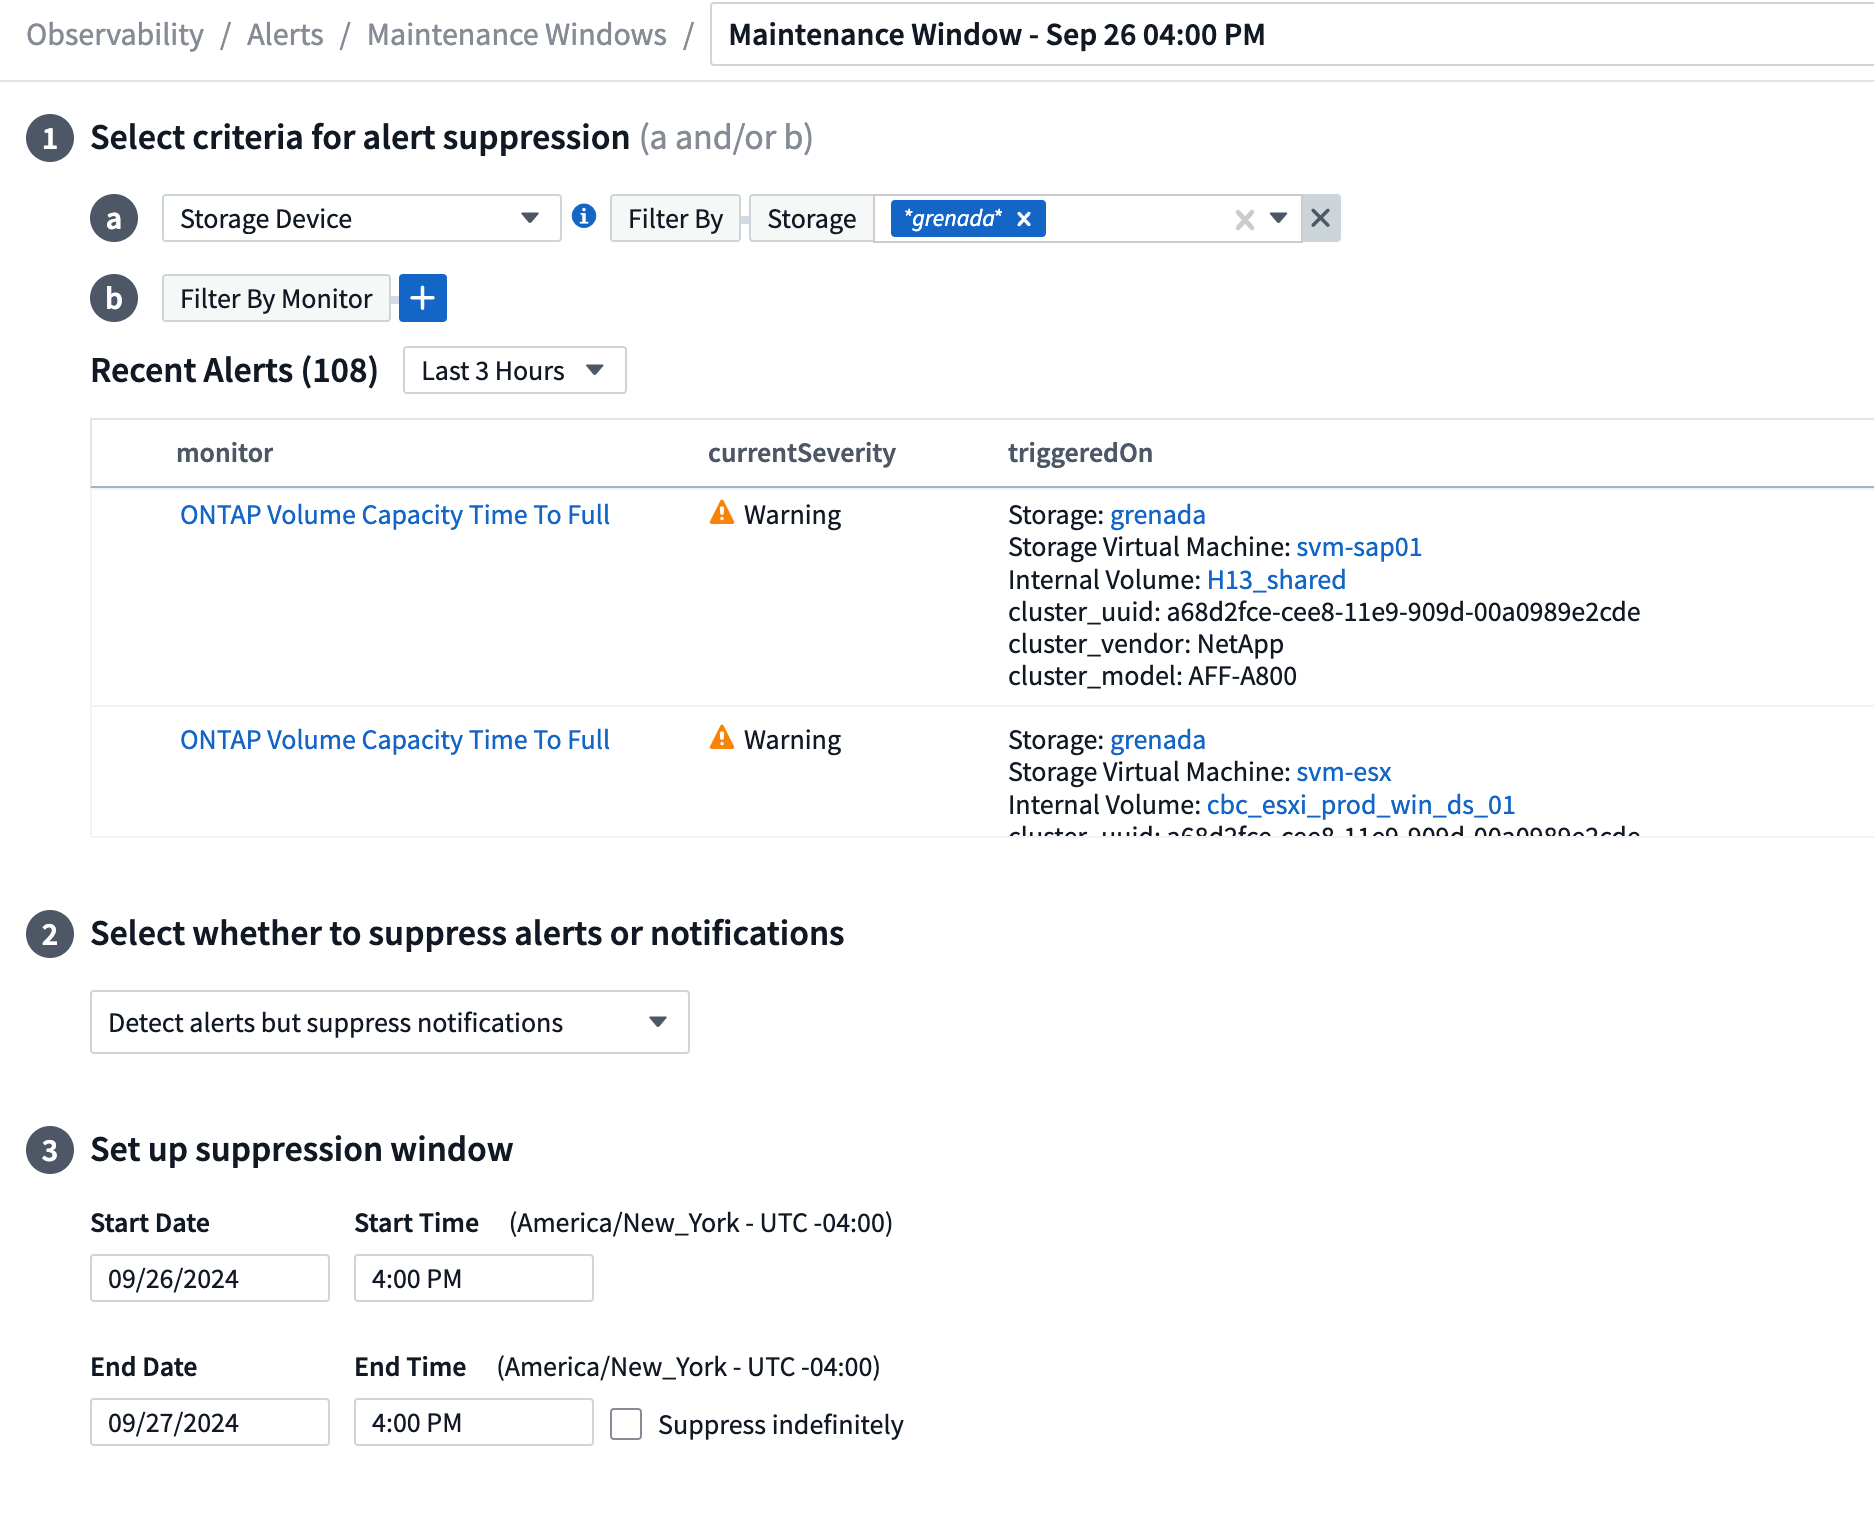
Minimize Alert Disruptions During Maintenance Period
Maintenance Windows allow you to suppress alert notifications during scheduled maintenance periods, helping you avoid unnecessary disruptions.
With Maintenance Windows, you can schedule specific maintenance periods during which alert notifications are suppressed, for the objects and metrics you choose. For example, you can suppress alert notifications triggered by specific storage systems, when those storage systems are in a planned upgrade period.
Note that only alert notifications are suppressed (email, webhook); the alerts themselves are still shown on the Observability > Alerts > All Alerts page.
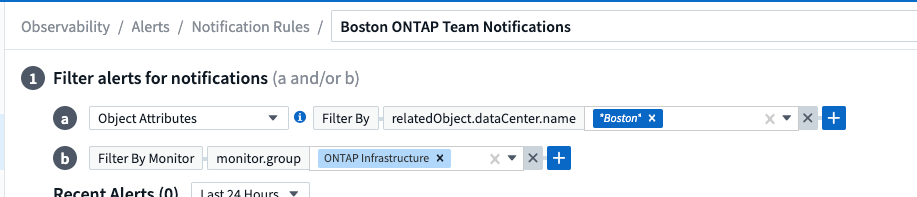
Streamline Alert Management with New Alert Notification Rules
Alert Notification Rules simplify notification management across monitors and teams.
Control alert delivery across your organization's channels, ensuring the right information reaches the right team. No need to manage separate monitors for different teams; route alerts based on related object attributes (storage name, data center, application name) or monitor attributes (group, severity).
Log Analytics in dashboards
You can now include log events in your dashboards, to visualize event data and have more comprehensive and contextual understanding of your environment. Investigate logs and view related metrics without leaving the dashboard!
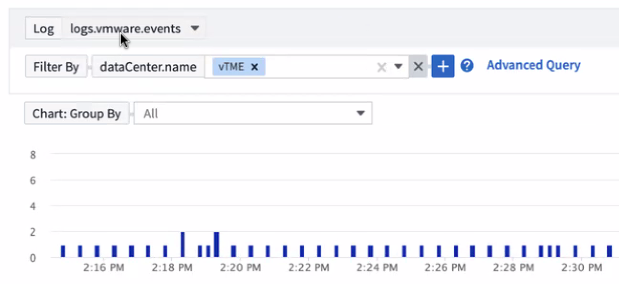
Better VMware Observability with VMware Events
Proactively manage and troubleshoot your VMware environment with real-time events. VMware events provide insights on VM migrations, resource allocations, and host health. Now available for use in Queries, Dashboards, and Monitors. Requires VMware version 8 or higher. Simply select the logs.vmware.events source.
VMware Events are also used for DII's new Configuration Change Analysis noted above.
Data Collector updates:
-
Pure FlashBlade: This collector gathers inventory and performance data from FlashBlade clusters that expose version 2 of their REST API.
September 2024
Introducing Data Infrastructure Insights, formerly Cloud Insights
On Tuesday, September 24, 2024, NetApp has officially changed the name of Cloud Insights to Data Infrastructure Insights (DII). This has been announced during the Insight user conference by Haiyan Song in her main stage keynote presentation and in an Insight conference product press release.
The DII service remains the same; there are no feature changes or modifications. This is a name change to better align the service name with its capabilities for all IT infrastructure.
August 2024
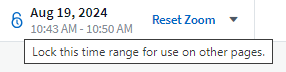
View Data Specific to Your Time Range
Investigating an alert? Zoomed in on a chart? These actions change the time range for those pages. Now you can lock that time range, navigate to other Cloud Insights pages, and see data specific to that locked time range. Investigating and troubleshooting just got a whole lot easier!
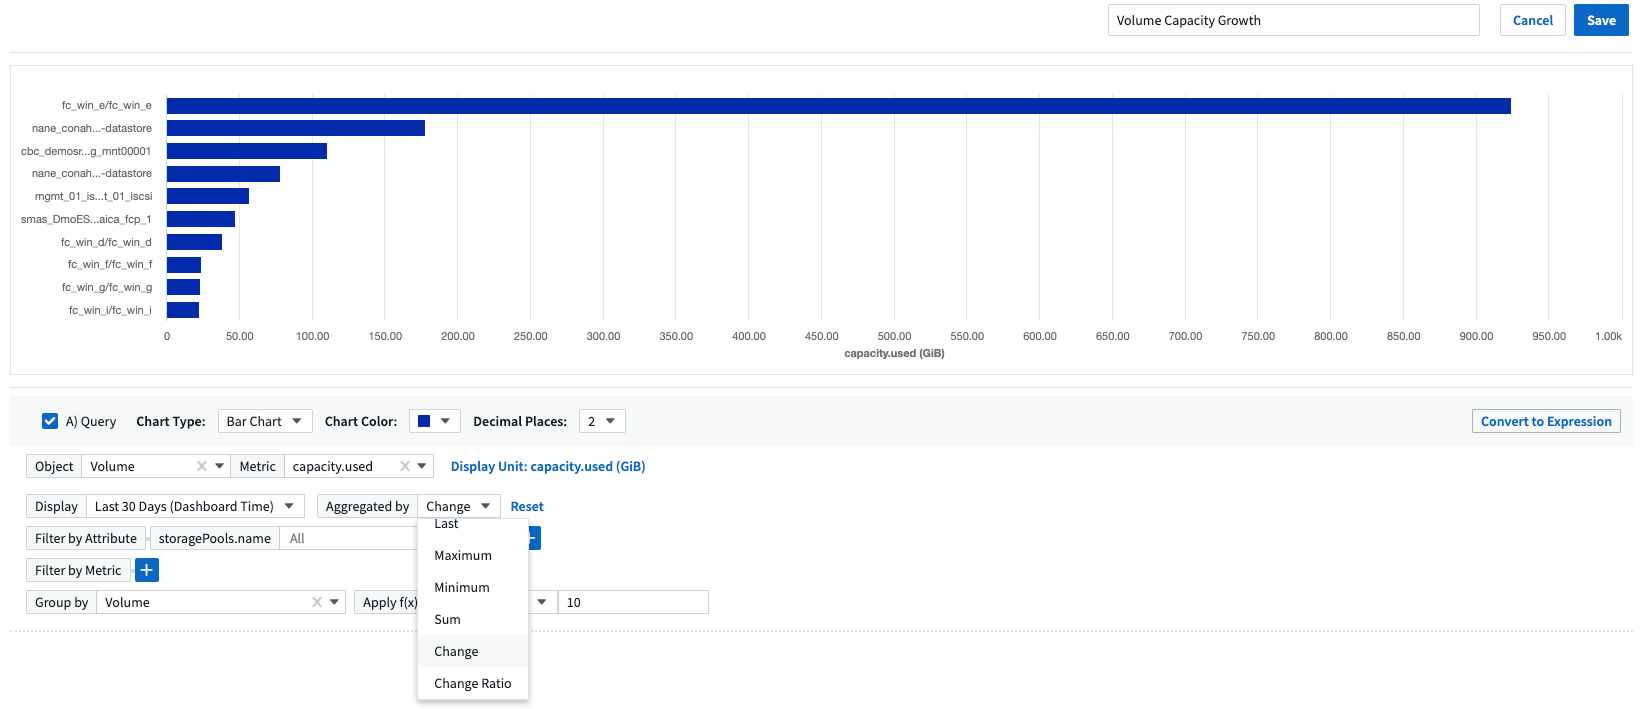
Change and Change Ratio (%) Analysis
Change-ratio time aggregations aid you in identifying significant changes and trends in metric values over time.
Those insights are key to understanding what changed, such as considerable capacity growth for a specific time or a change in single port performance.
-
Change - observe the change in a metric between two points within a selected period.
-
Change Ratio - observe the proportional change in a metric between two points, with respect to the initial point, within a selected period.
Export Log Query Results to .CSV
When viewing log query results, easily export up to 10,000 rows to .CSV by clicking the new "Export" button. This enhances data accessibility, eases data analysis and reporting, and facilitates seamless integration with other data processing tools.

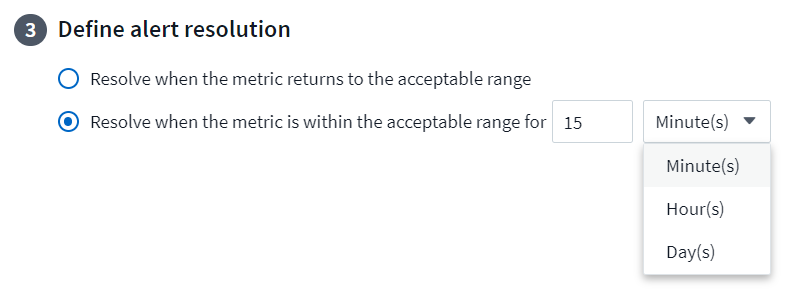
Resolve Alerts by time
Cloud Insights now gives you the option to resolve an alert when the monitored metric stays within the acceptable range for a specified duration. This lets you focus on genuine issues, reducing the noise associated with metrics repeatedly crossing defined thresholds by consolidating multiple alerts to one.
July 2024
AIOps: Anomaly Detection
Cloud Insights uses machine learning to detect unexpected changes in the patterns of data in your environment, and provide proactive alerts to help you identify problems early.
A data center behaves in different ways at different times of the day, and on different days of the week. Cloud Insights uses weekly seasonality to compare historical behavior for each day and time.
Anomaly Detection Monitoring can provide alerts for situations such as when the definition of "normal" is unclear, where behavior changes over time, or when working with large amounts of data where manually defining thresholds is impractical.
New Anomaly Detection Monitors alert when anomalies such as this occur on object metrics you choose.
Workload Security Improvements
NFS 4.1 support
The SVM Data Collector now supports NFS versions up to and including NFS 4.1 with ONTAP 9.15.1 or later..
New Forensics Activity API
The Forensics Activity API has a new version. When calling the API for Forensics Activity, use the cloudsecure_forensics.activities.v2 API.
Note that if you are making multiple calls to this API, for best results ensure that the calls occur sequentially, instead of in parallel. Multiple parallel calls may cause the API to time out.
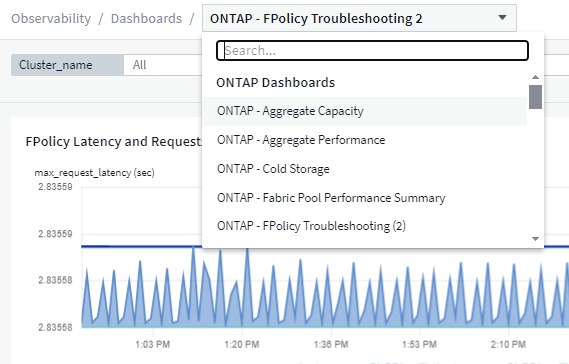
Easier Dashboard Navigation
This feature is all about streamlining your operational workflows and making it easier to collaborate between teams.
Grouping your dashboards makes it easier to quickly get the visibility you need, and now with the new navigation menu, you can jump between different dashboards without losing your place, making it a breeze to explore and manage your infrastructure.
Align dashboard groups with your operational runbooks to further enhance your experience.
June 2024
Operating System support
The following operating systems are supported with Cloud Insights Acquisition Units, in addition to those already supported:
-
Red Hat Enterprise Linux 8.9, 8.10, 9.4
-
Rocky 9.4
-
AlmaLinux 9.3 and 9.4
May 2024
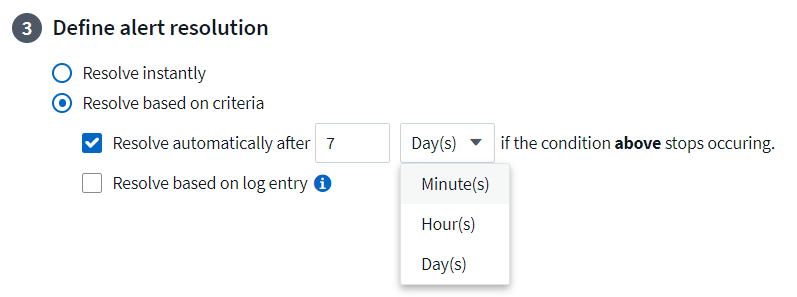
Automatically resolve alerts based on time
Log alerts can now be resolved based on time; if the alert condition stops occurring, Cloud Insights can resolve the alert automatically after a specified time has passed. You can choose to resolve the alert in minutes, hours, or days.
April 2024
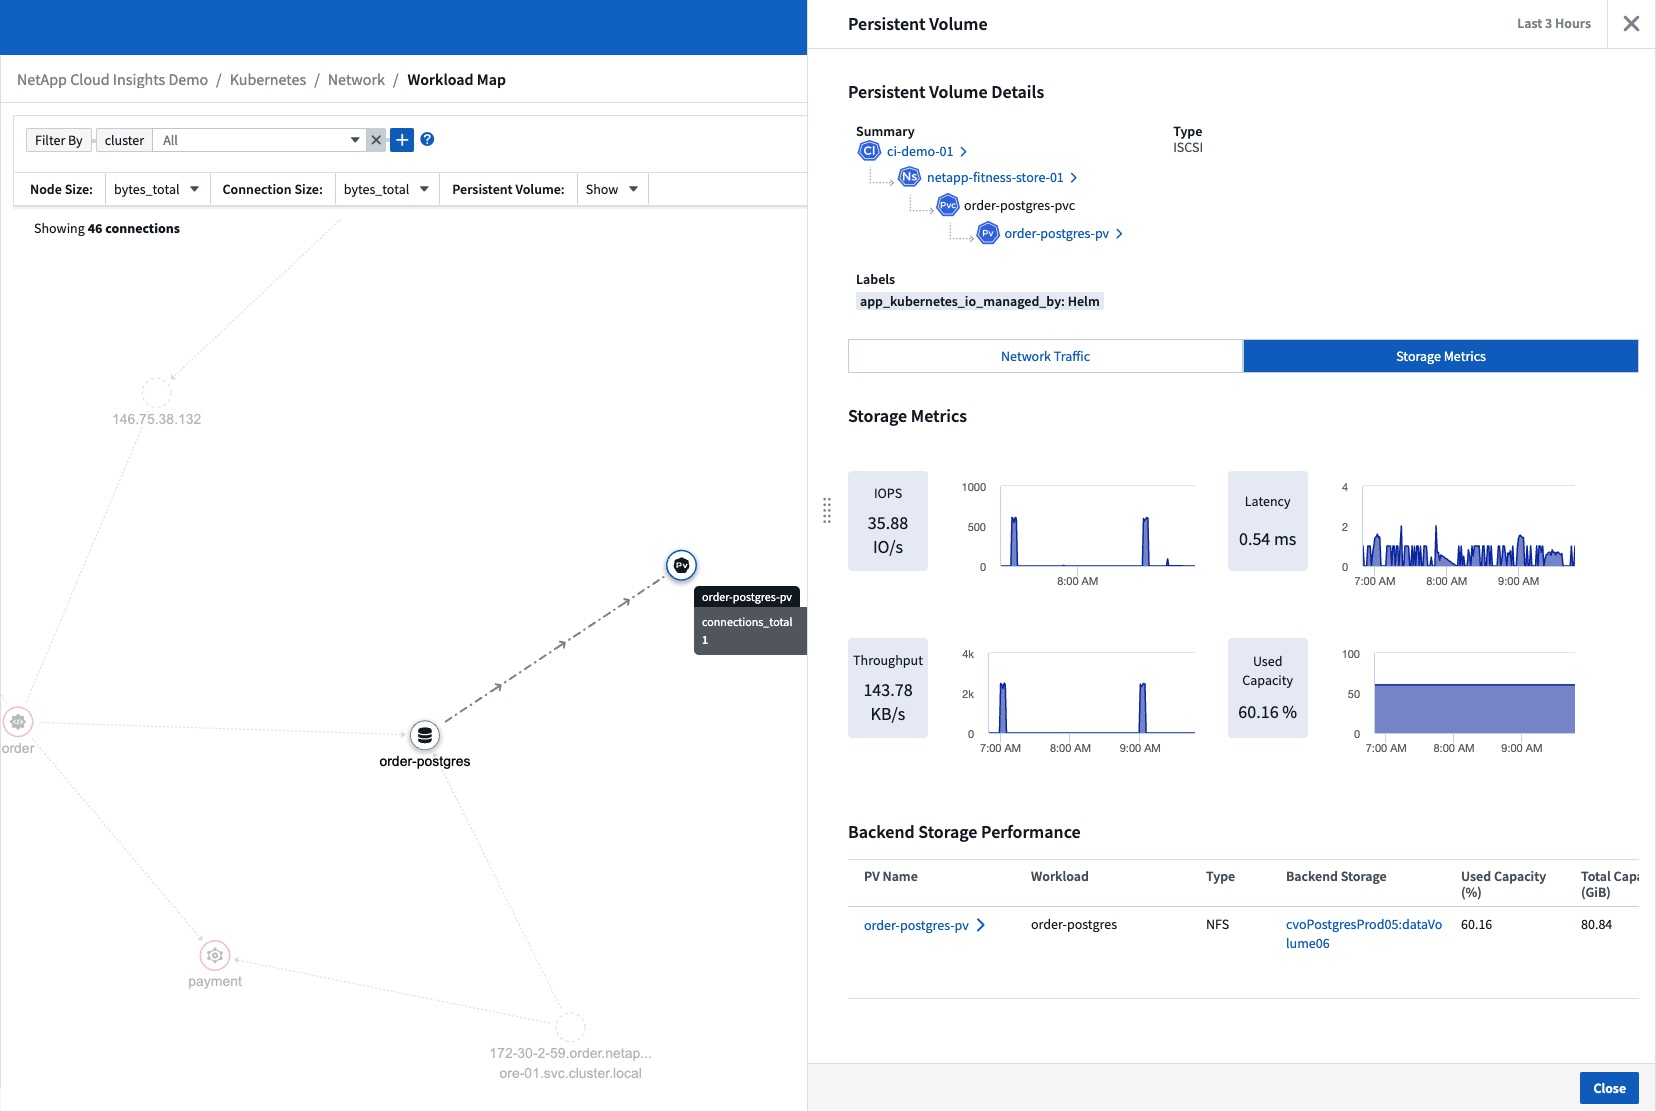
iSCSI support for Kubernetes
Cloud Insights now has support to map the iSCSI storage associated with Kubernetes, allowing faster troubleshooting using the Kubernetes network map and the ability to provide chargeback or showback reports via Reporting.
Operating System support
The following operating systems are supported with Cloud Insights Acquisition Units, in addition to those already supported:
-
Oracle Enterprise Linux 8.8
-
Red Hat Enterprise Linux 8.8
-
Rocky 9.3
-
OpenSUSE Leap 15.1 through 15.5
-
SUSE Enterprise Linux Server 15, 15 SP2 through 15 SP5
March 2024
Workload Security Agent Details
Each of your Workload Security Agents has its own landing page, where you can easily see summary information about the Agent as well as the installed Data and User Directory Collectors associated with that Agent.
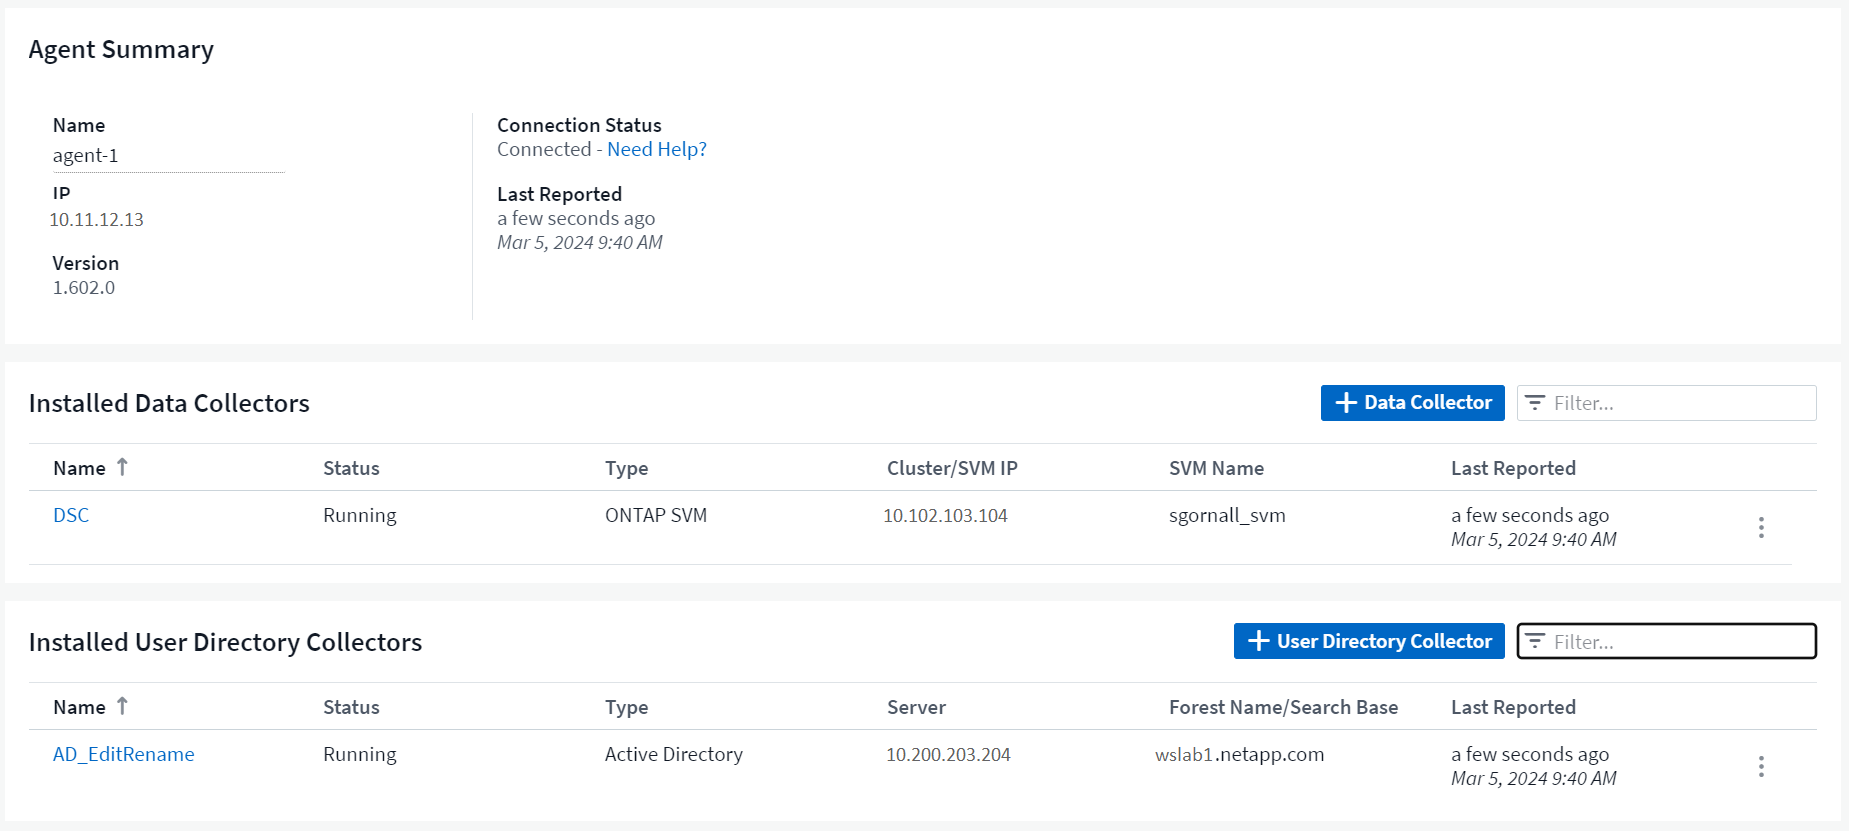
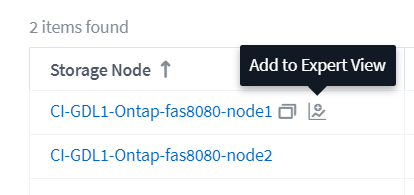
Chart more data more quickly
When analyzing data on an asset's landing page, adding additional data to the Expert View charts is a snap. For each table on the landing page, if an object type has relevant data, hover over that object to display the "Add to Expert View" icon. Selecting this icon adds that object to the Additional Resources and displays it in the Expert View charts.
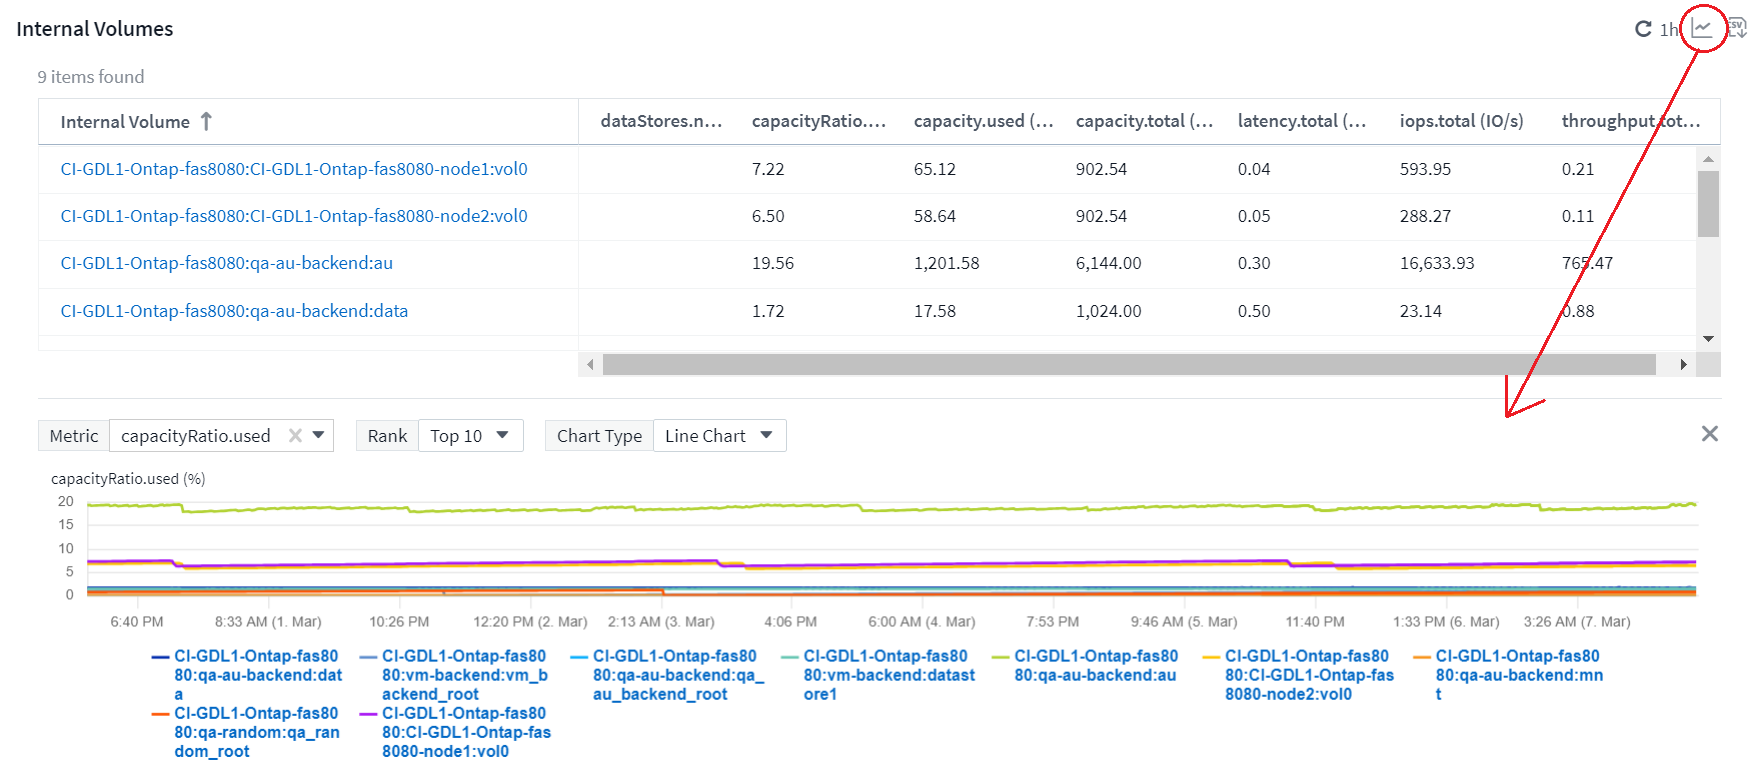
Or maybe you want to see a landing page table's data in its own chart. Simply select the Show Chart icon to open the chart below the table:
February 2024
Usability Improvements
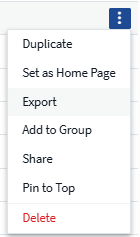
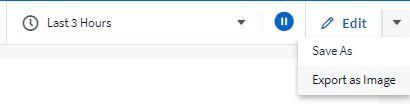
Save a snapshot of your current dashboard by selecting Export as Image from the right-corner drop-down. Cloud Insights creates a .PNG of the current widget states.
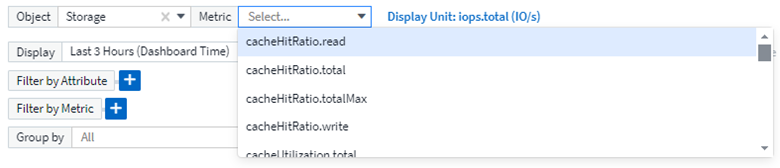
Object and Metric selection is easier than ever for Widgets, Monitors, etc. Choose the object type you want, and then select a metric relevant to that object in the separate drop-down.
Export Data Collector and Acquisition Unit lists to .CSV by selecting the icon at the top of those pages.

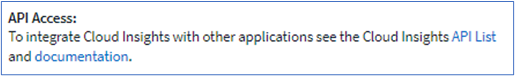
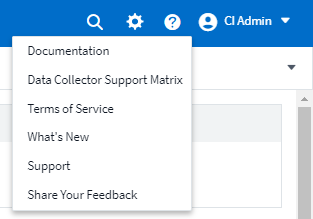
We’ve re-organized the Help > Support page so it’s easier to find what you’re looking for, and because you asked for them, we added direct links on this page to API Swagger and user documentation.
Links in the “triggeredOn” column on the Alerts list page will navigate to the appropriate Landing Page, if a Landing Page is available for that object.

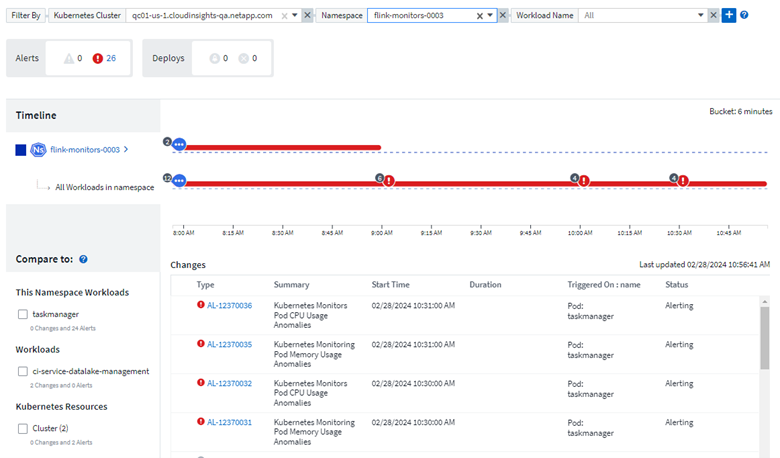
See all changes in your namespace
Kubernetes Change Analysis now allows you to see a timeline of changes when selecting Cluster and Namespace. Previously, Workload must also have been selected. When filtering on Cluster and Namespace, the timeline of all workload changes in that namespace are shown on one line.
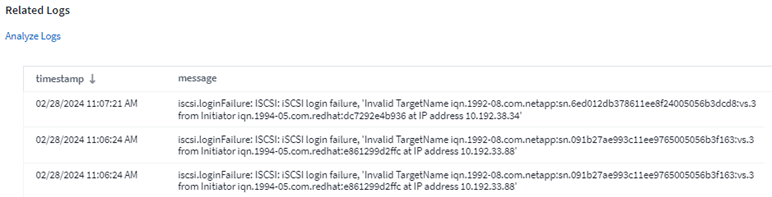
Related Logs for Alerts
When viewing a log alert, related log entries are shown in a new table. A log entry is related if it occurs in the same source and timeframe as the alert, and is subject to the same conditions. Select “Analyze Logs” to explore further.
Collect ONTAP Switch Data
Cloud Insights can collect data from the ONTAP system’s back-end switches; simply enable the collection in the data collector’s Advanced Configuration section, and ensure the ONTAP system is configured to provide switch information and has the appropriate permissions set.
Workload Security Data Collector API
In large environments, you can automate Workload Security collector creation using the new Data Collectors API. Navigate to Admin > API Access > API Documentation and select the Workload Security API type to learn more.
January 2024
Try Cloud Insights Features you haven’t used yet
In addition to your initial trial of Cloud Insights, you may also take advantage of Module Evaluations. For example, if you are subscribed to Cloud Insights and have been monitoring storage and virtual machines, when you add Kubernetes to your environment, you will automatically enter into a 30-day trial of Kubernetes Observability. Kubernetes Observability managed unit usage will not count against your subscribed entitlement until after the trial period ends.
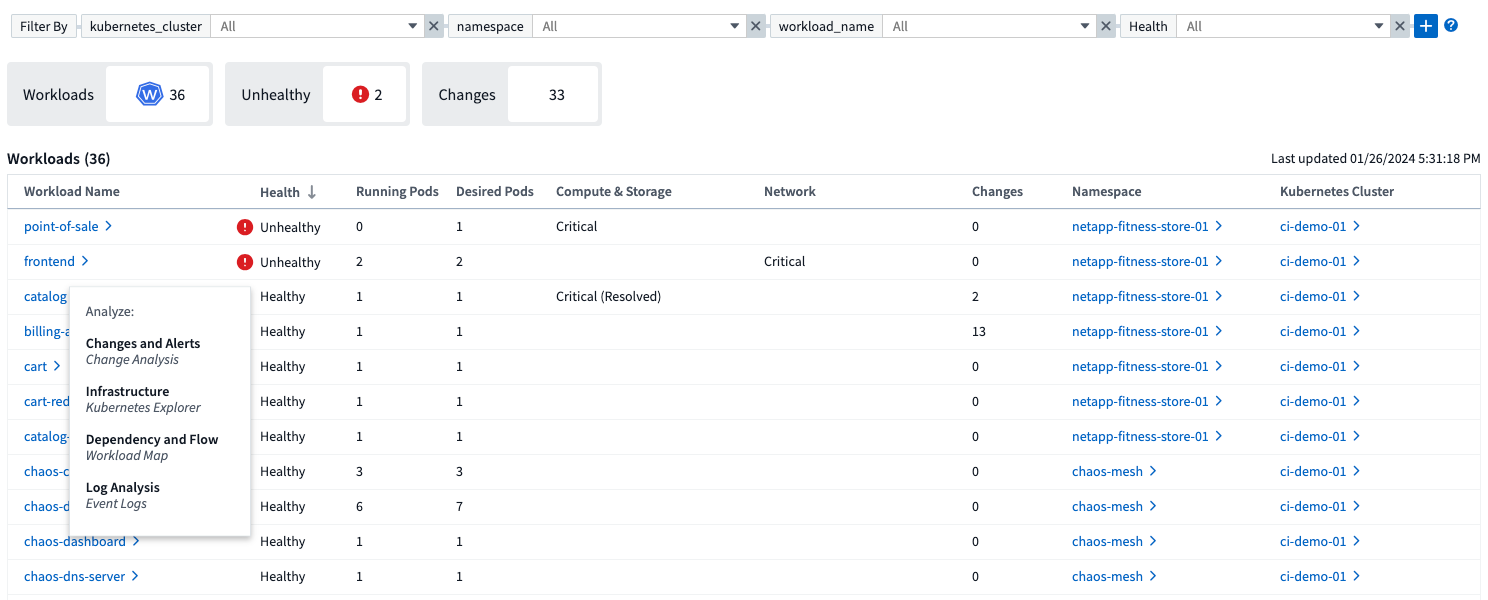
How healthy are my workloads?
Workload health is available at a glance on the Kubernetes > Explore > Workloads page, so you can quickly see which workloads are performing well and which may need some help. Easily identify if the health issue is related to infrastructure, network, or configuration changes, and drill down to analyze the root cause.
Data Collector Updates
Data Domain Identification
The Data Domain collector has been improved to better identify HA systems for durability across failover events This change will cause a one time re-identification of Data Domain appliances in HA systems, which will subsequently cause any annotations on those assets to be removed (because these arrays will be re-identified). You will need to re-attach annotations to your Data Domain objects.
Enhanced Ransomware Detection ML Algorithm
Workload Security includes a new 2nd-generation ransomware detection ML algorithm to detect the most sophisticated attacks faster and more accurately.
"Seasonality" of behaviors: weekend behavior may follow different patterns from weekday, or morning behavior from afternoon. Workload Security algorithms take this seasonality into account.
Deprecated Functionality
Occasionally functionality is deprecated as features evolve. Here are some of the features and functionalities which have been deprecated in Cloud Insights:
Workload Secure REST cloudsecure_forensics.activities.v1 API is deprecated
The cloudsecure_forensics.activities.v1 API is deprecated. This API returns information on activities associated with entities in the Storage Workload Security environment. This API has been replaced with cloudsecure_forensics.activities.*v2*_.
GET for this API previously returned the following:
{
  "count": 24594,
  "limit": 1000,
  "offset": 0,
  "results": [
    {
      "accessLocation":
This API now returns:
{
  "limit": 1000,
  "meta": {
    "page": {
      "after": "lvlvk3pp.4cpzcg4kpybl",
      "before": "lvlxy3dz.4cq5ajdnl9fk",
      "size": 1000
    }
  },
  "results": [
    {
      "accessLocation": "10.249.6.220",
For more details see the Swagger documentation at “Admin > API Access > API Documentation > Workload Security”.
December 2023
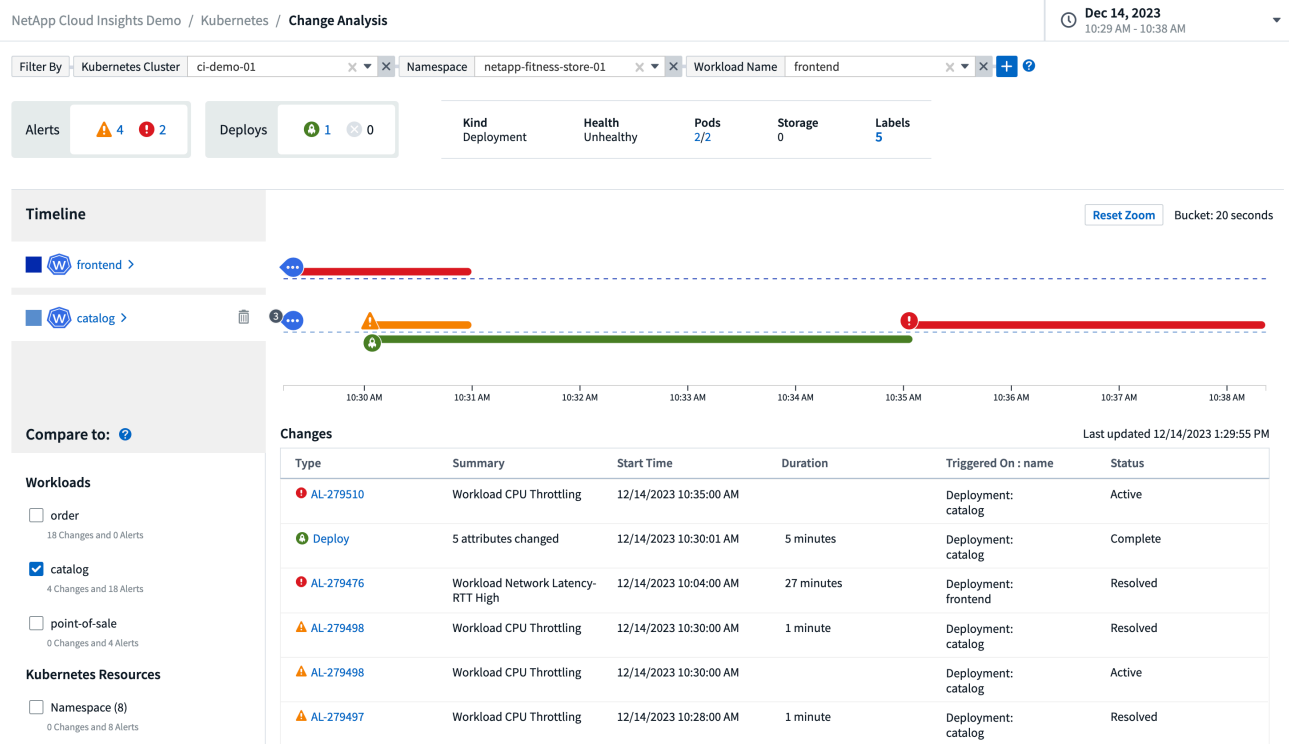
Change Analytics at a glance
Kubernetes Change Analytics provide you with an all-in-one view of recent changes to your Kubernetes environment. Alerts and deployment status are at your fingertips. With Change Analytics, you can track every deployment and configuration change, and correlate it with the health and performance of K8s services, infrastructure, and clusters.
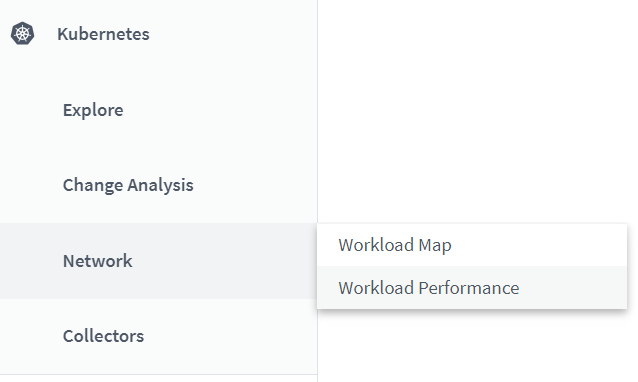
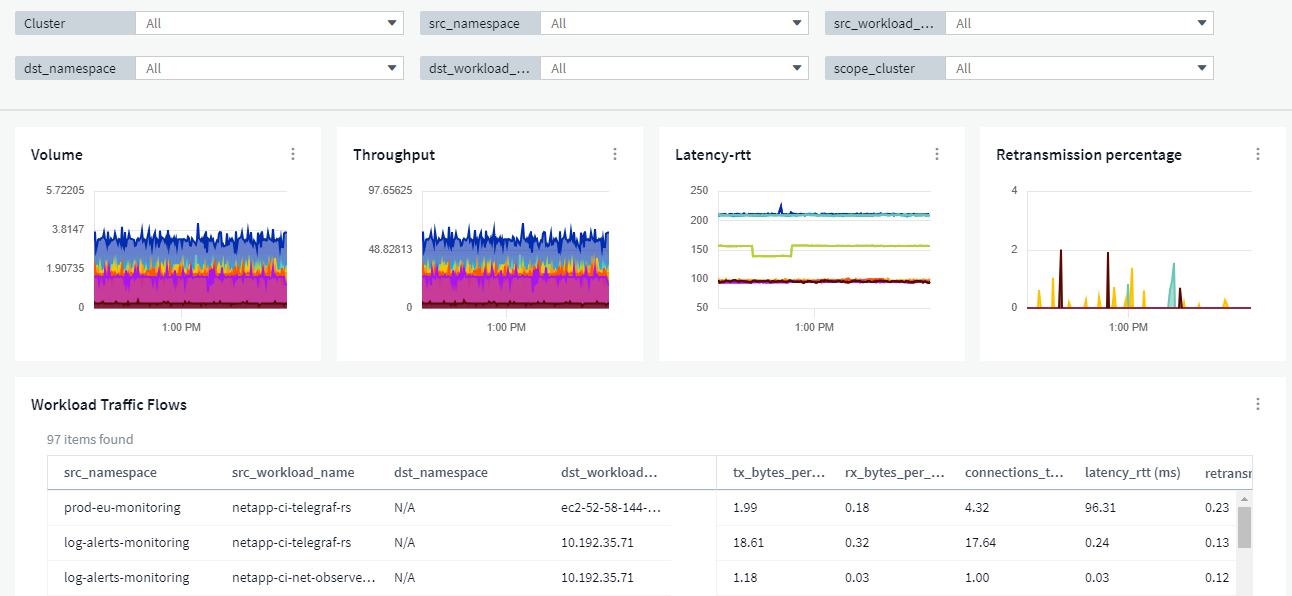
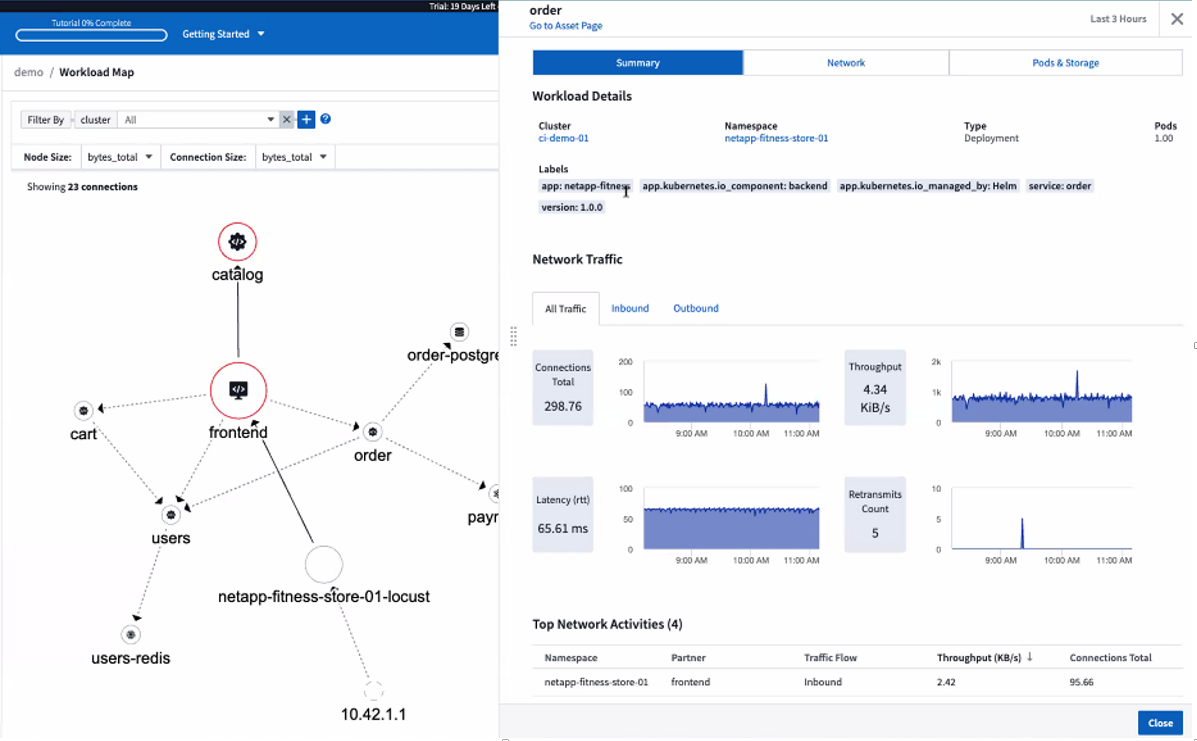
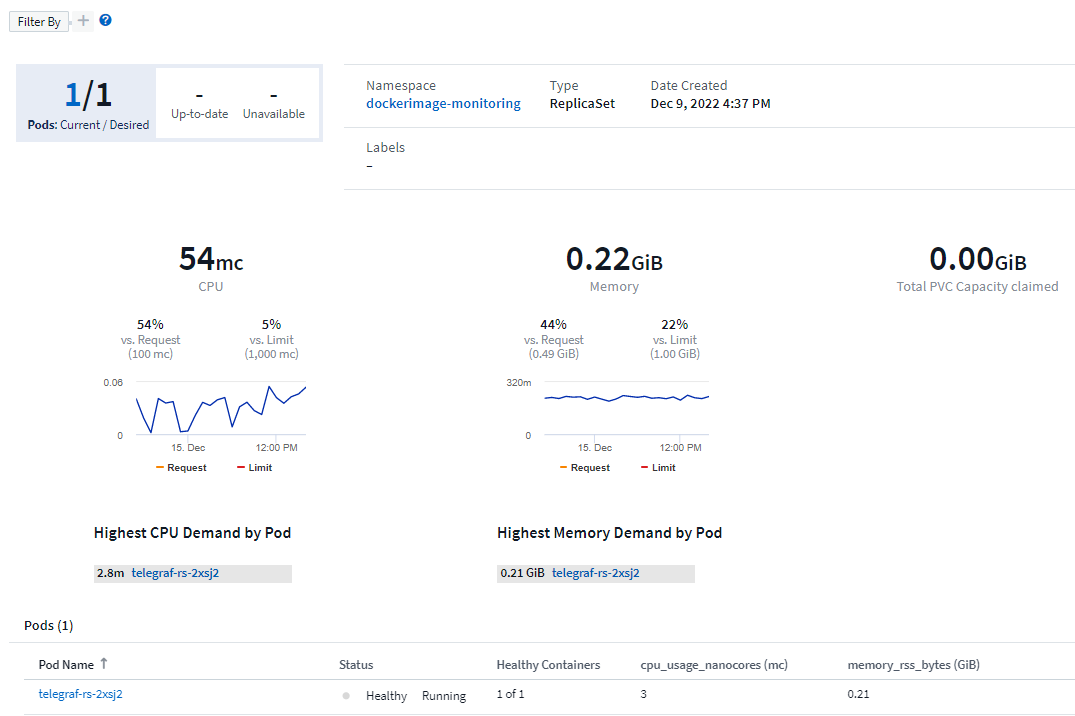
Kubernetes Workload Performance Dashboard
Workload performance is available at a glance in the comprehensive Kubernetes Workload Performance dashboard. Quickly view graphs of Volume, Throughput, Latency, and Retransmission trends, as well as a table of workload traffic for each namespace in your environment. Filters allow easy focus into areas of interest.
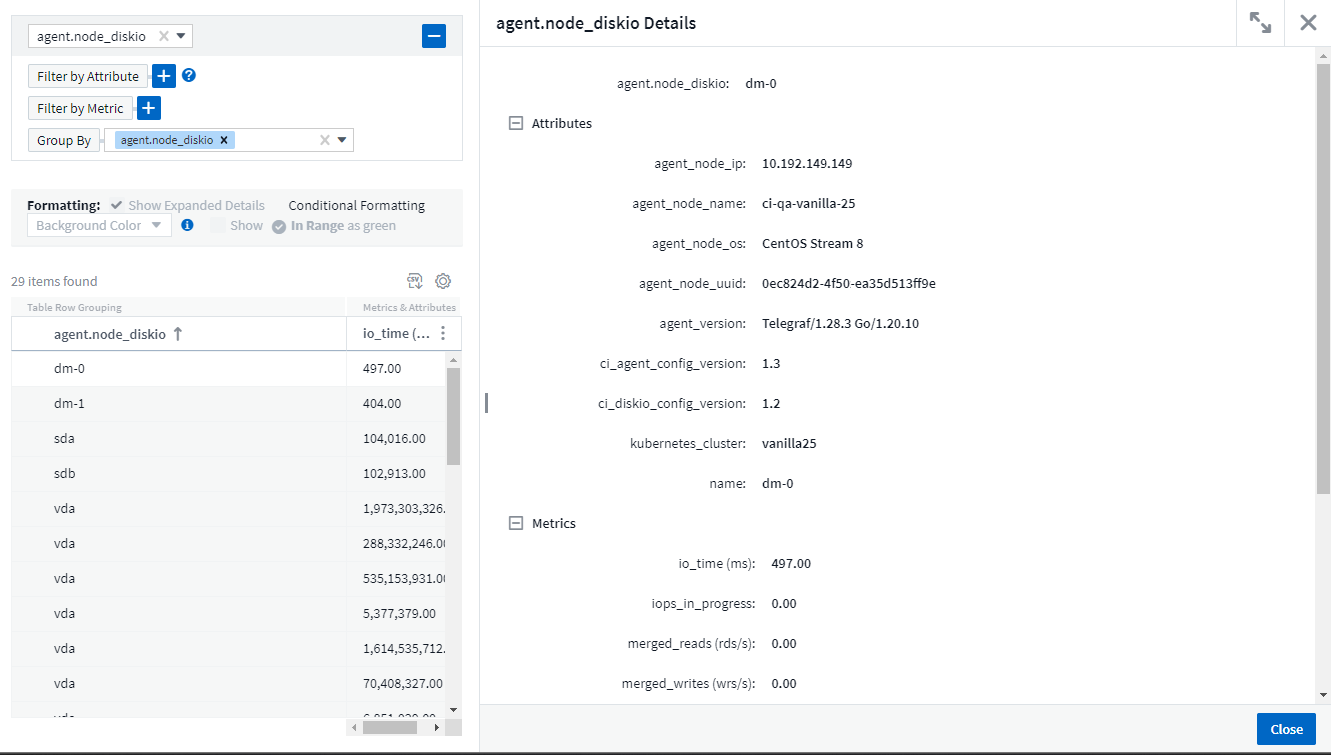
Query Details on one screen
In a query, selecting a row opens a side panel showing attribute, annotation, and metric details for the selected row, providing helpful information without needing to drill into the object's landing page. Links in the row or side panel allow for easy navigation.
Data Collector updates:
-
Brocade FOS REST: This collector is moved out of "Preview" and is now generally available. Some things to note:
-
FOS introduced their REST API with FOS 8.2. But some features like routing only received REST API capabilities with 9.0.
-
If you have a fabric consisting of mixed FOS assets 8.2 higher, as well as some < 8.2, the Cloud Insights FOS REST collector will fail to discover those older assets. You can edit the FOS REST collector and build a comma-delimited list of the IPv4 address of those devices for exclusion from that collector.
-
-
SELinux: Cloud Insights includes enhancements to the Linux Acquisition Unit initial installation to ensure robustness of operation within Linux environments with SELinux enforcement enabled. These enhancements only impact new AU deployments; if you have any SELinux issues relating to AU upgrades, contact NetApp Support to remediate your SELinux configuration.
November 2023
Workload Security: Pause/Resume a Collector
In Workload Security, you can Pause a Data Collector if the collector is in Running state. Open the "three dots" menu for the collector and select PAUSE. While the collector is paused, no data is gathered from ONTAP, and no data is sent from the collector to ONTAP. Select Resume to begin collecting again.
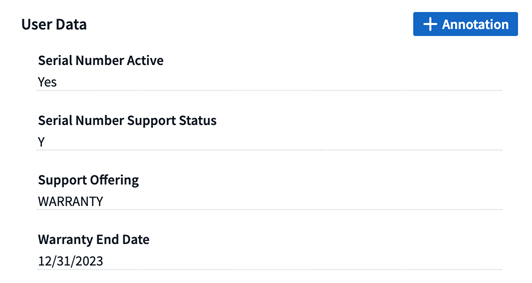
Storage Node Support Information
On a storage node landing page, the User Data section provides at-a-glance information about your support offering, current status, support status, and warranty end date. Note that Cloud Insights currently only auto-publishes this information for NetApp devices. Note also that these support fields are annotations, so they can be used in queries and dashboards.
Map VMWare tags to Cloud Insights annotations
The VMWare data collector allows you to populate Cloud Insights text annotations with same-name tags that are configured on VMWare.
Brocade CLI collector reliability enhancements for FOS 9.1.1c and higher firmware
On some Brocade Fibre Channel switches running 9.1.1c firmware, certain CLI commands’ output may be prepended with the “motd” login banner text, or warnings for users to change default passwords. The Brocade CLI collector has been enhanced to ignore these two types of extraneous text.
Prior to this enhancement, only FOS 9.1.1c switches without Virtual Fabrics present were likely discoverable with this collector type.
October 2023
Enhanced Workload Security
Workload Security has been improved with the following:
-
Access Denied: Workload Security integrates with ONTAP to receive "Access Denied" events and provide an additional analytics and automatic responses layer.
-
Allowed File Types: If a ransomware attack is detected for a known file extension, that file extension can be added to an allowed file types list to prevent unnecessary alerting.
Module Trials
In addition to your initial trial of Cloud Insights, you may also take advantage of Module Evaluations. For example, if you are already subscribed to Infrastructure Observability but are adding Kubernetes to your environment, you will automatically enter into a 30-day trial of Kubernetes Observability. You will only be charged for your Kubernetes Observability managed unit usage at the end of the evaluation period.
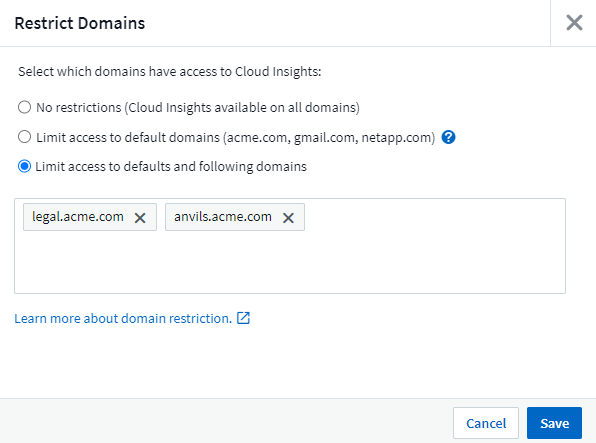
Restrict access to specified domains
Admins and Account Owners now have the ability to restrict Cloud Insights access to email domains they specify. Go to Admin > User Management and select the Restrict Domains button.
Data Collector Updates
The following Data Collector/Acquisition Unit changes are in place:
-
Isilon / PowerScale REST: Various new attributes and metrics have been added to Cloud Insights enhanced analytics capabilities under the emc_isilon.node_pool.* name. These counters and attributes will empower users to build dashboards and monitors for node_pool capacity consumption; users with Isilon clusters built from dissimilar hardware node models will have multiple node pools, and understanding your HDD/SSD/total capacity consumption at a node pool level is useful for both monitoring and planning.
-
Rubrik “Service account” authentication support: Cloud Insights' Rubrik collector now supports both traditional HTTP Basic Authentication (username and password), and Rubrik’s Service Account approach, which requires a username + secret + Organization ID.
September 2023
Easily Find What You Want in the Logs
Log Query (Observability > Log Queries > +New Log Query) includes a number of enhancements to make log exploration easier and more informative.
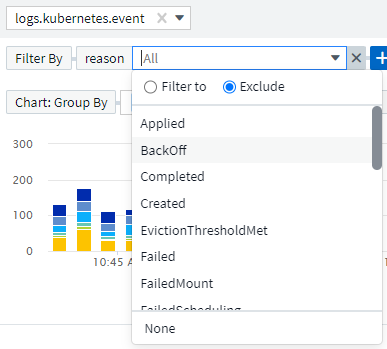
Include/Exclude
When filtering for a value, you can easily choose whether to Include or Exclude results matching the filter. Selecting "Exclude" creates a "NOT <value>" filter. You can combine Include and Exclude values in a single filter.
Advanced Query
Advanced Querying gives you the opportunity to create "free form" filters, combining or excluding values using AND, NOT, OR, wildcards, etc.
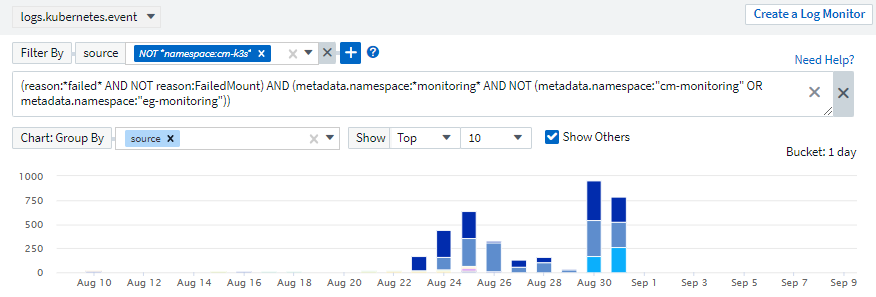
The "Filter By" and Advanced Query are "AND"ed together to form a single query. The results are displayed in the results list and the chart.
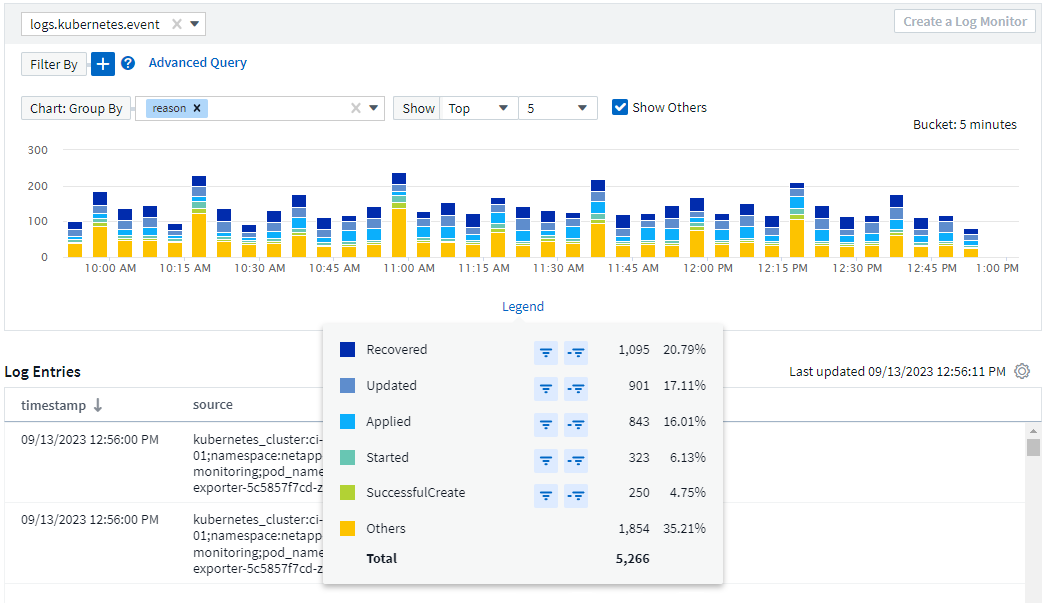
Grouping in the Chart
When you select a log attribute to Group By, the list and chart show the results of the current filter. In the chart, columns grouped into colors. Hovering over a column in the chart will display details about the specific entries, similar to the overall information shown when you expand the chart Legend. In the legend, you can also choose to set an Include or Exclude filter for a specific grouping.
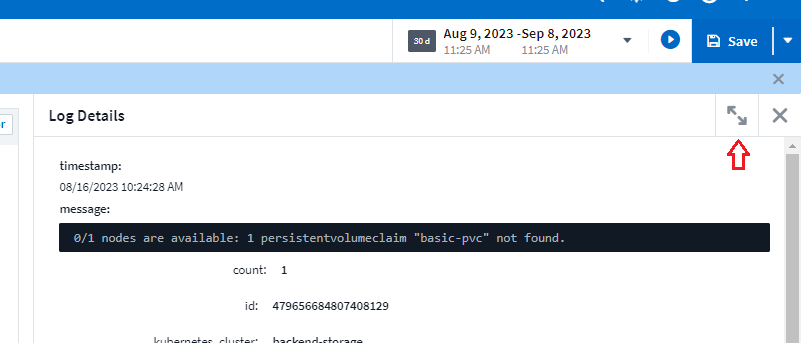
"Floating" Log Detail Panel
When exploring logs using the Log Query, selecting an entry in the list opens a detail panel for that entry. You can now choose to display that slideout panel "Floating" (i.e. displayed over the rest of the screen) or 'In Page" (i.e. displayed as its own frame within the page). To switch between these views, select the "In Page / Floating" button in the upper-right corner of the panel.
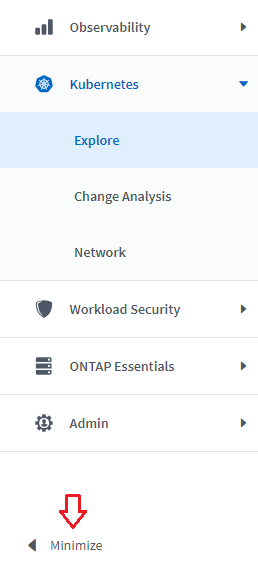
Collapse the Menu
You can collapse the left-side Cloud Insights navigation menu by selecting the "Minimize" button below the menu. While the menu is minimized, hover over an icon to see which section it opens; selecting the icon opens the menu and takes you directly to that section.
Data Collector Improvements
Cloud Insights has made it easier to show and find data collector information:
-
Processing of data collector lists is more efficient, which means the time it takes to display and navigate these lists is greatly reduced. If you have a large environment with many data collectors, you will see a significant improvement when listing your data collectors.
-
The Data Collector Support Matrix has moved from a .PDF file to an .HTML-based page, quicker to navigate and easier to maintain. Check out the new Matrix here: https://docs.netapp.com/us-en/cloudinsights/reference_data_collector_support_matrix.html
August 2023
Collecting Isilon/PowerScale Logs and Advanced Analytics Data
The Isilon REST and PowerScale REST collectors contain the following improvements:
-
Isilon log events are available for use in queries and alerts
-
Isilon Advanced Analytic attributes are available for use in queries, dashboards, and alerts:
-
emc_isilon.cluster
-
emc_isilon.node
-
emc_isilon.node_disk
-
emc_isilon.net_iface
-
These are enabled by default for users of the Isilon REST and/or PowerScale REST collectors. NetApp strongly encourages users of the Isilon CLI-based collector to migrate to the new REST API-based collector to receive enhancements such as the above.
Improved Workload Map
The workload map is more usable and less noisy; it groups all similar external services into one node if they communicate with the same workloads, reducing the complexity of the graph and making it easier to understand how services are interconnected.
Choosing a grouped node will display a detailed table with the network traffic metrics for each external service relevant to that node.
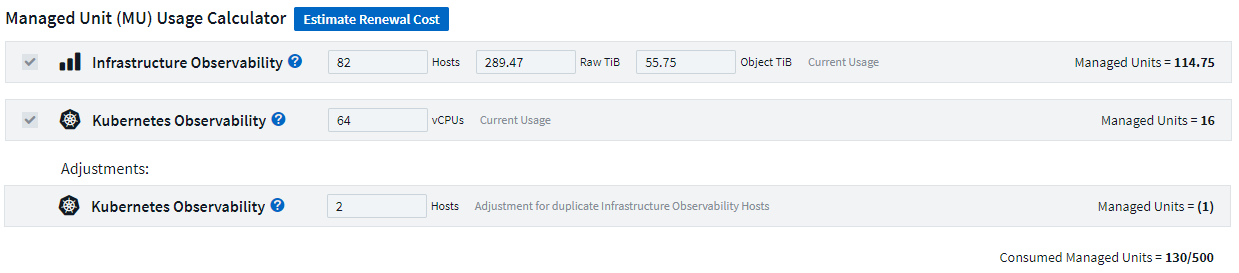
Kubernetes Managed Unit usage adjustment
In the event of a compute resource in your Kubernetes cluster environment being counted by both the NetApp Kubernetes Monitoring Operator and an underlying infrastructure data collector (for example, VMware), your usage of these resources will be adjusted to ensure the most efficient counting of managed units. You can view the Kubernetes MU adjustments on the Admin > Subscription page, in both the Summary and Usage tabs.
Summary tab:
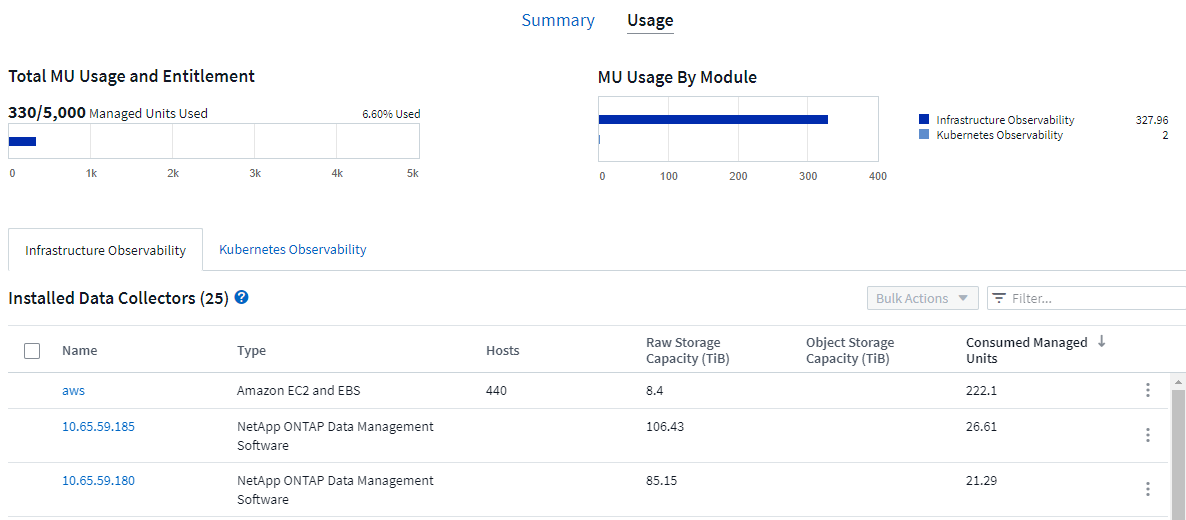
Usage tab:
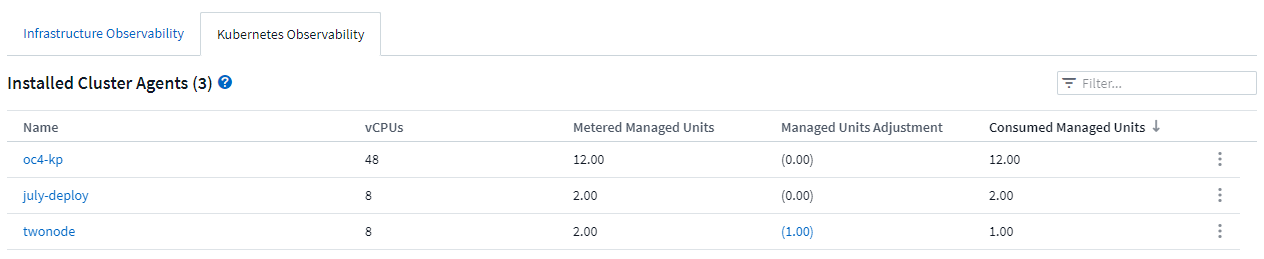
Collector/Acquisition changes:
The following Data Collector/Acquisition Unit changes are in place:
-
Acquisition Units now support RHEL 8.7.
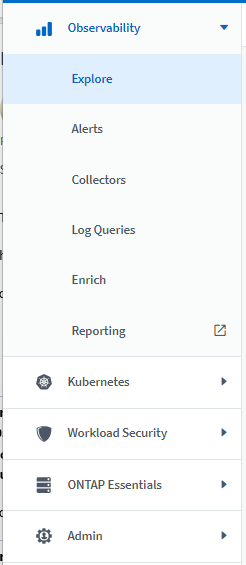
Improved Menus
We have updated the left hand navigation menu to better support our customers' workflows. New top level items such as Kubernetes provide accelerated access to what the customer needs, and a consolidated administrators console supports the tenant owner role.
Here are some additional examples of the changes:
-
The top level Observability menu showcases data discovery, alerting and log queries
-
‘API Access’ functionality for Observability and Workload Security are under one menu
-
Likewise for Observability and Workload Security ‘Notifications’ functionality, also now under one menu
Here is a brief list of the features you can find under each menu:
Observability:
-
Explore (Dashboards, Metric Queries, Infrastructure Insights)
-
Alerts (Monitors and Alerting)
-
Collectors (Data Collectors and Acquisition Units)
-
Log Queries
-
Enrich (Annotations and Annotation Rules, Applications, Device Resolution)
-
Reporting
Kubernetes:
-
Cluster Exploration and Network Map
Workload Security:
-
Alerts
-
Forensics
-
Collectors
-
Policies
ONTAP Essentials:
-
Data Protection
-
Security
-
Alerts
-
Infrastructure
-
Networking
-
Workloads
*VMware
Admin:
-
API Access
-
Auditing
-
Notifications
-
Subscription Information
-
User Management
July 2023
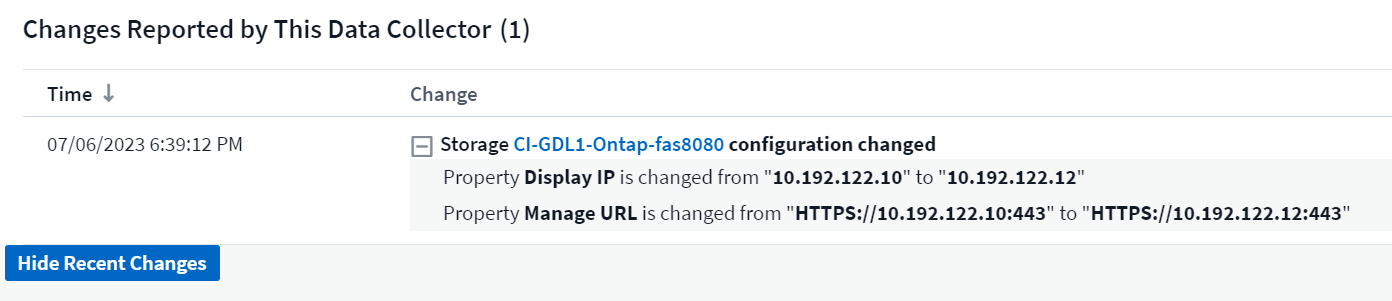
Show Recent Changes
Data Collector landing pages now include a list of recent changes. Simply click the "Recent Changes" button at the bottom of any data collector landing page to display recent data collector changes.
Operator Improvements
The following improvements have been made to Kubernetes Operator deployment:
-
Option to bypass docker metric collection
-
Ability to add and customize tolerations to telegraf Daemonsets and Replicasets
Insight: Reclaim Cold Storage
The Reclaim ONTAP Cold Storage Insight now supports FlexGroups, and is now available to all customers.
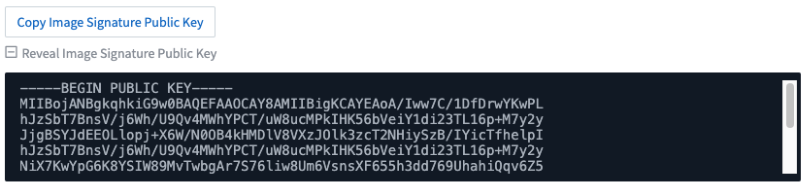
Operator Image Signature
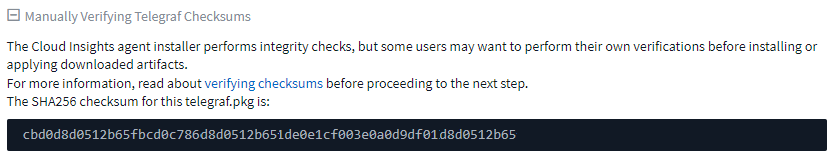
For customers who use a private repository for their NetApp Kubernetes Monitoring Operator, you can now copy the Image Signature Public Key during Operator installation, allowing you to confirm authenticity of the downloaded software. Select the Copy Image Signature Public Key button during the optional step to Upload the operator image to your private repository.
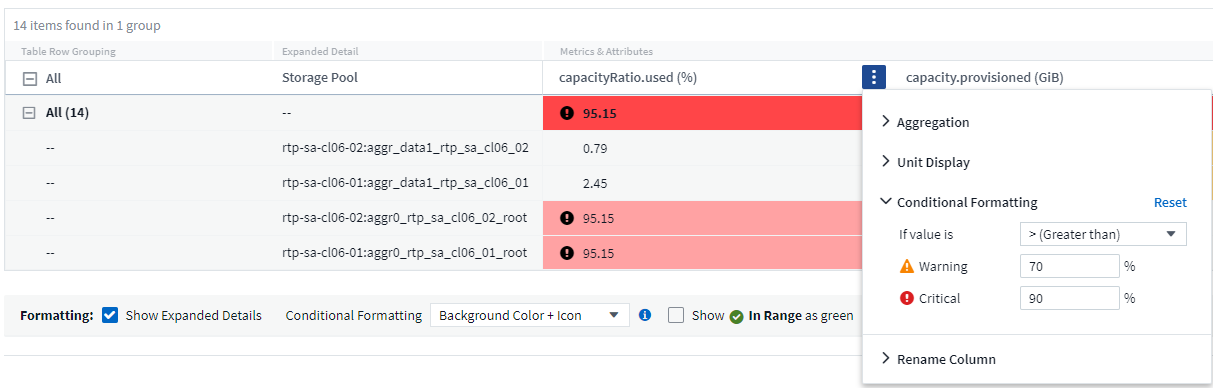
Aggregation, Conditional Formatting, and more for Queries
Aggregation, Unit Selection, Conditional Formatting, and Column Renaming are among the most useful features of a dashboard table widget, and now those same features are available for Queries.

These features are available now for integration-type data (Kubernetes, ONTAP Advanced Metrics, etc.), and will be coming soon for Infrastructure objects (storage, volume, switch, etc.).
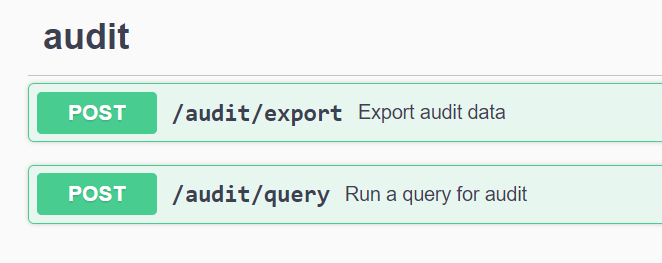
API for Audit
You can now use an API to query or export Audited events. Go to Admin > API Access and select the API Documentation link for information.
Data Collector: Trident Economy
Cloud Insights now supports the Trident Economy Driver, realizing these benefits:
-
Get visibility into pod-to-ONTAP Qtree mapping and performance metrics.
-
Provide seamless troubleshooting and easy navigation from Kubernetes pods to backend storage
-
Proactively detect backend performance issues with monitors
June 2023
Check out your Usage
Beginning in June, 2023, Cloud Insights provides a breakdown of Managed Unit usage based on Feature Set. Now you can quickly view and monitor managed unit (MU) usage for your Infrastructure as well as MU usage tied to Kubernetes.
Kubernetes Network Monitoring and Map is available for all
The Kubernetes Network Performance and Map simplifies troubleshooting by mapping dependencies between Kubernetes workloads, providing real-time visibility into Kubernetes network performance latencies and anomalies to identify performance issues before they affect users. Many customers found it helpful during Preview, and now it's available for everyone to enjoy.
Collector/Acquisition changes:
The following Data Collector/Acquisition Unit changes are in place:
-
Data Domain and Cohesity MUs are metered at 40 TiB : 1 MU.
-
Acquisition Units now support RHEL and Rocky 9.0 and 9.1.
New ONTAP Essentials dashboards
The following ONTAP Essentials dashboards have been available in Preview environments, and now they are available for everyone:
-
Security Dashboard
-
Data Protection Dashboard (includes Local and Remote Protection overviews)
Additional System Monitors
The following System Monitors are included with Cloud Insights:
-
Storage VM FCP Service Unavailable
-
Storage VM iSCSI Service Unavailable
May 2023
Improved Kubernetes Monitoring Operator Installation
Installation and configuration of the NetApp Kubernetes Monitoring Operator is easier than ever with the following improvements:
-
Environment configuration settings are held in a single, self-documented config file.
-
Step-by step instructions for uploading Kubernetes Monitoring Operator images to your private repository.
-
Simple to upgrade with a single command to upgrade your Kubernetes Monitoring while keeping custom configurations.
-
More secured: API keys are securely managing secrets.
-
Easy to integrate and deploy with your CI/CD automation tools.
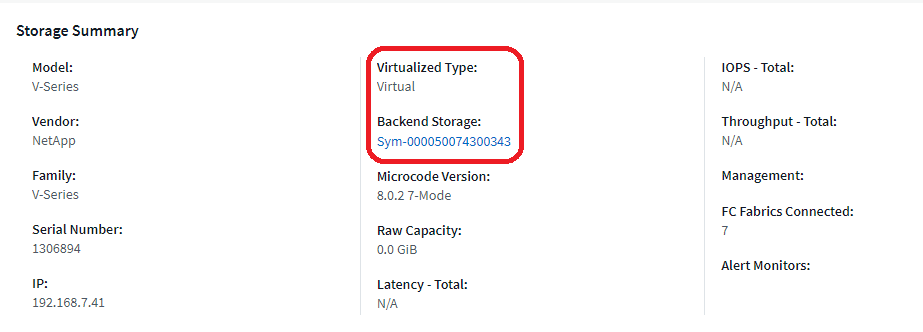
Storage Virtualization
Cloud Insights can differentiate between a storage array having local storage or virtualization of other storage arrays. This gives you the ability to relate cost and distinguish performance from the front-end all the way to the back-end of your infrastructure.
New Webhook Parameters
When creating a Webhook notification, you can now include these parameters in your webhook definition:
-
%%TriggeredOnKeys%%
-
%%TriggeredOnValues%%
Reporting on Kubernetes data
Kubernetes data collected by Cloud Insights—including Persistent Volumes (PV), PVC, Workloads, Clusters, and Namespaces—is now available for use in Reporting, enabling chargeback, trending, forecasting, TTF calculations, and other business reporting on metrics for Kubernetes.
Default ONTAP System Monitors Enabled for New Customers
Many ONTAP System Monitors are enabled (i.e. Resumed) by default in new Cloud Insights environments. Previously, most monitors defaulted to Paused state. Because business needs vary from company to company, we always recommend taking a look at the system monitors in your environment and pausing or resuming each based on your alerting needs.
April 2023
Kubernetes Performance Monitoring and Map
The Kubernetes Network Performance and Map feature simplifies troubleshooting by mapping dependencies between Kubernetes workloads. It provides real-time visibility into Kubernetes network performance latencies and anomalies to identify performance issues before they affect users.
This capability helps organizations reduce overall costs by analyzing and auditing Kubernetes traffic flows.
Key Features:
• The Workload Map presents Kubernetes workload dependencies and flows and highlights network and performance issues.
• Monitor network traffic between Kubernetes pods, workloads, and nodes; identifies the source of traffic and latency problems.
• Reduce overall costs by analyzing ingress, egress, cross-region, and cross-zone network traffic.
Workload Map showing "Slideout" details:
Kubernetes Performance Monitoring and Map is available as a Preview feature.
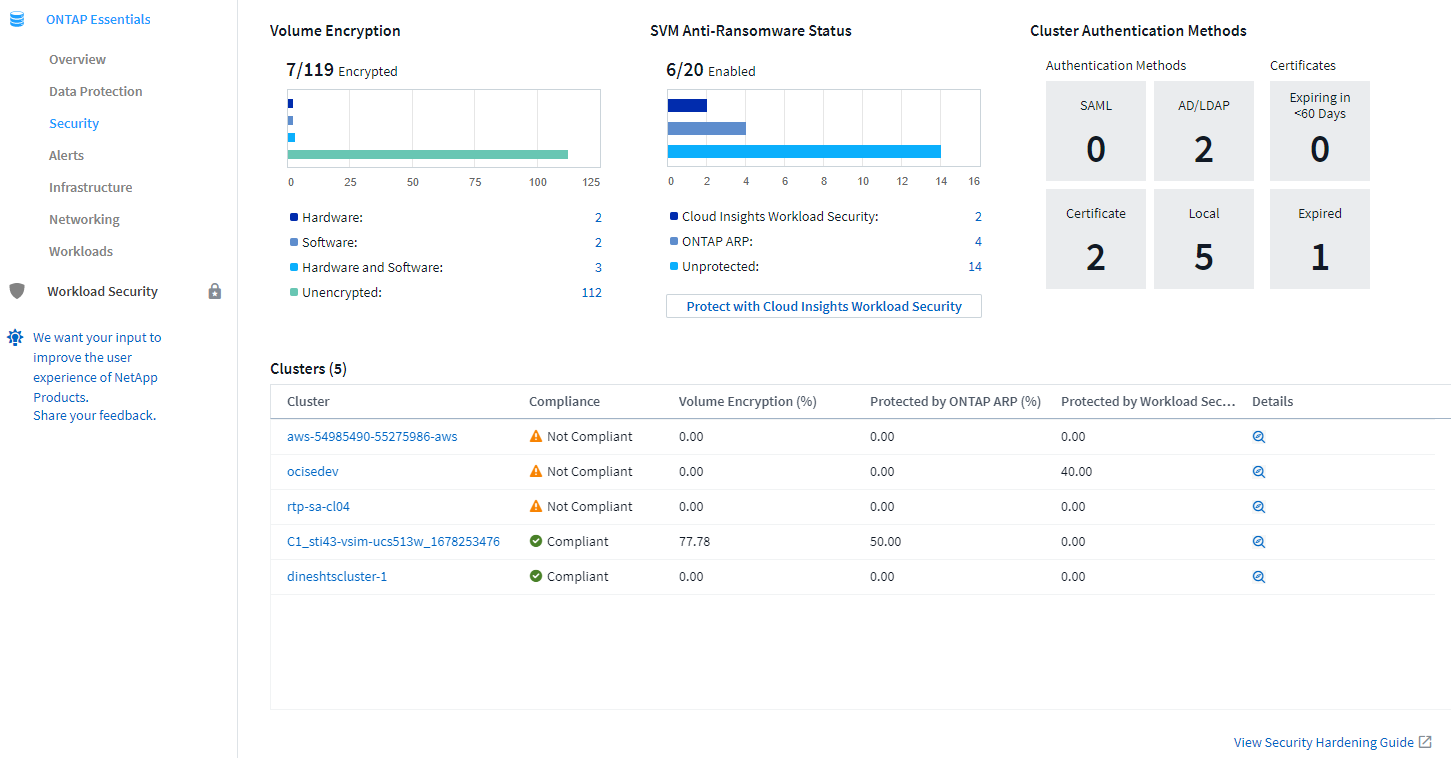
ONTAP Essentials Security Dashboard
The Security Dashboard gives you an instant view of your current security situation, showing charts for hardware and software volume encryption, anti-ransomware status, and cluster authentication methods. The Security Dashboard is available as a Preview feature.
Reclaim ONTAP Cold Storage
The Reclaim ONTAP Cold Storage Insight provides data about cold capacity, potential cost/power savings, and recommended action items for volumes on ONTAP systems.
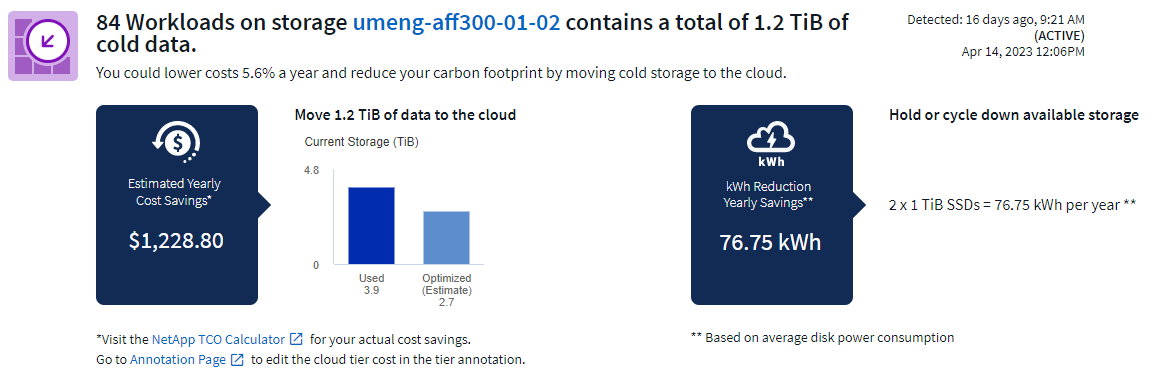
With this Insight, you can answer such questions as:
-
What amount of cold data on a storage cluster are sitting on (a) high-cost SSD disks, (b) HDD disks, and (c) virtual disks?
-
What workloads are the highest contributors in regards of the non-optimized storage?
-
What is the duration (in days) the data has been cold on a given workload?
Reclaim ONTAP Cold Storage is considered a Preview feature and is therefore subject to change.
Subscription Notification also controls banner messages
Setting recipients for Subscription Notifications (Admin > Notifications) now also controls who will see subscription-related in-product banner notifications.

Reporting has a new look
You will notice that Cloud Insights Reporting screens have a new look, and that some of the menu navigation have changed. These screens and navigation changes have been updated in the current Reporting Documentation.
Monitors Paused by Default
For new Cloud Insights environments, be aware that system-defined monitors do not send alert notifications by default. You will need to enable notifications for any monitor that you want alerting you, by adding one or more delivery methods for the monitor.
For existing Cloud Insights environments, the default global notification recipient list has been removed for any system-defined monitors currently in Paused state. User-defined notifications remain unchanged, as do notification settings for currently active system-defined monitors.
Looking for the API Metering tab?
API Metering has moved from the Subscription page to the Admin > API Access page.
March 2023
Cloud Connection for ONTAP 9.9+ deprecated
The Cloud Connection for ONTAP 9.9+ data collector is being deprecated. Starting April 4, 2023, Cloud Connection data collectors in your environment will no longer collect data, and will instead present an error when polling. The Cloud Connection data collector will be removed altogether from Cloud Insights in a subsequent update.
Prior to April 4, 2023, it is mandatory to configure a new NetApp ONTAP Data Management Software data collector for any ONTAP systems currently collected by Cloud Connection.
January 2023
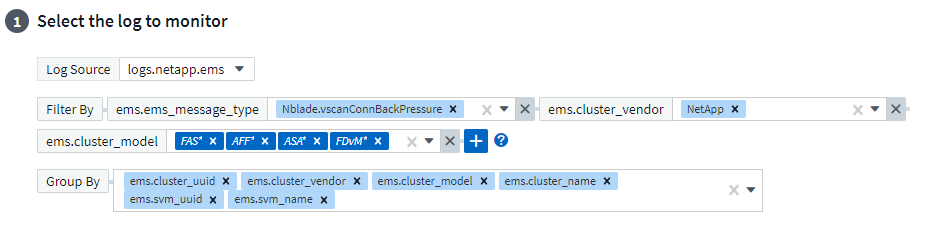
New Log Monitors
We've added almost two dozen additional system monitors to alert for broken interconnect links, heartbeat problems, and more. Additionally, three new Data Protection log monitors have been added, to alert on SnapMirror Auto Resync, MetroCluster Mirroring, and FabricPool Mirror Resync changes.
Note that some of these monitors will be enabled by default; you must pause them if you do not wish to alert on them. Also note that these monitors are not configured to deliver notifications; you must configure notification recipients on these monitors if you want to send alerts via email or webhook.
.CSV Export for all Dashboard Table Widgets
Ensuring accessibility to your data is essential, so we've made .CSV export available for all metric queries, dashboard table widgets, and object landing pages, regardless of the type of data (asset or integration) you're querying.
Data customizations like column selection, renaming columns, and unit conversions are also now included in the new export functionality.
December 2022
Explore Ransomware Protection and other security features during Cloud Insights Trial
Starting today, signing up for a new Trial of Cloud Insights allows you to explore Security features such as Ransomware detection and automated user-blocking response policy. If you haven't signed up for your Trial, do it today!
Kubernetes Workloads have their own landing page
Workloads are a key part of your Kubernetes environment, so Cloud Insights now provides landing pages for those workloads. From here, you can view, explore, and troubleshoot issues that affect your Kubernetes workloads.
Check your Checksums
You asked us to provide you with checksum values during installation of the agent for Windows and Linux and we think that's a great idea. So here they are:
Log Alerting Improvements
Group By
When creating or editing a Log Monitor, you can now set "Group By" attributes to allow for more focused alerting. Look for the "Group By" attributes below the "filter" settings in your monitor definition.
This change brings Metric Monitors and Log Monitors into feature parity by normalizing the “Group By” aspect of Monitor Definitions. This parity will allow customers to clone/duplicate all system-defined default Monitors for further customization.
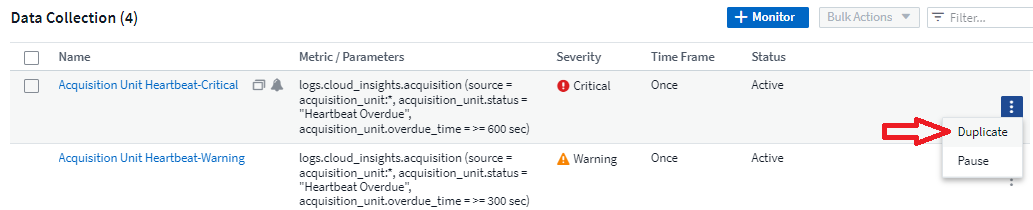
Duplicating
You can now clone (duplicate) the Change Log, Kubernetes Log, and Data Collector Log monitors. This creates a new custom log monitor that you can modify to your specific definitions.
11 New Default ONTAP Monitors covering SnapMirror for Business Continuity
We've added almost a dozen new system monitors for SnapMirror for Business Continuity (SMBC), which alert on changes to SMBC certificates and ONTAP Mediators.
November 2022
More than 40 new Security, Data Collection, and CVO monitors!
We've added dozens of new system-defined monitors to alert you to potential issues with Cloud Volumes, Security, and Data Protection. Read more about these monitors here.
October 2022
Better and more accurate Ransomware detection with ONTAP Autonomous Ransomware Protection integration
Cloud Secure improves ransomware detection through integration with ONTAP Autonomous Ransomware Protection (ARP).
Cloud Secure receives ONTAP ARP events on potential volume file encryption activity, and
-
Correlates volume encryption events with user activity to identify who is causing the damage,
-
Implements automatic response policies to block the attack,
-
Identifies which files were affected, helping to recover faster and conduct data breach investigations.
September 2022
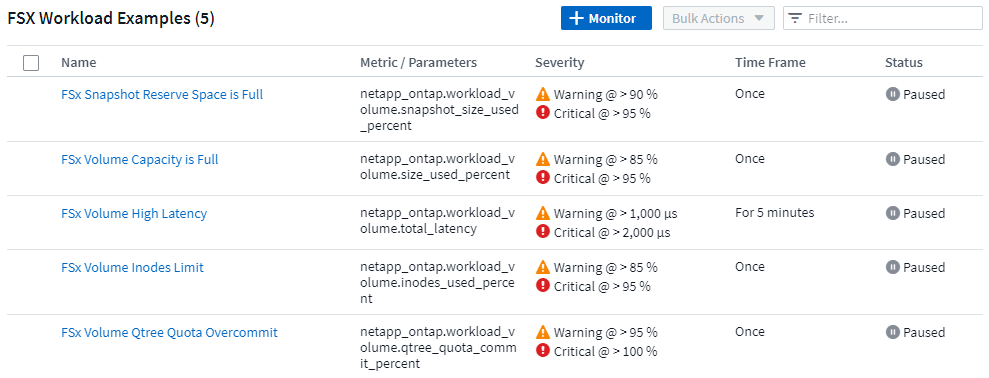
Monitors available in Basic Edition
ONTAP Default monitors now available to use in Cloud Insights Basic Edition. This includes more than 70 infrastructure monitors and 30 workload examples.
ONTAP Power and StorageGRID dashboards
The dashboard gallery includes a new dashboard for ONTAP Power and Temperature as well as four dashboards for StorageGRID. If your environment is collecting ONTAP power metrics and/or StorageGRID data, import these dashboards by selecting +From Gallery.
At-a-glance threshold visibility in tables
Conditional Formatting allows you to set and highlight Warning-level and Critical-level thresholds in table widgets, bringing instant visibility to outliers and exceptional data points.
Security Monitor
Cloud Insights can alert you when it detects that FIPS mode is disabled on the ONTAP system. Read more about System Monitors, and watch this space for more Security Monitors, coming soon!
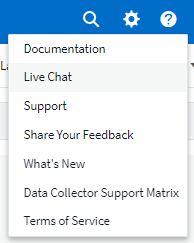
Chat from Anywhere
Chat with a NetApp Support specialist from any Cloud Insights screen by selecting the new Help > Live Chat link. Help is available from the "?" icon in the upper right of the screen.
New Data Collectors
-
Amazon S3 (available in Preview)
-
Brocade FOS 9.0.x
-
Dell/EMC PowerStore 3.0.0.0
Other Data Collector Updates
All data sources are now optimized to resume performance polling after Acquisition Unit updates and/or patches.
Operating System support
The following operating systems are supported with Cloud Insights Acquisition Units, in addition to those already supported:
-
Red Hat Enterprise Linux 8.5, 8.6
August 2022
Cloud Insights has a new look!
Starting this month, "Monitor and Optimize" has been renamed Observability. You'll find all your favorite features like Dashboards, Queries, Alerts, and Reporting here. In addition, look for Cloud Secure under the new Security menu. Note that only the menus have changed; feature functionality remains the same.
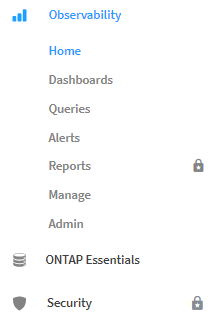
Looking for the Help menu?
Help now lives in the upper right of the screen.
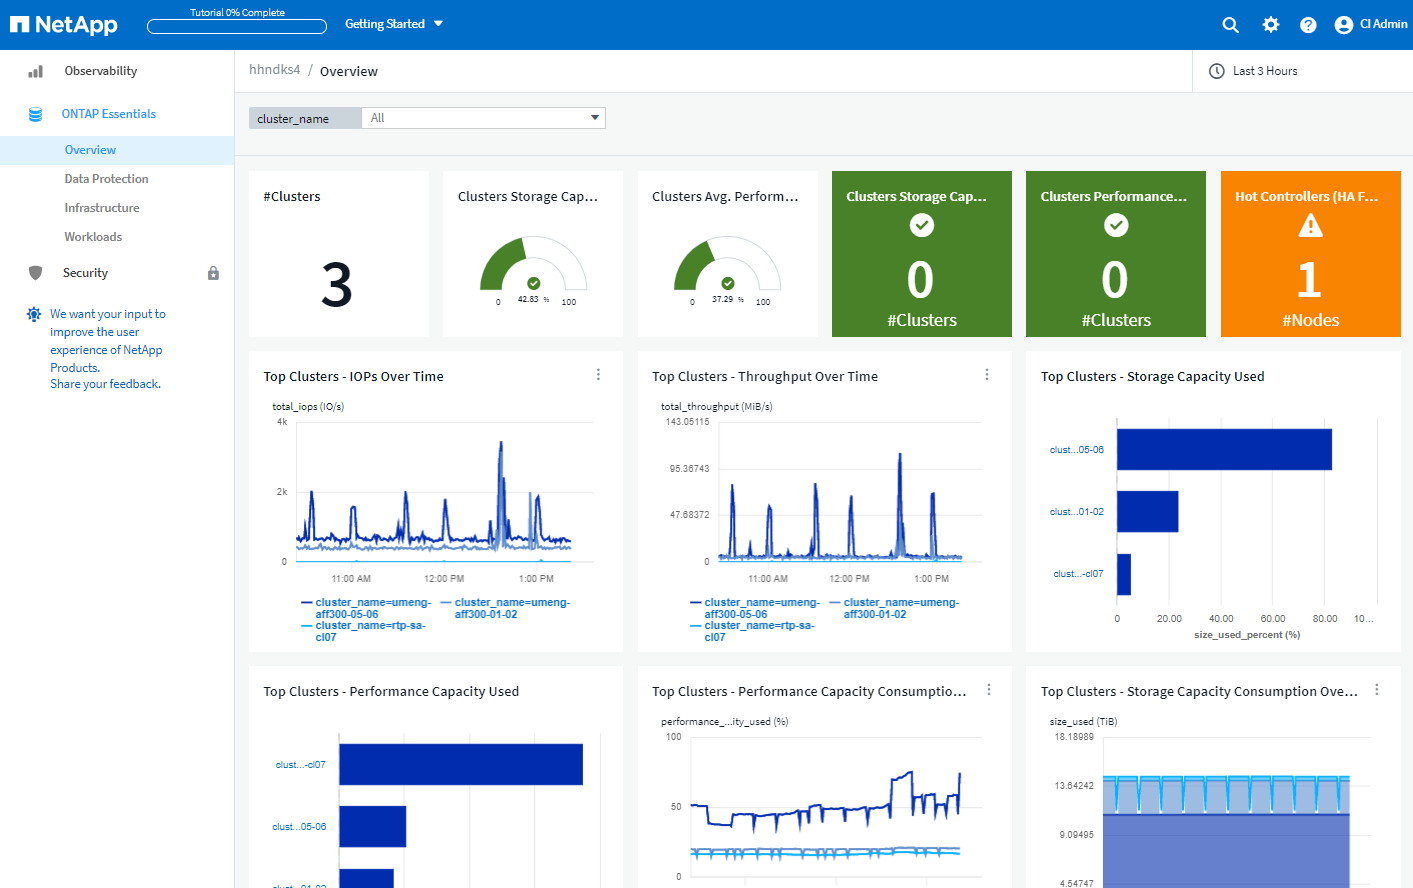
Not sure where to start? Check out ONTAP Essentials!
ONTAP Essentials is a set of dashboards and workflows that provide detailed views into your NetApp ONTAP inventories, workloads, and data protection, including days-to-full predictions for storage capacity and performance. You can even see if any controllers are running at high utilization. ONTAP Essentials is your ideal place for all of your NetApp ONTAP monitoring needs!
ONTAP Essentials—available in all Editions—is designed to be intuitive to existing ONTAP operators and administrators, easing the transition from ActiveIQ Unified Manager to service-based management tools.
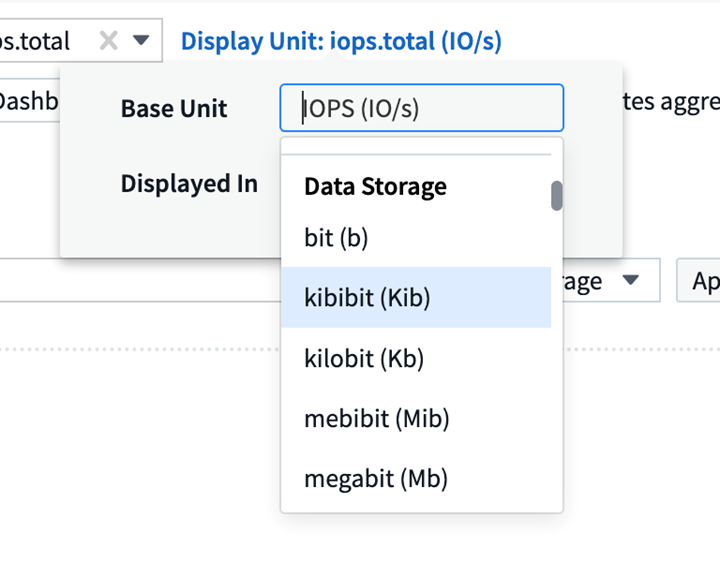
Storage Data families are merged
You asked for it, and now you've got it. Storage base-2 and base-10 data units are now combined into one family, from bits and bytes to tebibits and terabytes, making it easier to display data your way on your dashboards. Data Rates are also now one big family of their own.
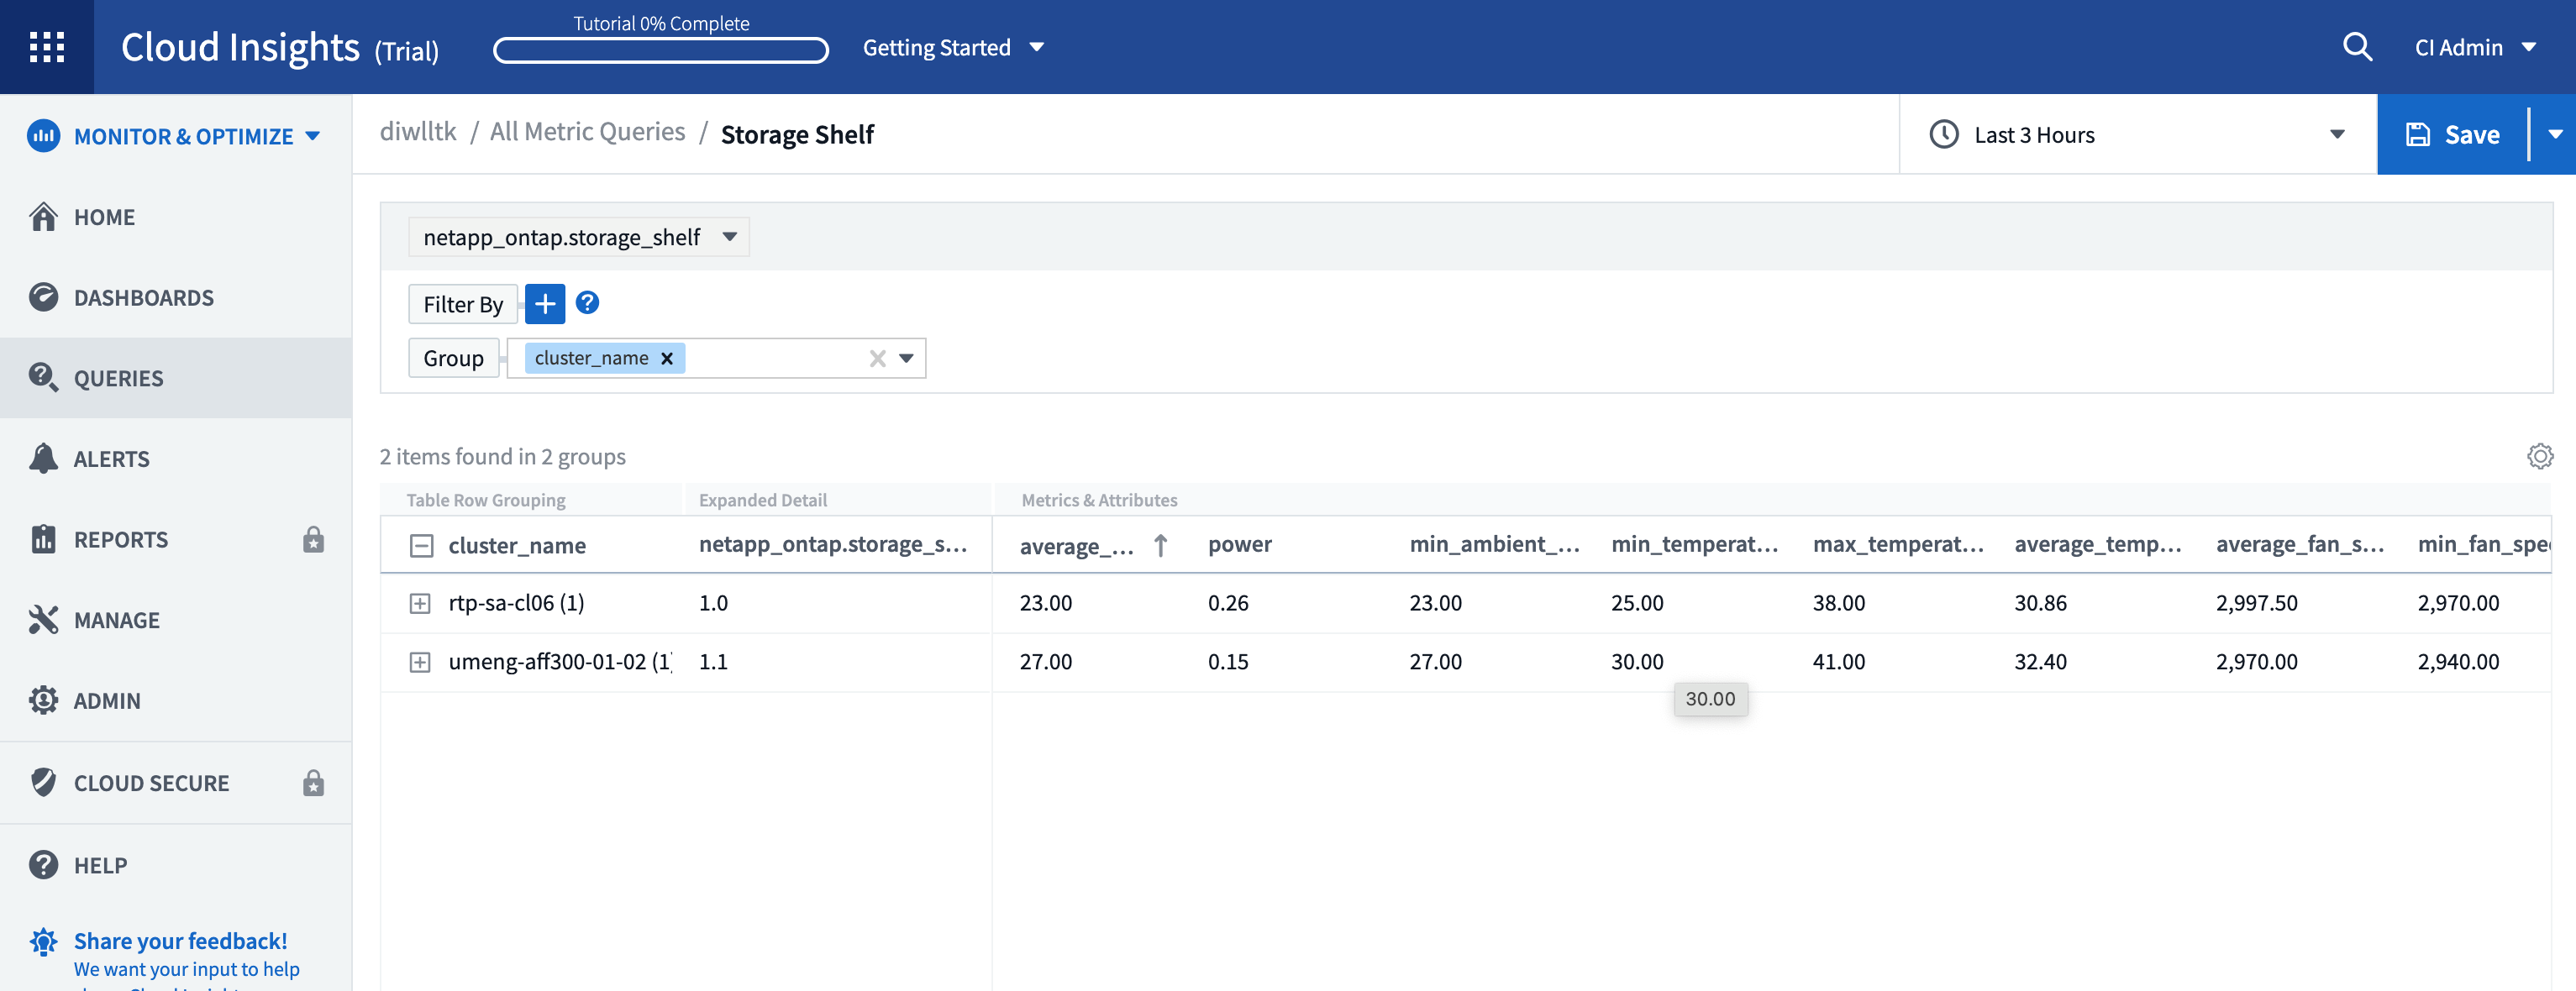
How much power is my storage using?
Display and monitor your ONTAP storage shelf and node power consumption, temperature, and fan speed, using the netapp_ontap.storage_shelf, netapp_ontap.system_node and netapp_ontap.cluster (power consumption only) metrics.
Features graduated from Preview
The following features have moved out of Preview and are now available to all customers:
Feature |
Description |
Kubernetes Namespaces Running out of Space |
The Kubernetes Namespaces Running Out of Space Insight gives you a view into workloads on your Kubernetes namespaces that are at risk of running out of space, with an estimate for the number of days remaining before each space becomes full. |
Shared Resource Under Stress |
The Shared Resource Under Stress insight uses AI/ML to automatically identify where resource contention is causing performance degradation in your environment, highlights any workloads impacted by it, and provides recommended actions to remediate, letting you solve performance issues more quickly. |
Cloud Secure – Block user access on attack |
Greater protection for your business-critical data with the ability to block user access when an attack is detected. |
How's my data collection health?
Cloud Insights provides two new heartbeat monitors for your Acquisition Units, as well as two monitors to alert you to data collector failures. These can be used to alert you quickly to data collection issues.
The following monitors are now available in the Data Collection monitor group:
-
Acquisition Unit Heartbeat-Critical
-
Acquisition Unit Heartbeat-Warning
-
Collector Failed
-
Collector Warning
Note that these monitors are in Paused state by default. Activate them to be alerted about data collection issues.
Auto-Renewing API Tokens
API Access Tokens can now be set for auto-renewal. By enabling this feature, new/refreshed API Access Tokens will automatically be generated for expiring tokens. Cloud Insights agents using an expiring token will automatically be updated to use the corresponding new/refreshed API Access Token, allowing them to continue to operate seamlessly. Simply check the “Renew token automatically” box when creating your token. This feature is currently supported on Cloud Insights agents running on the Kubernetes platform with the latest NetApp Kubernetes Monitoring Operator.
Basic Edition gives you more than before
Your trial is ending but you're not yet sure whether a subscription is right for you? Basic Edition has always given you a chance to continue using Cloud Insights with your current ONTAP data collector, but now you can continue capturing VMWare version, topology, and IOPS/Throughput/Latency data as well. NetApp customers with premium support on their storage systems will also be entitled to support for Cloud Insights.
Ready to learn more?
Check out the Learning Center section of the Help > Support page for links to NetApp University Cloud Insights course offerings!
Operating System support
The following operating system is supported with Cloud Insights Acquisition Units, in addition to those already supported:
-
Windows 11
June 2022
Kubernetes cluster saturation and other details
Cloud Insights makes it easier than ever to explore your Kubernetes environment, with an improved cluster detail page that provides Saturation details as well as a cleaner view into Namespaces and Workloads.
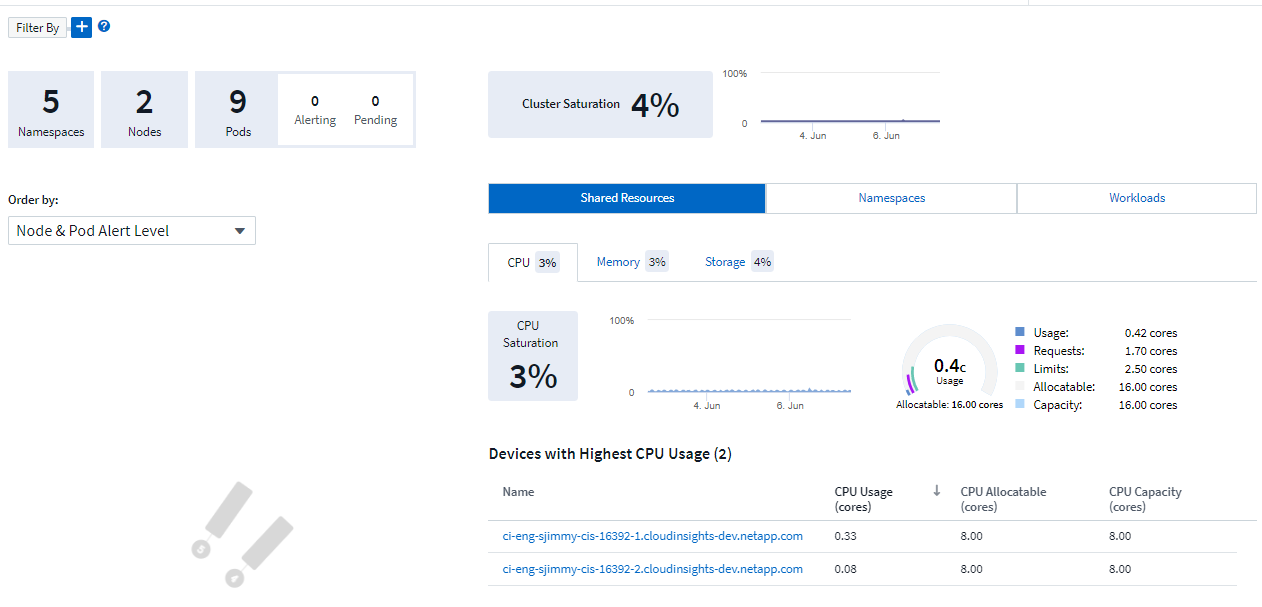
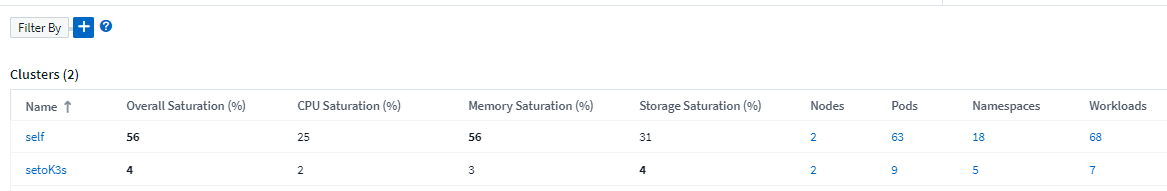
The Cluster list page also gives you a quick view of saturation, in addition to Node, Pod, Namespace, and Workload counts:
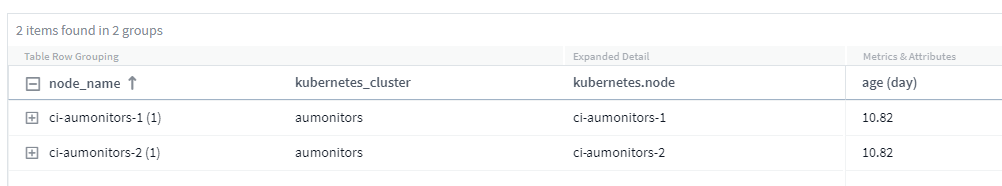
How old is your Kubernetes cluster?
Is your cluster just starting in the world, or has it experienced a long digital life? Age has been added as a time metric collected for Kubernetes Nodes.
Capacity Time-to-Full forecasting
Cloud Insights provides a dashboard to forecast the number of days until capacity runs out for each Internal Volume monitored. These values can help to significantly reduce the risk of an outage.
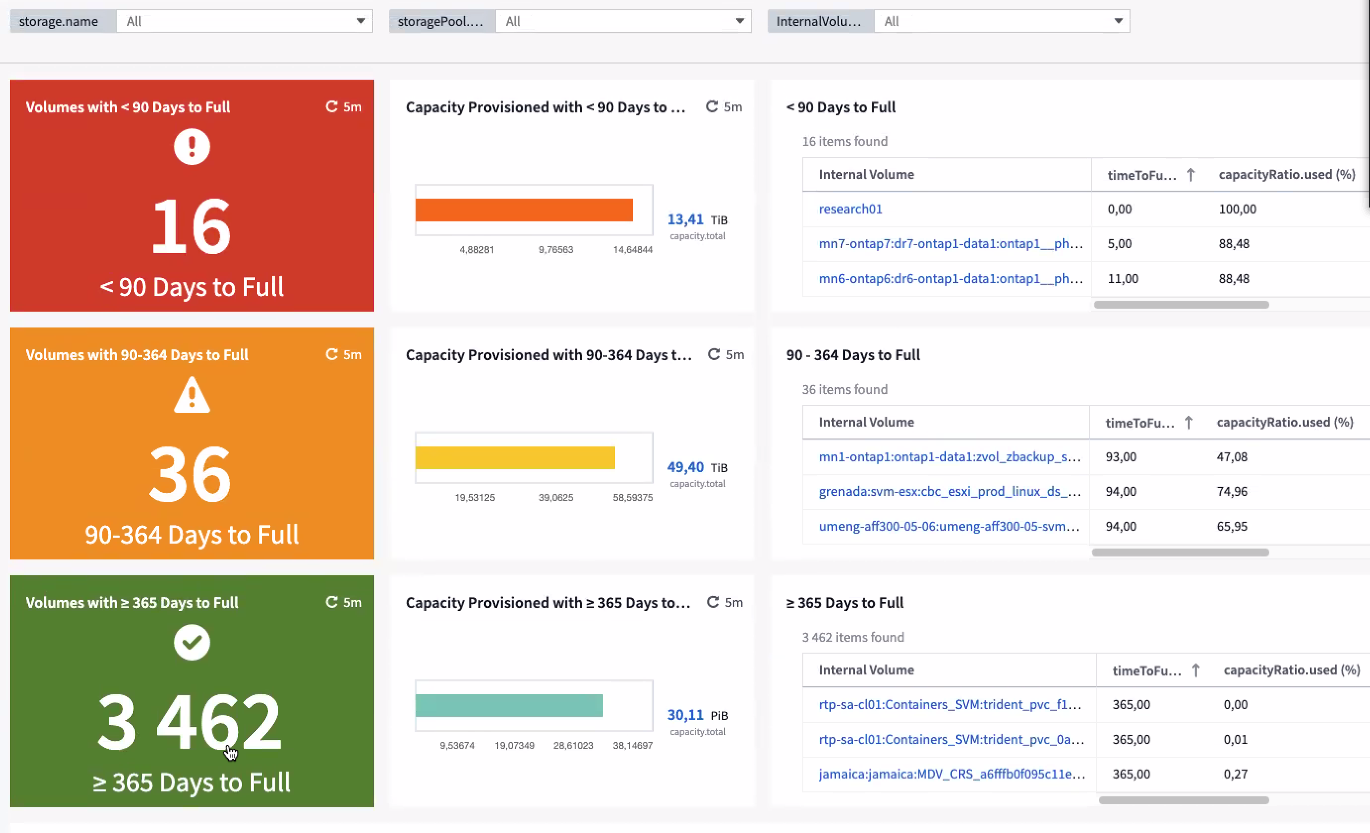
TTF counters are also available for Storage, Storage Pool, and Volume. Keep watching this space for additional dashboards for these objects.
Note that Time-to-Full forecasting is moving out of Preview and will be rolled out to all customers.
What's changed in my environment?
ONTAP change log entries can be viewed in the log explorer.
Operating System support
The following operating systems are supported with Cloud Insights Acquisition Units, in addition to those already supported:
-
CentOS Stream 9
-
Windows 2022
Updated Telegraf Agent
The agent for ingestion of telegraf integration data has been updated to version 1.22.3, with performance and security improvements.
Users wishing to update can refer to the appropriate upgrade section of the Agent Installation documentation.
Previous versions of the agent will continue to function with no user action required.
Preview Features
Cloud Insights regularly highlights a number of exciting new preview features. If you are interested in previewing one or more of these features, contact your NetApp Sales Team for more information.
Feature |
Description |
Kubernetes Namespaces Running out of Space |
The Kubernetes Namespaces Running Out of Space Insight gives you a view into workloads on your Kubernetes namespaces that are at risk of running out of space, with an estimate for the number of days remaining before each space becomes full. |
Cloud Secure – block user access on attack |
Greater protection for your business-critical data with the ability to block user access when an attack is detected. |
Shared Resource Under Stress |
The Shared Resource Under Stress insight uses AI/ML to automatically identify where resource contention is causing performance degradation in your environment, highlights any workloads impacted by it, and provides recommended actions to remediate, letting you solve performance issues more quickly. |
May 2022
Chat live with NetApp Support
You can now chat live with NetApp Support personnel! On the Help > Support page, simply click the Chat icon or click Chat in the "Contact Us" section to start a chat session. Chat support is available US weekdays for Standard and Premium Edition users.

Kubernetes Operator
We’ve made it easier to get you up and running with Cloud Insights’ advanced Kubernetes monitoring and cluster explorer.
The Kubernetes Monitoring Operator (NKMO) is the preferred method for installing Kubernetes for Cloud Insights Insights, for more flexible configuration of monitoring in fewer steps, as well as enhanced opportunities for monitoring other software running in the K8s cluster.
Click the link above for more information and pre-requisites
Manage Users and Invites with API
You can now manage users and invites using Cloud Insights' powerful API. Read more in the API Swagger Documentation.
Data Collection Alerts
Don’t miss out on critical metrics due to a failed collector!
It’s easier than ever to keep track of your data collectors with new alerts for data collector and acquisition unit failures.
Note that these Monitors are Paused by default. To enable, navigate to your monitors page and locate and resume “Acquisition Unit Shutdown” and “Collector Failed”
Alert on ONTAP storage changes
Don’t let unexpected storage changes lead to outages!
You can now configure Cloud Insights to alert when modification or removal of FlexVols, nodes and SVMs are detected on ONTAP systems.
Preview Features
Cloud Insights regularly highlights a number of exciting new preview features. If you are interested in previewing one or more of these features, contact your NetApp Sales Team for more information.
Feature |
Description |
Kubernetes Namespaces Running out of Space |
The Kubernetes Namespaces Running Out of Space Insight gives you a view into workloads on your Kubernetes namespaces that are at risk of running out of space, with an estimate for the number of days remaining before each space becomes full. |
Internal Volume and Volume Capacity Time-to-Full forecasting |
Cloud Insights is able to prognose the number of days until capacity runs out for each Internal Volume and Volume monitored. This value can help to significantly reduce the risk of an outage. |
Cloud Secure – block user access on attack |
Greater protection for your business-critical data with the ability to block user access when an attack is detected. |
Shared Resource Under Stress |
The Shared Resource Under Stress insight uses AI/ML to automatically identify where resource contention is causing performance degradation in your environment, highlights any workloads impacted by it, and provides recommended actions to remediate, letting you solve performance issues more quickly. |
April 2022
Share your Feedback!
We want your input to help shape Cloud Insights. Earn points and prizes by participating in NetApp's Insights to Action program. Sign up now!
Updated Dashboard Editor
We’ve overhauled our dashboard creation tools to make it easier for you to visualize your data even more quickly. Navigate to the “Dashboards” page of Cloud Insights to edit an existing dashboard, add one from our dashboard gallery, or create a new dashboard of your own to check it out.
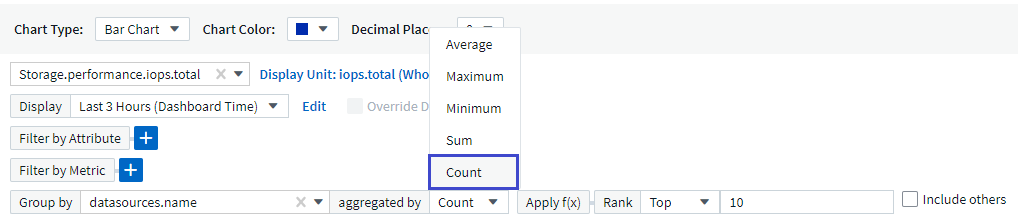
A new Count aggregation method has also been introduced. When grouping data in bar chart, column chart, and pie chart widgets, you can quickly and easily show the number of relevant objects for the selected metric.
Additionally, line charts now allow you to select one of three interpolation methods:
-
None - No interpolation is done
-
Linear - Interpolates a data point between the existing points
-
Stair - Uses the previous data point as the interpolated data point
Enhanced Monitoring for Your Kubernetes Infrastructure
Cloud Insights keeps you on top of changes in your Kubernetes environment by alerting you when pods, daemonsets, and replicasets are created or removed, as well as when new deployments are created. Kubernetes monitors default to paused state, so you should enable only the specific ones you need.
Preview Features
Cloud Insights regularly highlights a number of exciting new preview features. If you are interested in previewing one or more of these features, contact your NetApp Sales Team for more information.
Feature |
Description |
Internal Volume and Volume Capacity Time-to-Full forecasting |
Cloud Insights is able to prognose the number of days until capacity runs out for each Internal Volume and Volume monitored. This value can help to significantly reduce the risk of an outage. |
Cloud Secure – block user access on attack |
Greater protection for your business-critical data with the ability to block user access when an attack is detected. |
Shared Resource Under Stress |
The Shared Resource Under Stress insight uses AI/ML to automatically identify where resource contention is causing performance degradation in your environment, highlights any workloads impacted by it, and provides recommended actions to remediate, letting you solve performance issues more quickly. |
New Data Collector
-
Cohesity SmartFiles - This REST API-based collector will acquire a Cohesity cluster, discovering the “Views” (as CI Internal Volumes), the various nodes, as well as collecting performance metrics.
Other Data Collector Updates
Collection and display of performance data has been improved on the following data collectors:
-
Brocade CLI
-
Dell/EMC VPlex, PowerStore, Isilon/PowerScale, VNX Block/Clariion CLI, XtremIO, Unity/VNXe
-
Pure FlashArray
These performance enhancements are already available in all NetApp data collectors as well as VMware and Cisco, and will be rolled out to all other data collectors over the next few months.
March 2022
Cloud Connection for ONTAP 9.9+
The NetApp Cloud Connection for ONTAP 9.9+ data collector eliminates the need to install an external acquisition unit, thereby simplifying troubleshooting, maintenance, and initial deployment.
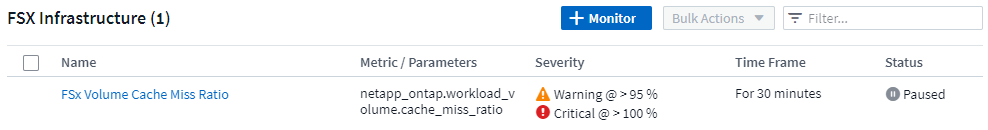
New FSx for NetApp ONTAP Monitors
Monitoring your FSx for NetApp ONTAP environment is easy with new system-defined monitors for both infrastructure (metrics) and workloads (logs).
New Cloud Secure features available to all
Your environment is more secure than ever with the following Cloud Secure features now generally available:
Feature |
Description |
Data Destruction – File Deletion attack detection |
Detect abnormal large-scale file deletion activity, block malicious file access by malicious users, and take automatic snapshots with automatic response policies. |
Separate notifications for Warnings and Alerts |
Warning and Alert notifications can be sent to separate recipients, ensuring the right team can stay informed |
Updated Telegraf Agent
The agent for ingestion of telegraf integration data has been updated to version 1.21.2, with performance and security improvements.
Users wishing to update can refer to the appropriate upgrade section of the Agent Installation documentation.
Previous versions of the agent will continue to function with no user action required.
Data Collector Updates
-
The Broadcom Fibre Channel Switches data collector has been optimized to reduce the number of CLI commands issued with each inventory poll.
February 2022
Cloud Insights addresses Apache Log4j vulnerabilities
Customer security is a top priority at NetApp. Cloud Insights includes updates to its software libraries to address the recent Apache Log4j vulnerabilities.
Please refer to the following on NetApp’s Product Security Advisory website:
You can read more about these vulnerabilities and NetApp's response at the NetApp Newsroom.
Kubernetes Namespace Detail Page
Exploring your Kubernetes environment is now better than ever, with informative detail pages for your cluster’s namespaces. The namespace detail page provides a summary of all the assets used by a namespace, including all the backend storage resources and their capacity utilizations.
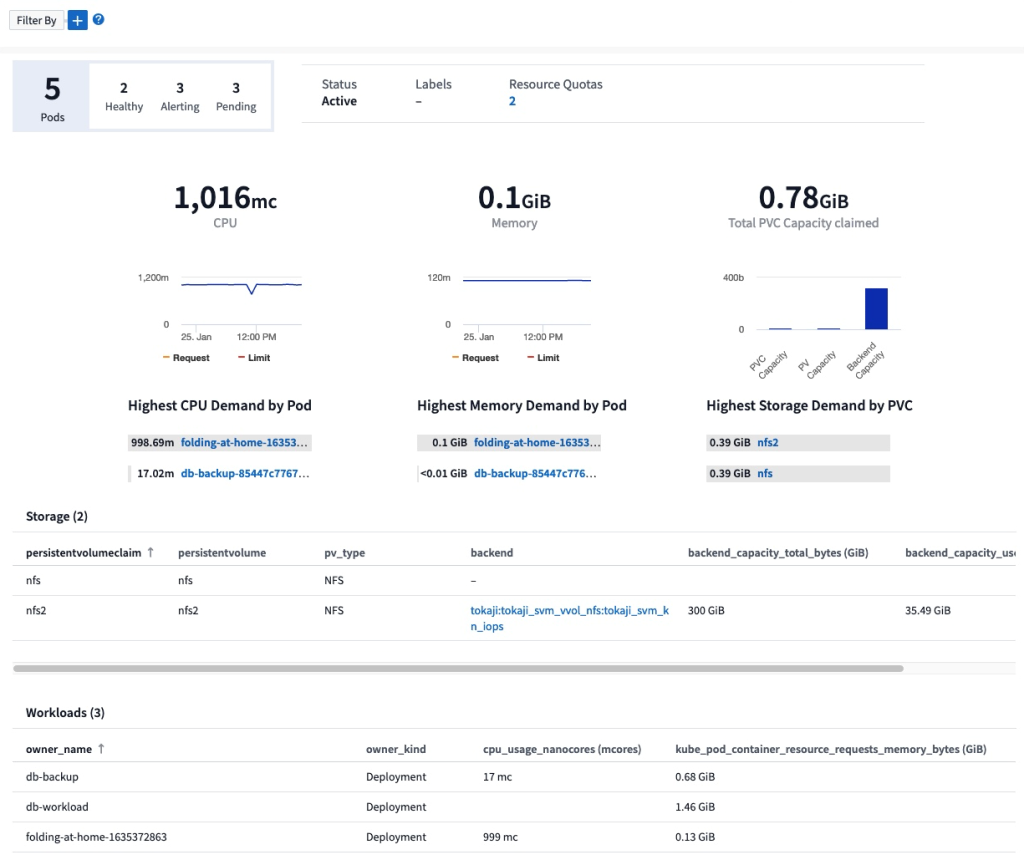
December 2021
Deeper integration for ONTAP systems
Simplify alerting for ONTAP hardware failures and more with new integration with NetApp Event Management System (EMS).
Explore and alert on low-level ONTAP messages in Cloud Insights to inform and improve troubleshooting workflows and further reduce reliance on ONTAP element management tooling.
Querying Logs
For ONTAP systems, Cloud Insights Queries include a powerful Log Explorer, allowing you to easily investigate and troubleshoot EMS log entries.
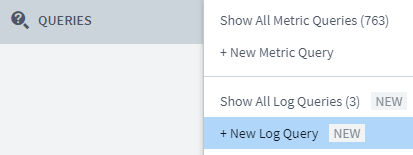
Data Collector-level notifications.
In addition to system-defined and custom-created Monitors for alerting, you can also set alert notifications for ONTAP data collectors, allowing you to specify recipients for collector-level alerts, independent of other monitor alerts.
Greater flexibility of Cloud Secure roles
Users can be granted access to Cloud Secure features based on roles set by an administrator:
Role |
Cloud Secure Access |
Administrator |
Can perform all Cloud Secure functions, including those for Alerts, Forensics, data collectors, automated response policies, and APIs for Cloud Secure. |
User |
Can view and manage Alerts and view Forensics. User role can change alert status, add a note, take snapshots manually, and block user access. |
Guest |
Can view Alerts and Forensics. Guest role cannot change alert status, add a note, take snapshots manually, or block user access. |
Operating System support
CentOS 8.x support is being replaced with CentOS 8 Stream support. CentOS 8.x will reach End-of-Life on December 31, 2021.
Data Collector Updates
A number of Cloud Insights data collector names have been added to reflect vendor changes:
Vendor/Model |
Previous Name |
Dell EMC PowerScale |
Isilon |
HPE Alletra 9000 / Primera |
3PAR |
HPE Alletra 6000 |
Nimble |
November 2021
Adaptive Dashboards
New variables for attributes and the ability to use variables in widgets.
Dashboards are now more powerful and flexible than ever. Build adaptive dashboards with attribute variables to quickly filter dashboards on the fly. Using these and other pre-existing variables you can now create one high level dashboard to see metrics for your entire environment, and seamlessly filter down by resource name, type, location, and more. Use number variables in widgets to associate raw metrics with costs, for example cost per GB for storage as a service.
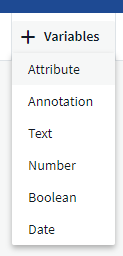
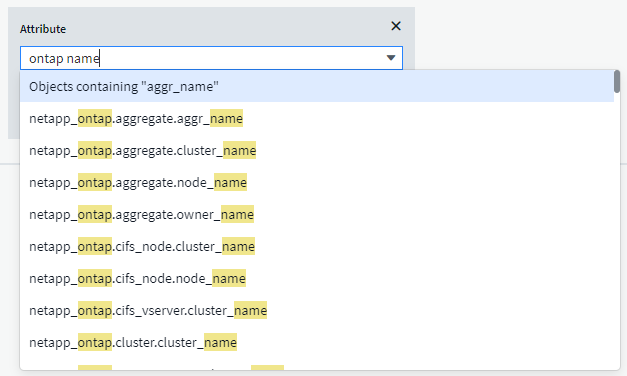
Access the Reporting Database via API
Enhanced capabilities for integration with third party reporting, ITSM, and automation tools: Cloud Insights' powerful API allows users to query the Cloud Insights Reporting database directly, without going through the Cognos Reporting environment.
Pod tables on VM Landing Page
Seamless navigation between VMs and the Kubernetes Pods using them: for improved troubleshooting and performance headroom management, a table of associated Kubernetes Pods will now appear on VM landing pages.
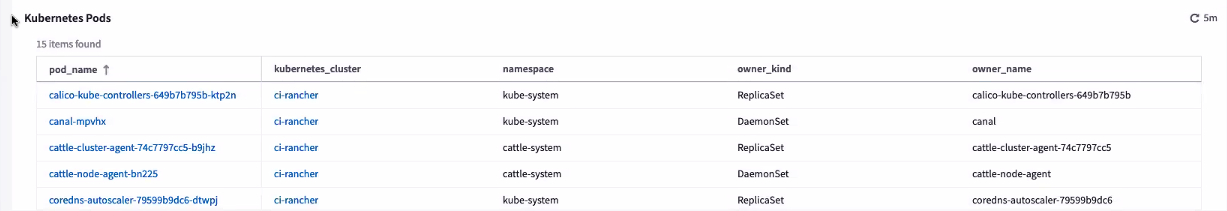
Data Collector Updates
-
ECS now reports firmware for storage and node
-
Isilon has improved prompt detection
-
Azure NetApp Files collects performance data more quickly
-
StorageGRID now supports Single Sign-On (SSO)
-
Brocade CLI properly reports model for X&-4
Additional Operating Systems supported
The Cloud Insights Acquisition Unit supports the following operating systems, in addition to those already supported:
-
Centos (64-bit) 8.4
-
Oracle Enterprise Linux (64-bit) 8.4
-
Red Hat Enterprise Linux (64-bit) 8.4
October 2021
Filters on K8S Explorer pages
Kubernetes Explorer page filters give you focused control of the data displayed for your Kubernetes cluster, node, and pod exploration.
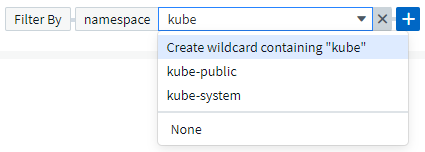
K8s Data for Reporting
Kubernetes data is now available for use in Reporting, allowing you to create chargeback or other reports. In order for Kubernetes chargeback data to be passed to Reporting, you must have an active connection to, and Cloud Insights must be receiving data from, your Kubernetes cluster as well as its back-end storage. If there is no data received from the back-end storage, Cloud Insights can not send Kubernetes object data to Reporting.
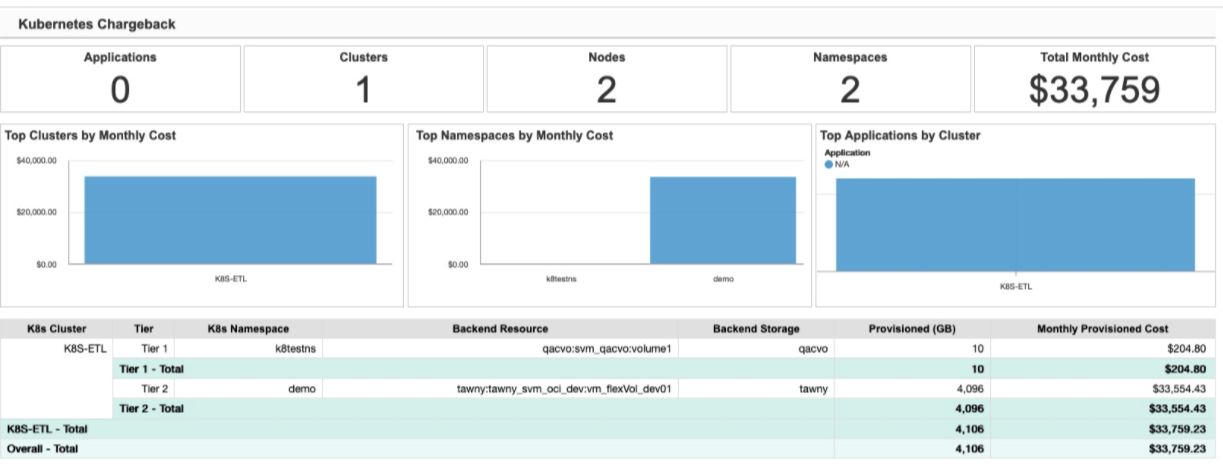
Dark Theme has arrived
Many of you asked for a dark theme, and Cloud Insights has answered. To switch between light and dark theme, click the drop-down next to your user name.
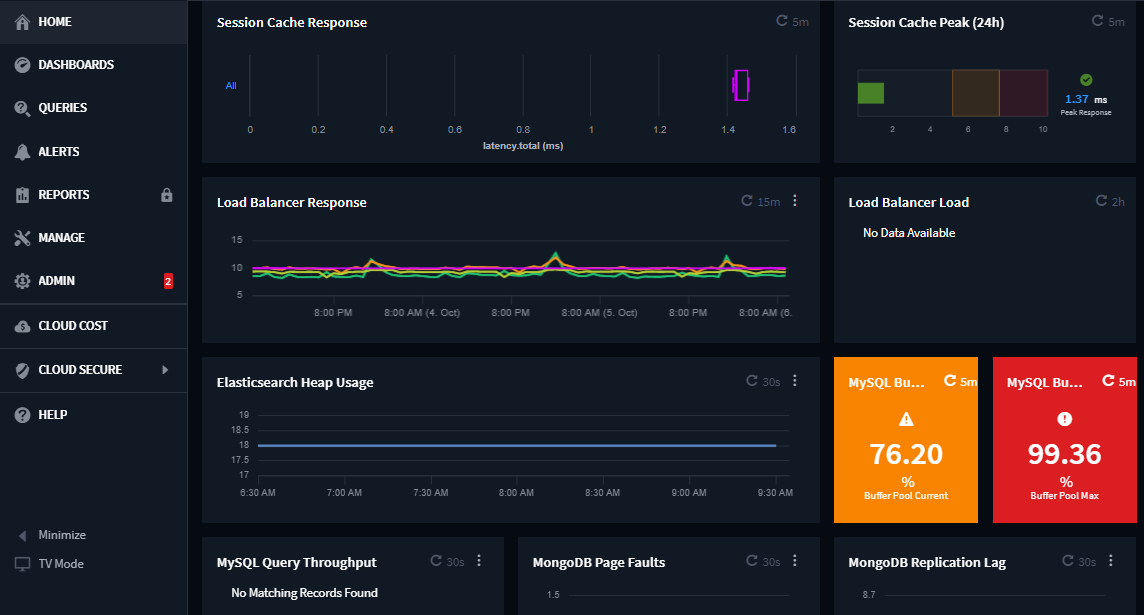
Data Collector Support
We’ve made some improvements in Cloud Insights Data Collectors. Here are some highlights:
-
New collector for Amazon FSx for ONTAP
September 2021
Performance Policies are now Monitors
Monitors and Alerts have supplanted Performance Policies and Violations throughout Cloud Insights. Alerting with Monitors provides greater flexibility and insight into potential problems or trends in your environment.
Autocomplete Suggestions, Wildcards, and Expressions in Monitors
When creating a monitor for alerting, typing in a filter is now predictive, allowing you to easily search for and find the metrics or attributes for your monitor. Additionally, you are given the option to create a wildcard filter based on the text you type.
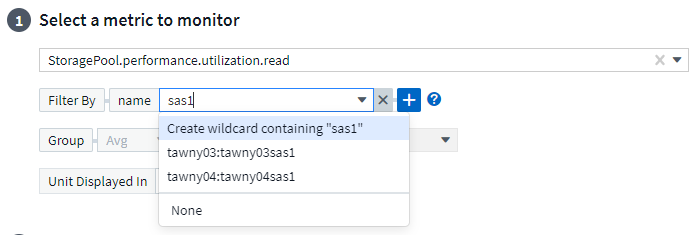
Updated Telegraf Agent
The agent for ingestion of telegraf integration data has been updated to version 1.19.3, with performance and security improvements.
Users wishing to update can refer to the appropriate upgrade section of the Agent Installation documentation.
Previous versions of the agent will continue to function with no user action required.
Data Collector Support
We’ve made some improvements in Cloud Insights Data Collectors. Here are some highlights:
-
Microsoft Hyper-V collector now uses PowerShell instead of WMI
-
Azure VMs and VHD collector is now up to 10 times faster due to parallel calls
-
HPE Nimble now supports federated and iSCSI configurations
And since we’re always improving Data Collection, here are some other recent changes of note:
-
New collector for EMC Powerstore
-
New collector for Hitachi Ops Center
-
New collector for Hitachi Content Platform
-
Enhanced ONTAP collector to report Fabric Pools
-
Enhanced ANF with Storage Pool and Volume performance
-
Enhanced EMC ECS with Storage Nodes and Storage performance as well as the Object Count in buckets
-
Enhanced EMC Isilon with Storage Node and Qtree metrics
-
Enhanced EMC Symetrix with volume QOS limit metrics
-
Enhanced IBM SVC and EMC PowerStore with Storage Nodes parent serial number
August 2021
New Audit Page User Interface
The Audit page provides a cleaner interface and now allows the export of audit events to .CSV file.
Enhanced User Role Management
Cloud Insights now allows even greater freedom for assigning user roles and access controls. Users can now be assigned granular permissions for monitoring, reporting, and Cloud Secure separately.
This means you can allow more users administrative access to monitoring, optimization, and reporting functions whilst restricting access to your sensitive Cloud Secure audit and activity data to only those that need it.
Find out more about the different levels of access in the Cloud Insights documentation.
June 2021
Autocomplete Suggestions, Wildcards, and Expressions in Filters
With this release of Cloud Insights, you no longer need to know all the possible names and values on which to filter in a query or widget. When filtering, you can simply start typing and Cloud insights will suggest values based on your text. No more looking up Application names or Kubernetes attributes ahead of time just to find the ones you want to show in your widget.
As you type in a filter, the filter displays a smart list of results from which you can choose, as well as the option to create a wildcard filter based on the current text. Selecting this option will return all results that match the wildcard expression. You can of course also select multiple individual values that you want added to the filter.
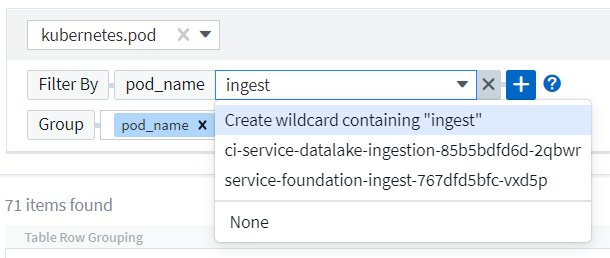
Additionally, you can create expressions in a filter using NOT or OR, or you can select the "None" option to filter for null values in the field.
Read more about filtering options in queries and widgets.
APIs available by Edition
Cloud Insights' powerful APIs are more accessible than ever, with Alerts APIs now available in Standard and Premium Editions.
The following APIs are available for each Edition:
| API Category | Basic | Standard | Premium |
|---|---|---|---|
Acquisition Unit |
|
|
|
Data Collection |
|
|
|
Alerts |
|
|
|
Assets |
|
|
|
Data Ingestion |
|
|

Kubernetes PV and Pod Visibility
Cloud Insights provides visibility into the back-end storage for your Kubernetes environments, giving you insight to your Kubernetes Pods and Persistent Volumes (PVs). You can now track PV counters such as IOPS, latency, and throughput from a single Pod’s usage through a PV counter to a PV and all the way to the back-end storage device.
On a Volume or Internal Volume landing page, two new tables are displayed:
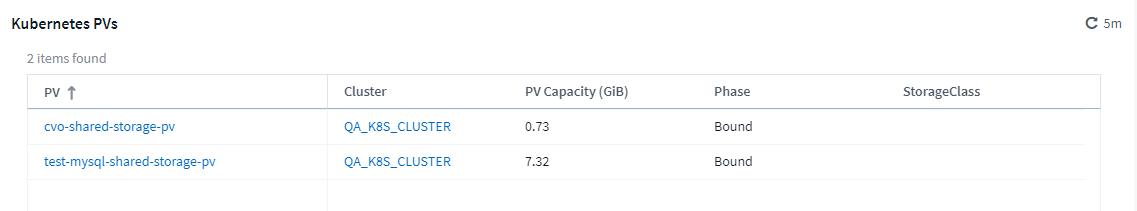
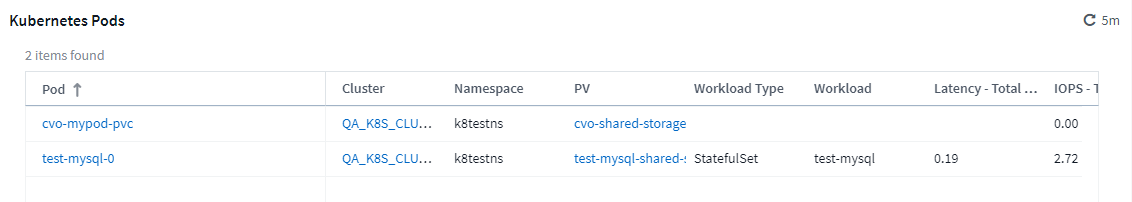
Note that to take advantage of these new tables, it is recommended to uninstall your current Kubernetes agent, and install it fresh. You must also install Kube-State-Metrics version 2.1.0 or later.
Kubernetes Node to VM links
On a Kubernetes Node page, you can now click to open the Node's VM page. The VM page also includes a link back to the Node itself.
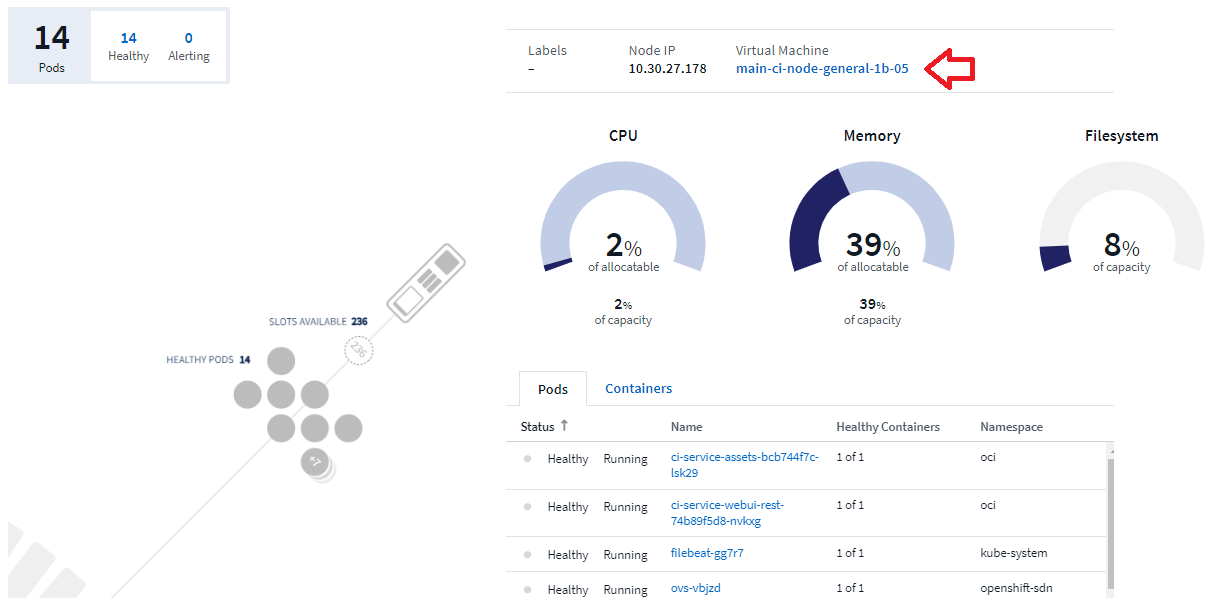
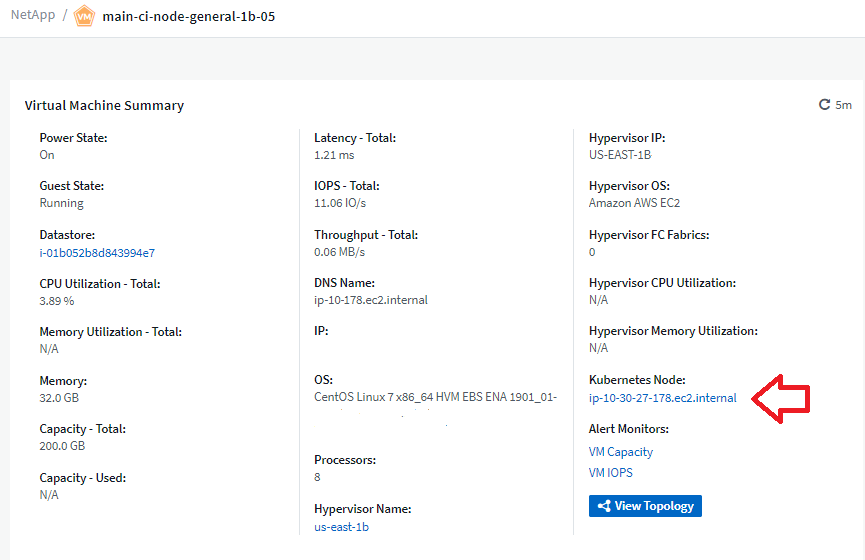
Alert Monitors replacing Performance Policies
To enable the added benefits of multiple thresholds, webhook and email alert delivery, alerting on all metrics using a single interface, and more, Cloud Insights will be converting Standard and Premium Edition customers from Performance Policies to Monitors during the months of July and August, 2021. Learn more about Alerts and Monitors, and stay tuned for this exciting change.
Cloud Secure supports NFS
Cloud Secure now supports NFS for ONTAP data collection. Monitor SMB and NFS user access to protect your data from ransomware attacks.
Additionally, Cloud Secure supports Active-Directory and LDAP user directories for collection of NFS user attributes.
Cloud Secure snapshot purge
Cloud Secure automatically deletes snapshots based on the Snapshot Purge Settings, to save storage space and reduce the need for manual snapshot deletion.
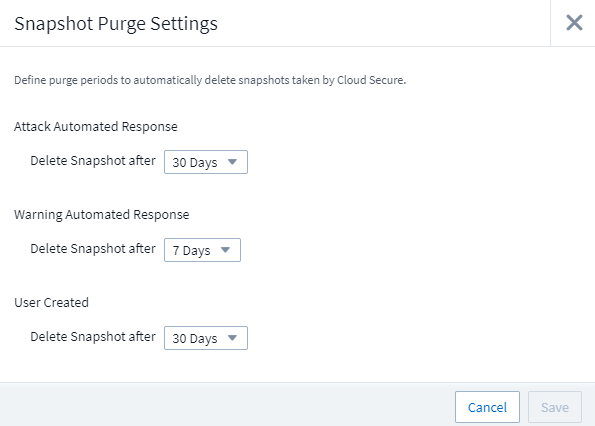
Cloud Secure data collection speed
A single data collector agent system can now post up to 20,000 events per second to Cloud Secure.
May 2021
Here are some of the changes we've made in April:
Updated Telegraf Agent
The agent for ingestion of telegraf integration data has been updated to version 1.17.3, with performance and security improvements.
Users wishing to update can refer to the appropriate upgrade section of the Agent Installation documentation.
Previous versions of the agent will continue to function with no user action required.
Add Corrective Actions to an Alert
You can now add an optional description as well as additional insights and/or corrective actions when creating or modifying a Monitor by filling in the Add an Alert Description section. The description will be sent with the alert. The insights and corrective actions field can provide detailed steps and guidance for dealing with alerts and will be displayed in the summary section of the alert landing page.
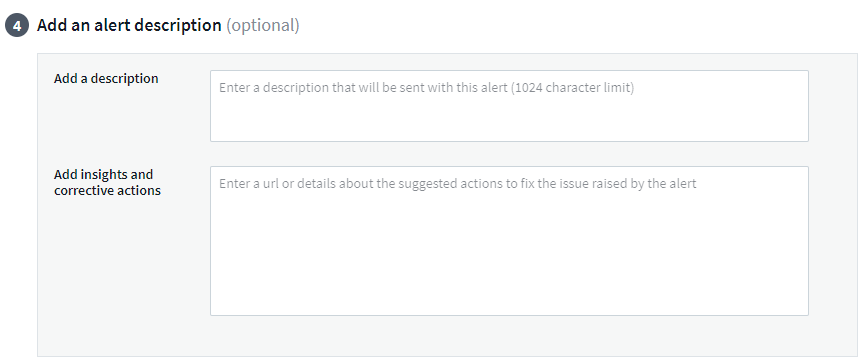
Cloud Insights APIs for All Editions
API access is now available in all editions of Cloud Insights.
Users of Basic edition can now automate actions for Acquisition Units and Data Collectors, and Standard Edition users can query metrics and ingest custom metrics.
Premium edition continues to allow full use of all API categories.
| API Category | Basic | Standard | Premium |
|---|---|---|---|
Acquisition Unit |
|
|
|
Data Collection |
|
|
|
Assets |
|
|
|
Data Ingestion |
|
|
|
Data Warehouse |
|
For details on API usage, please refer to the API documentation.
April 2021
Easier Management of Monitors
Monitor Grouping simplifies the management of monitors in your environment. Multiple monitors can now be grouped together and paused as one. For example, if you have an update occurring on a stack of infrastructure, you can pause alerts from all those devices via one click.
Monitor groups is the first part of an exciting new feature bringing improved management of ONTAP devices to Cloud Insights.
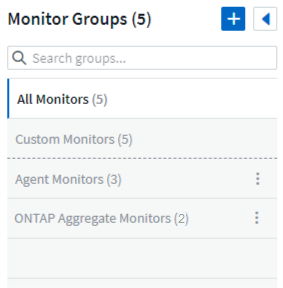
Enhanced Alerting Options Using Webhooks
Many commercial applications support Webhooks as a standard input interface. Cloud Insights now supports many of these delivery channels, providing default templates for Slack, PagerDuty, Teams, and Discord, in addition to providing customizable generic webhooks to support many other applications.
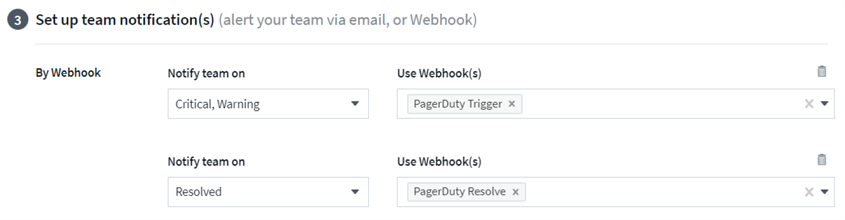
Improved Device Identification
To improve monitoring and troubleshooting as well as deliver accurate reporting, it is helpful to understand the names of devices rather than their IP addresses or other identifiers. Cloud Insights now incorporates an automatic way to identify the names of storage and physical host devices in the environment, using a rule-based approach called Device Resolution, available in the Manage menu.
You asked for more!
A popular ask by customers has been for more default options for visualizing the range of data, so we have added the following five new choices that are now available throughout the service via the time range picker:
-
Last 30 Minutes
-
Last 2 Hours
-
Last 6 Hours
-
Last 12 Hours
-
Last 2 Days
Multiple Subscriptions in one Cloud Insights Environment
Starting April 2, Cloud Insights supports multiple subscriptions of the same edition type for a customer in a single Cloud Insights instance. This enables customers to co-term parts of their Cloud Insights subscription with infrastructure purchases. Contact NetApp Sales for assistance with multiple subscriptions.
Choose Your Path
While setting up Cloud Insights, you can now choose whether to start with Monitoring and Alerting or Ransomware and Insider Threat Detection. Cloud Insights will configure your starting environment based on the path you choose. You can configure the other path at any time afterward.
Easier Cloud Secure Onboarding
And it is easier than ever to start using Cloud Secure, with a new step-by-step setup checklist.
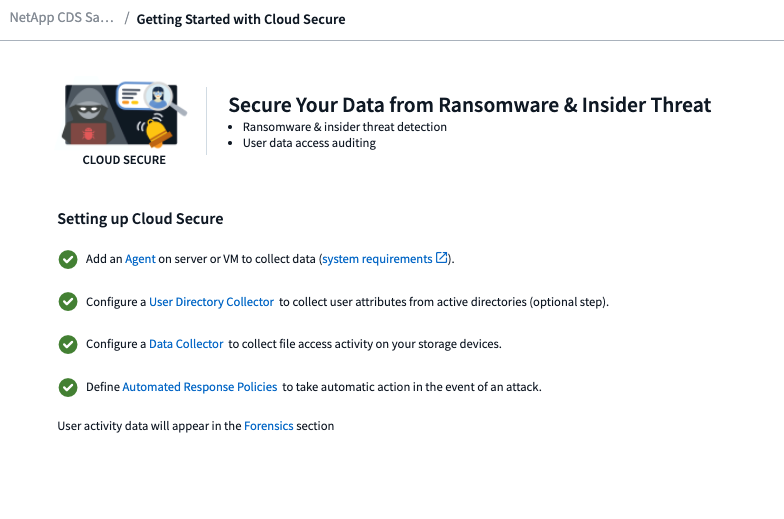
As always, we love to hear your suggestions! Send them to ng-cloudinsights-customerfeedback@netapp.com.
February 2021
Updated Telegraf Agent
The agent for ingestion of telegraf integration data has been updated to version 1.17.0, which includes vulnerability and bug fixes.
Cloud Cost Analyzer
Experience the power of Spot by NetApp with Cloud Cost, which provides a detailed cost analysis of past, present, and estimated spending, providing visibility into cloud usage in your environment. The Cloud Cost dashboard delivers a clear view of cloud expenses and a drill down into individual workloads, accounts, and services.
Cloud Cost can help with these major challenges:
-
Tracking and monitoring your cloud expenses
-
Identifying waste and potential optimization areas
-
Delivering executable action items
Cloud Cost is focused on monitoring. Upgrade to the full Spot by NetApp account to enable automatic cost saving and environment optimization.
Querying for objects having null values using filters
Cloud Insights now allows searching for attributes and metrics having null/none values through the use of filters. You can perform this filtering on any attributes/metrics in the following places:
-
On the Query page
-
In Dashboard widgets and page variables
-
On the Alerts list page
-
When creating Monitors
To filter for null/none values, simply select the None option when it appears in the appropriate filter drop-down.
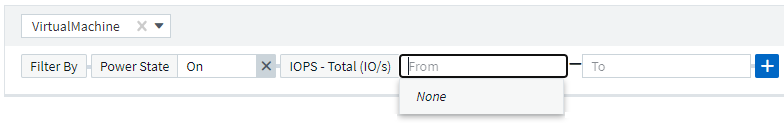
Multi-Region Support
Starting today we offer the Cloud Insights service in different regions across the globe, which facilitates performance and increases security for customers based outside the United States. Cloud Insights/Cloud Secure stores information according to the region in which your environment is created.
Click here for more information.
January 2021
Additional ONTAP Metrics Renamed
As part of our continuing effort to improve efficiency of data-gathering from ONTAP systems, the following ONTAP metrics have been renamed.
If you have existing dashboard widgets or queries using any of these metrics, you will need to edit or re-create them to use the new metric names.
| Previous Metric Name | New Metric Name |
|---|---|
netapp_ontap.disk_constituent.total_transfers |
netapp_ontap.disk_constituent.total_iops |
netapp_ontap.disk.total_transfers |
netapp_ontap.disk.total_iops |
netapp_ontap.fcp_lif.read_data |
netapp_ontap.fcp_lif.read_throughput |
netapp_ontap.fcp_lif.write_data |
netapp_ontap.fcp_lif.write_throughput |
netapp_ontap.iscsi_lif.read_data |
netapp_ontap.iscsi_lif.read_throughput |
netapp_ontap.iscsi_lif.write_data |
netapp_ontap.iscsi_lif.write_throughput |
netapp_ontap.lif.recv_data |
netapp_ontap.lif.recv_throughput |
netapp_ontap.lif.sent_data |
netapp_ontap.lif.sent_throughput |
netapp_ontap.lun.read_data |
netapp_ontap.lun.read_throughput |
netapp_ontap.lun.write_data |
netapp_ontap.lun.write_throughput |
netapp_ontap.nic_common.rx_bytes |
netapp_ontap.nic_common.rx_throughput |
netapp_ontap.nic_common.tx_bytes |
netapp_ontap.nic_common.tx_throughput |
netapp_ontap.path.read_data |
netapp_ontap.path.read_throughput |
netapp_ontap.path.write_data |
netapp_ontap.path.write_throughput |
netapp_ontap.path.total_data |
netapp_ontap.path.total_throughput |
netapp_ontap.policy_group.read_data |
netapp_ontap.policy_group.read_throughput |
netapp_ontap.policy_group.write_data |
netapp_ontap.policy_group.write_throughput |
netapp_ontap.policy_group.other_data |
netapp_ontap.policy_group.other_throughput |
netapp_ontap.policy_group.total_data |
netapp_ontap.policy_group.total_throughput |
netapp_ontap.system_node.disk_data_read |
netapp_ontap.system_node.disk_throughput_read |
netapp_ontap.system_node.disk_data_written |
netapp_ontap.system_node.disk_throughput_written |
netapp_ontap.system_node.hdd_data_read |
netapp_ontap.system_node.hdd_throughput_read |
netapp_ontap.system_node.hdd_data_written |
netapp_ontap.system_node.hdd_throughput_written |
netapp_ontap.system_node.ssd_data_read |
netapp_ontap.system_node.ssd_throughput_read |
netapp_ontap.system_node.ssd_data_written |
netapp_ontap.system_node.ssd_throughput_written |
netapp_ontap.system_node.net_data_recv |
netapp_ontap.system_node.net_throughput_recv |
netapp_ontap.system_node.net_data_sent |
netapp_ontap.system_node.net_throughput_sent |
netapp_ontap.system_node.fcp_data_recv |
netapp_ontap.system_node.fcp_throughput_recv |
netapp_ontap.system_node.fcp_data_sent |
netapp_ontap.system_node.fcp_throughput_sent |
netapp_ontap.volume_node.cifs_read_data |
netapp_ontap.volume_node.cifs_read_throughput |
netapp_ontap.volume_node.cifs_write_data |
netapp_ontap.volume_node.cifs_write_throughput |
netapp_ontap.volume_node.nfs_read_data |
netapp_ontap.volume_node.nfs_read_throughput |
netapp_ontap.volume_node.nfs_write_data |
netapp_ontap.volume_node.nfs_write_throughput |
netapp_ontap.volume_node.iscsi_read_data |
netapp_ontap.volume_node.iscsi_read_throughput |
netapp_ontap.volume_node.iscsi_write_data |
netapp_ontap.volume_node.iscsi_write_throughput |
netapp_ontap.volume_node.fcp_read_data |
netapp_ontap.volume_node.fcp_read_throughput |
netapp_ontap.volume_node.fcp_write_data |
netapp_ontap.volume_node.fcp_write_throughput |
netapp_ontap.volume.read_data |
netapp_ontap.volume.read_throughput |
netapp_ontap.volume.write_data |
netapp_ontap.volume.write_throughput |
netapp_ontap.workload.read_data |
netapp_ontap.workload.read_throughput |
netapp_ontap.workload.write_data |
netapp_ontap.workload.write_throughput |
netapp_ontap.workload_volume.read_data |
netapp_ontap.workload_volume.read_throughput |
netapp_ontap.workload_volume.write_data |
netapp_ontap.workload_volume.write_throughput |
New Kubernetes Explorer
The Kubernetes Explorer provides a simple topology view of Kubernetes Clusters, allowing even non-experts to quickly identify issues & dependencies, from the cluster level down to the container and storage.
A wide variety of information can be explored using the Kubernetes Explorer's drill-down details for status, usage, and health of the Clusters, Nodes, Pods, Containers, and Storage in your Kubernetes environment.
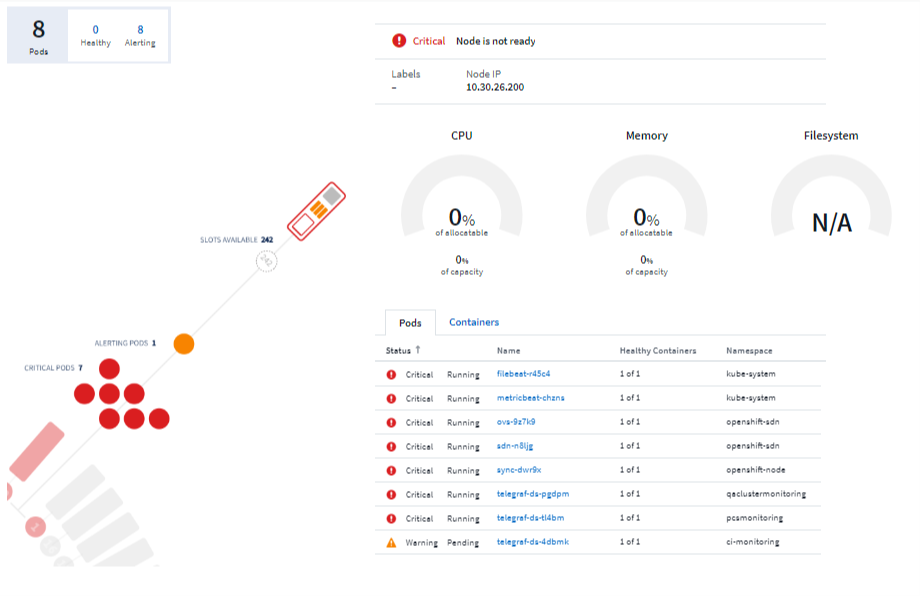
'''nt1.png[Table Widget Unit Management]
Acquisition Unit Detail Page
Acquisition Units now have their own landing page, providing useful detail for each AU as well as information to help with troubleshooting. The AU detail page provides links to the AU's data collectors as well as helpful status information.
Cloud Secure Docker Dependency Removed
Cloud Secure's dependency on Docker has been removed. Docker is no longer required for Cloud Secure agent installation.
Reporting User Roles
If you have Cloud Insights Premium Edition with Reporting, every Cloud Insights user in your environment also has a Single Sign-On (SSO) login to the Reporting application (i.e. Cognos); by clicking the Reports link in the menu, they will automatically be logged in to Reporting.
Their user role in Cloud Insights determines their Reporting user role:
Cloud Insights Role |
Reporting Role |
Reporting Permissions |
Guest |
Consumer |
Can view, schedule, and run reports and set personal preferences such as those for languages and time zones. Consumers cannot create reports or perform administrative tasks. |
User |
Author |
Can perform all Consumer functions as well as create and manage reports and dashboards. |
Administrator |
Administrator |
Can perform all Author functions as well as all administrative tasks such configuration of reports and the shutdown and restart of reporting tasks. |

|
Cloud Insights Reporting is available for environments of 500 MUs or more. |

|
If you are a current Premium Edition customer and wish to retain your reports, read this important note for existing customers. |
New API Category for Data Ingestion
Cloud Insights has added a Data Ingestion API category, giving you greater control over custom data and agents. Detailed documentation for this and other API Categories can be found in Cloud Insights by navigating to Admin > API Access and clicking the API Documentation link. You can also attach a comment to the AU in the Note field, which is displayed on the AU detail page as well as the AU list page.