

Kubernetes Change Analytics
 Suggest changes
Kubernetes Change Analytics provide you with an all-in-one view of recent changes to your K8s environment. Alerts and deployment status are at your fingertips. With Change Analytics, you can track every deployment and configuration change, and correlate it with the health and performance of K8s services, infrastructure, and clusters.
How does Change Analysis help?
-
In multi-tenant Kubernetes environments, outages may happen because of mis-configured changes. Change Analytics helps with this by providing a single pane to view and correlate the health of workloads and configuration changes. This may help in troubleshooting dynamic Kubernetes environments.
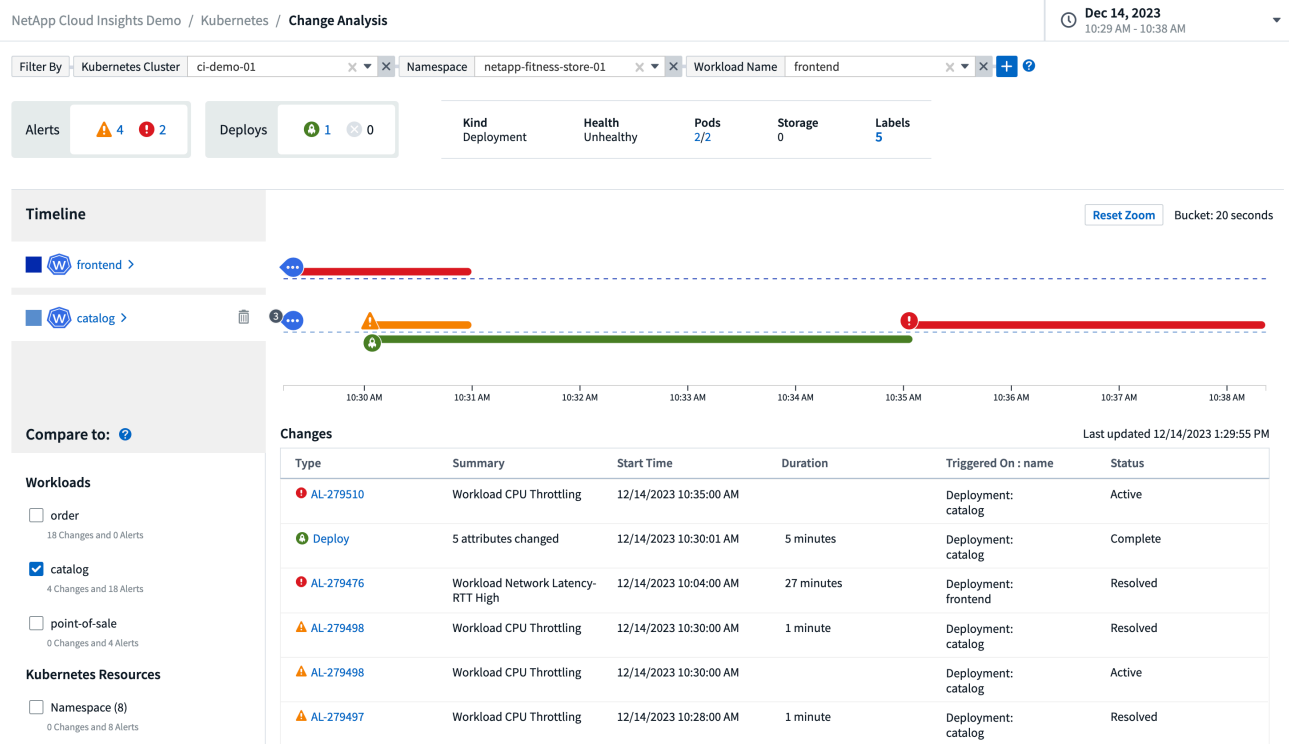
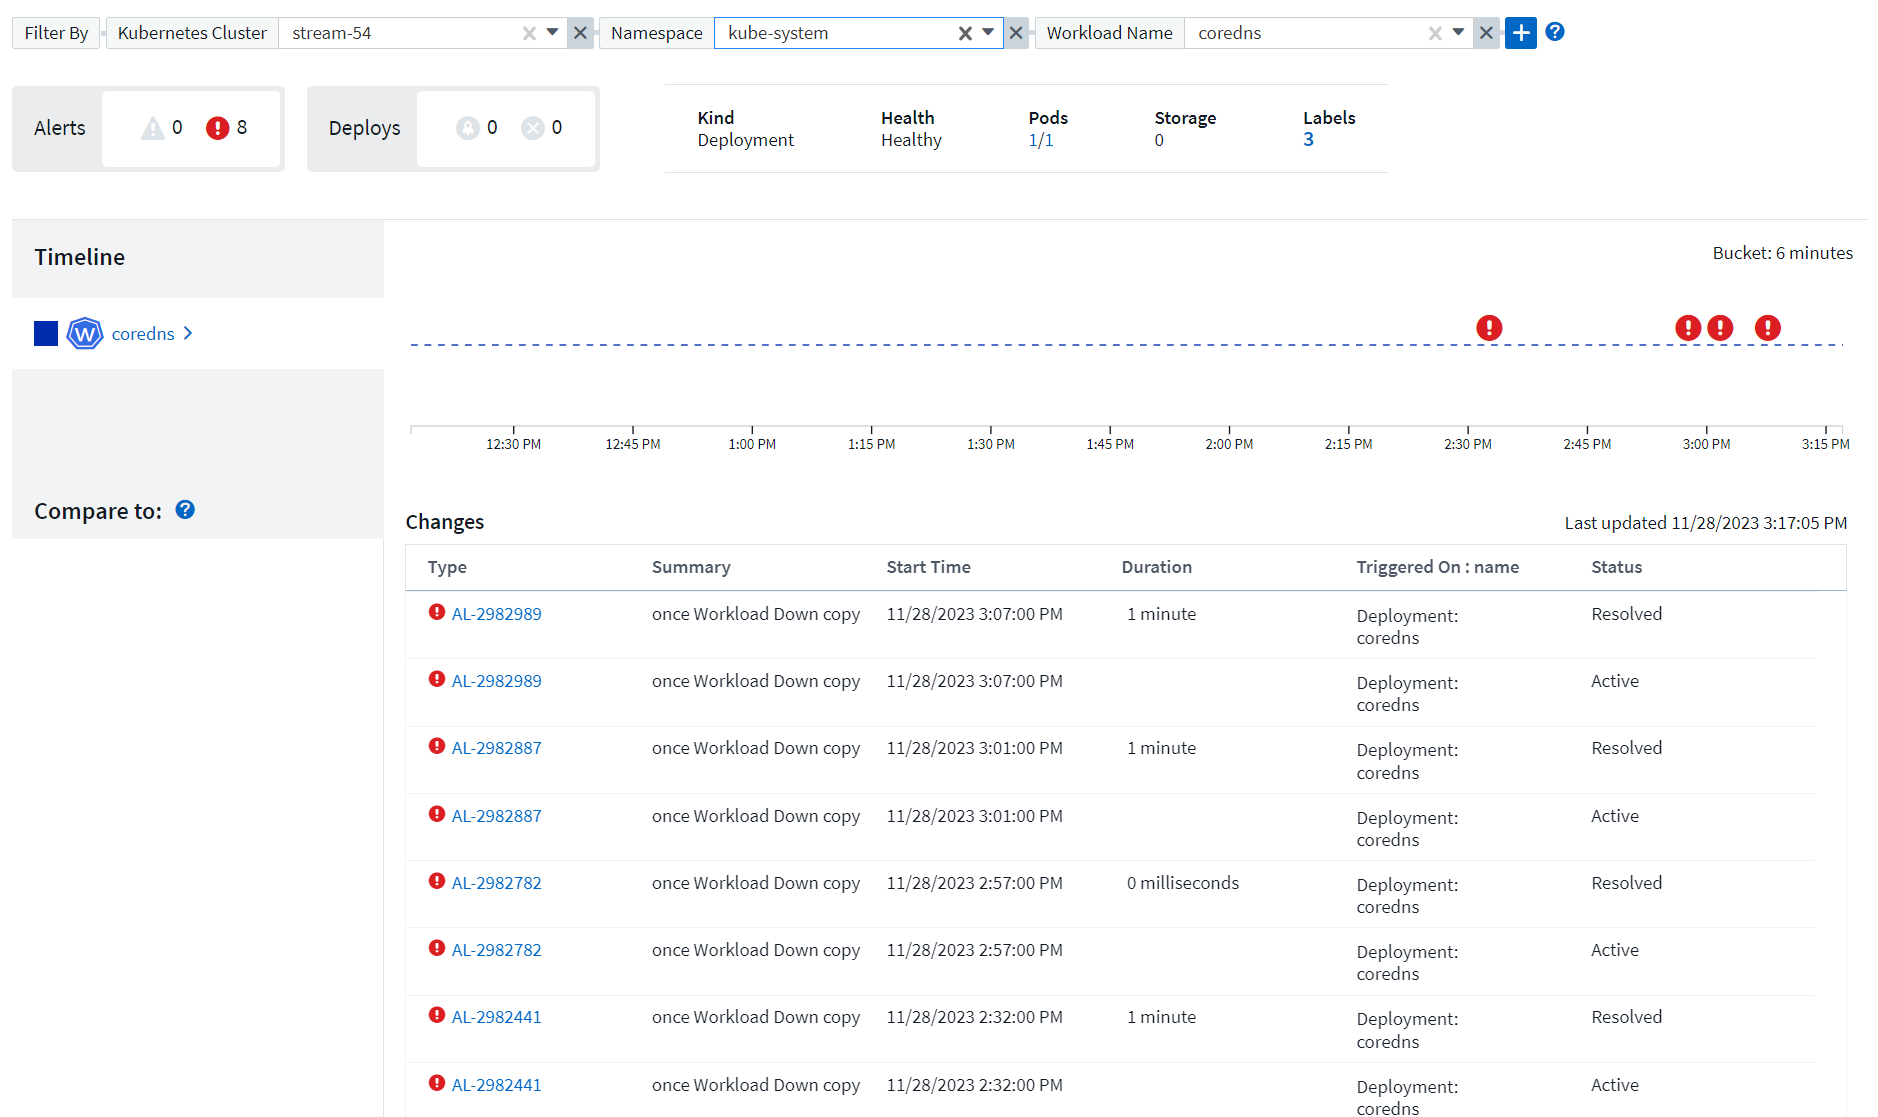
To view Kubernetes Change Analytics, navigate to Kubernetes > Change Analysis.
 .
.
The page automatically refreshes based on the currently-selected Data Infrastructure Insights time range. Smaller time ranges mean more frequent screen refreshing.
Filtering
As with all features of Data Infrastructure Insights, filtering the change list is intuitive: at the top of the page, enter or select values for your Kubernetes Cluster, Namespace, or Workload, or add your own filters by selecting the {+] button.
When you filter down to a specific Cluster, Namespace, and Workload (along with any other filters you set), you are shown a timeline of deployments and alerts for that workload in that namespace on that cluster. Zoom in further by clicking and dragging in the graph to focus on a more specific time range.
Quick Status
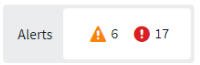
Below the filtering area are a number of high-level indicators. On the left is the number of alerts (Warning and Critical). This number includes Active as well as Resolved alerts. To see only Active alerts, set a filter for "Status" and choose "Active".
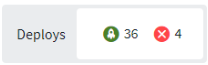
Deployment status is also shown here. Again, the default is to show the count of Started, Complete, and Failed deployments. To see only Failed deployments, set a filter for "Status" and select "Failed".
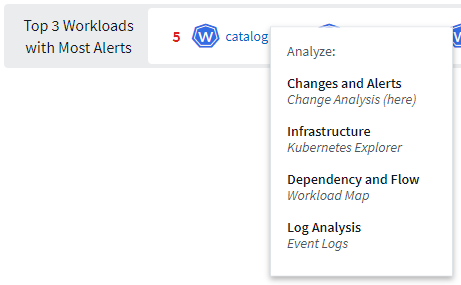
The top 3 workloads with the most alerts are next. The number in red next to each workload indicates the number of alerts related to that workload. Click the workload link to explore through your Infrastructure (Kubernetes Explorer), Dependencies (Workload Map), or Log Analysis (Event Logs).
Detail Panel
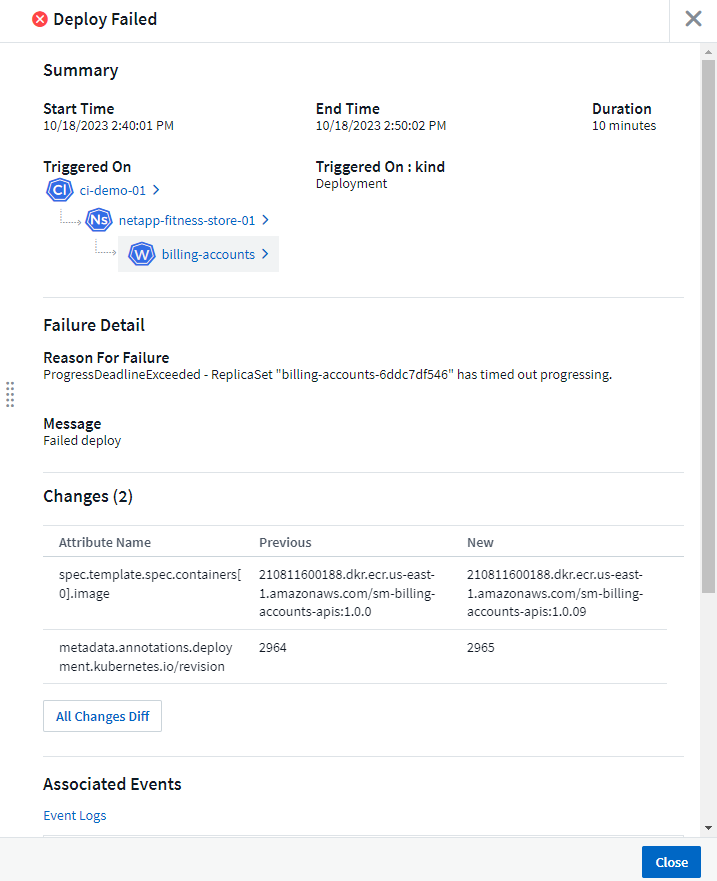
Selecting a change in the list opens a panel describing the change in more detail. For example, selecting a failed Deploy shows a summary of the Deploy, with start and end times, duration, and where the deploy was triggered, with links to explore those resources. It also displays the reason for the failure, any related changes, and any associated events.
Selecting an Alert similarly provides details about the alert, including the monitor that triggered the alert as well as a chart showing a visual timeline for the alert.