Alerting with Monitors
 Suggest changes


Configure monitors to track performance thresholds, log events, and anomalies across your infrastructure resources. Create custom alerts for metrics like node write latency, storage capacity, or application performance, and receive notifications when these conditions are met.
Monitors allow you to set thresholds on metrics generated by "infrastructure" objects such as storage, VM, EC2, and ports, as well as for "integration" data such as those collected for Kubernetes, ONTAP advanced metrics, and Telegraf plugins. These metric monitors alert you when warning-level or critical-level thresholds are crossed.
You can also create monitors to trigger warning-, critical-, or informational-level alerts when specified log events are detected.
Data Infrastructure Insights provides a number of System-Defined Monitors as well, based on your environment.
Security Best Practice
Data Infrastructure Insights alerts are designed to highlight data points and trends on your tenant, and Data Infrastructure Insights allows you to enter any valid email address as an alert recipient. If you are working in a secure environment, be especially mindful of who is receiving the notification or otherwise has access to the alert.
Metric or Log Monitor?
-
From the Data Infrastructure Insights menu, click Alerts > Manage Monitors
The Monitors list page is displayed, showing currently configured monitors.
-
To modify an existing monitor, click the monitor name in the list.
-
To add a monitor, Click + Monitor.
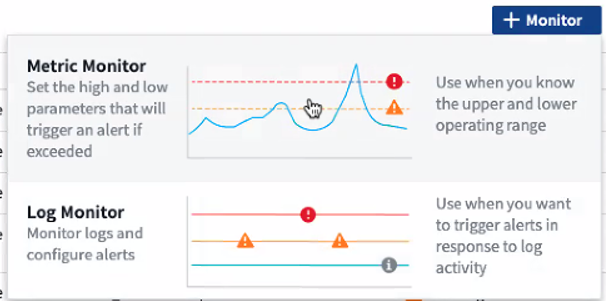
When you add a new monitor, you are prompted to create a Metric Monitor or a Log Monitor.
-
Metric monitors alert on infrastructure- or performance-related triggers
-
Log monitors alert on log-related activity
After you choose your monitor type, the Monitor Configuration dialog is displayed. Configuration varies depending on which type of monitor you are creating.
-
Metric Monitor
-
In the drop-down, search for and choose an object type and metric to monitor.
You can set filters to narrow down which object attributes or metrics to monitor.
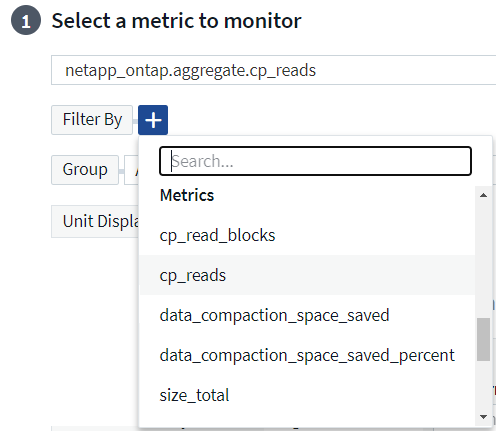
When working with integration data (Kubernetes, ONTAP Advanced Data, etc.), metric filtering removes the individual/unmatched data points from the plotted data series, unlike infrastructure data (storage, VM, ports etc.) where filters work on the aggregated value of the data series and potentially remove the entire object from the chart.
Metric monitors apply to Inventory objects such as storage, switch, host, vm, etc., as well as integration metrics such as ONTAP Advanced or Kubernetes data. When monitoring inventory objects, note that you cannot select a "Group By" method. However, grouping is allowed when monitoring integration data.
Multi-Condition monitors
You may choose to further refine your metric monitor by adding a second condition. Simply expand the "+Add Secondary Metric Condition" prompt and configure the additional condition.

The monitor will alert if both conditions are met.
Note that you can only "AND" a second condition; you cannot choose to alert on one condition OR the other.
Define the Conditions of the Monitor.
-
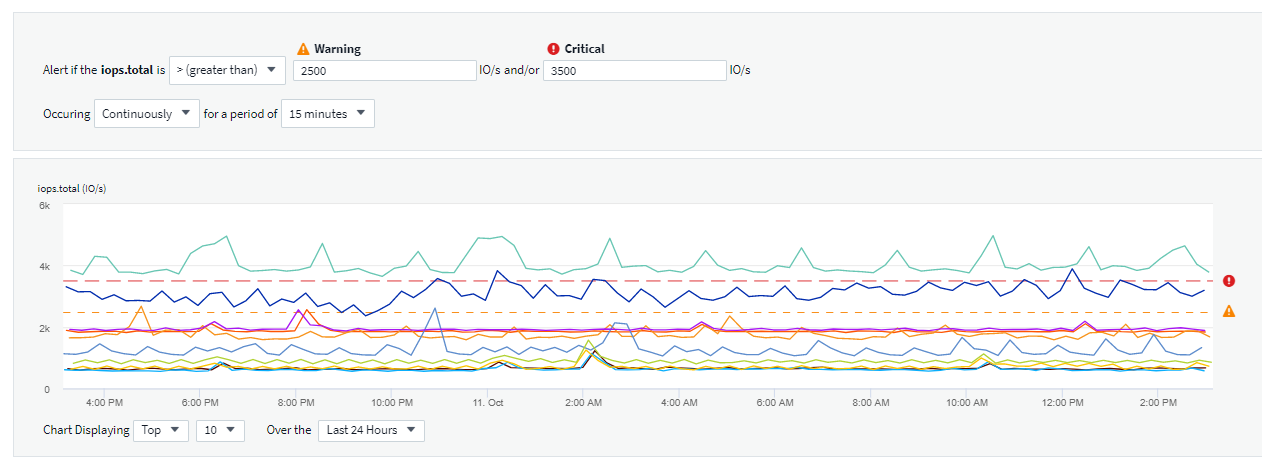
After choosing the object and metric to monitor, set the Warning-level and/or Critical-level thresholds.
-
For the Warning level, enter 200 for our example. The dashed line indicating this Warning level displays in the example graph.
-
For the Critical level, enter 400. The dashed line indicating this Critical level displays in the example graph.
The graph displays historical data. The Warning and Critical level lines on the graph are a visual representation of the Monitor, so you can easily see when the Monitor might trigger an alert in each case.
-
For the occurrence interval, choose Continuously for a period of 15 Minutes.
You can choose to trigger an alert the moment a threshold is breached, or wait until the threshold has been in continuous breach for a period of time. In our example, we do not want to be alerted every time the Total IOPS peaks above the Warning or Critical level, but only when a monitored object continuously exceeds one of these levels for at least 15 minutes.
Define the alert resolution behavior
You can choose how a metric monitor alert is resolved. You are presented with two choices:
-
Resolve when the metric returns to the acceptable range.
-
Resolve when the metric is within the acceptable range for a specified amount of time, from 1 minute to 7 days.
Log Monitor
When creating a Log monitor, first choose which log to monitor from the available log list. You can then filter based on the available attributes as above. You can also choose one or more "Group By" attributes.

|
The Log Monitor filter cannot be empty. |

Define the alert Behavior
You can create the monitor to alert with a severity level of Critical, Warning, or Informational, when the conditions you defined above occur once (i.e. immediately), or wait to alert until the conditions occur 2 times or more.
Define the alert resolution behavior
You can choose how a log monitor alert is resolved. You are presented with three choices:
-
Resolve instantly: The alert is immediately resolved with no further action needed
-
Resolve based on time: The alert is resolved after the specified time has passed
-
Resolve based on log entry: The alert is resolved when a subsequent log activity has occurred. For example, when an object is logged as "available".

Anomaly Detection Monitor
-
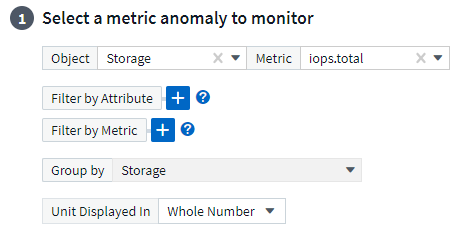
In the drop-down, search for and choose an object type and metric to monitor.
You can set filters to narrow down which object attributes or metrics to monitor.
Define the Conditions of the Monitor.
-
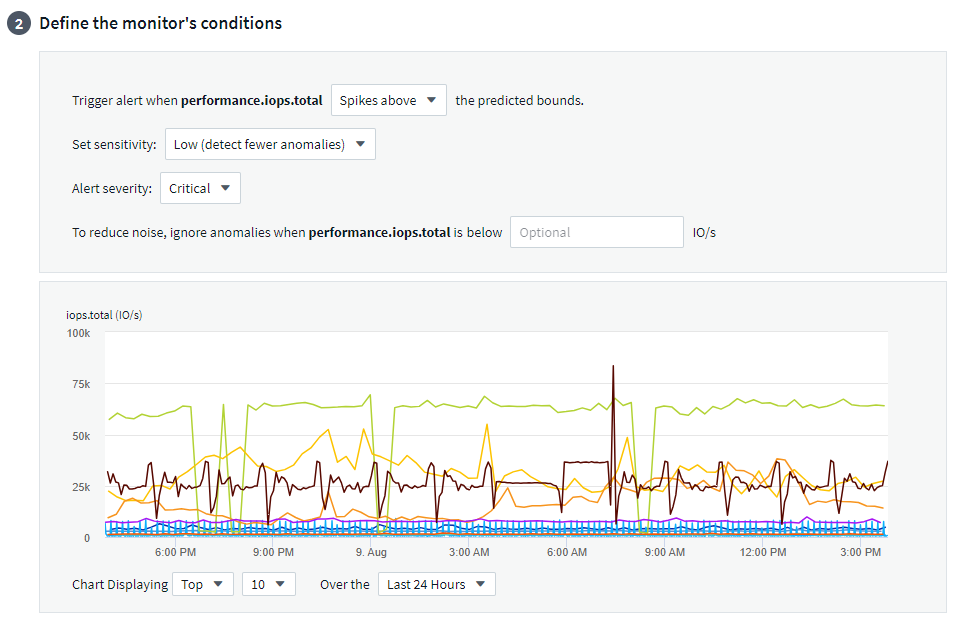
After choosing the object and metric to monitor, yous et the conditions under which an anomaly is detected.
-
Choose whether to detect an anomaly when the chosen metric spikes above the predicted bounds, drops below those bounds, or spikes above or drops below the bounds.
-
Set the sensitivity of detection. Low (fewer anomalies are detcted), Medium, or High (more anomalies are detected).
-
Set the alerts to be wither Warning or Critical.
-
If desired, you can choose to reduce noise, ignoring anomalies when the chosen metric is below a threshold that you set.
-
Select notification type and recipients
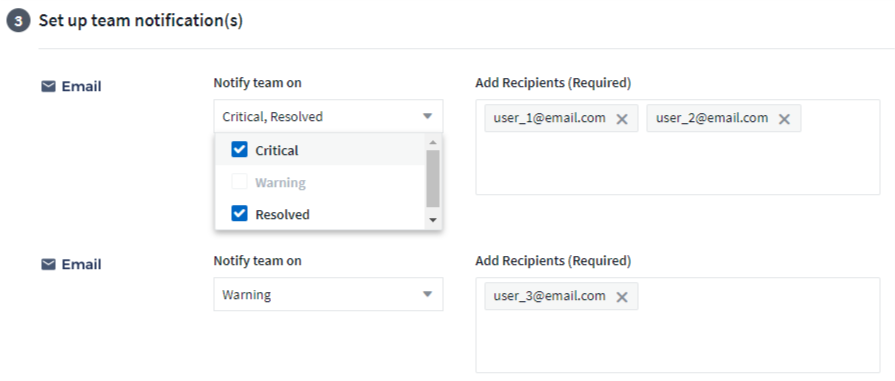
In the Set up team notification(s) section, you can choose whether to alert your team via email or Webhook.

Alerting via Email:
Specify the email recipients for alert notifications. If desired, you can choose different recipients for warning or critical alerts.
Alerting via Webhook:
Specify the webhook(s) for alert notifications. If desired, you can choose different webhooks for warning or critical alerts.


|
ONTAP Data Collector notifications take precedence over any specific Monitor notifications that are relevant to the cluster/data collector. The recipient list you set for the Data Collector itself will receive the data collector alerts. If there are no active data collector alerts, then monitor-generated alerts will be sent to specific monitor recipients. |
Setting Corrective Actions or Additional Information
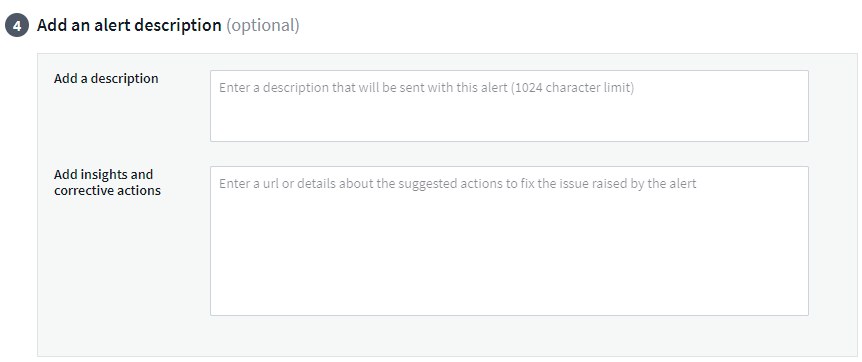
You can add an optional description as well as additional insights and/or corrective actions by filling in the Add an Alert Description section. The description can be up to 1024 characters and will be sent with the alert. The insights/corrective action field can be up to 67,000 characters and will be displayed in the summary section of the alert landing page.
In these fields you can provide notes, links, or steps to take to correct or otherwise address the alert.
You can add any object attribute (for example, storage name) as a parameter to an alert description. For example, you can set parameters for volume name and storage name in a description like: "High Latency for Volume: %%relatedObject.volume.name%%, Storage: %%relatedObject.storage.name%%".
Save your Monitor
-
If desired, you can add a description of the monitor.
-
Give the Monitor a meaningful name and click Save.
Your new monitor is added to the list of active Monitors.
Monitor List
The Monitor page lists the currently configured monitors, showing the following:
-
Monitor Name
-
Status
-
Object/metric being monitored
-
Conditions of the Monitor
You can choose to temporarily pause monitoring of an object type by clicking the menu to the right of the monitor and selecting Pause. When you are ready to resume monitoring, click Resume.
You can copy a monitor by selecting Duplicate from the menu. You can then modify the new monitor and change the object/metric, filter, conditions, email recipients, etc.
If a monitor is no longer needed, you can delete it by selecting Delete from the menu.
Monitor Groups
Grouping allows you to view and manage related monitors. For example, you can have a monitor group dedicated to the storage on your tenant, or monitors relevant to a certain recipient list.
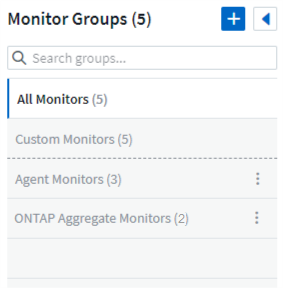
The following monitor groups are shown. The number of monitors contained in a group is shown next to the group name.
-
All Monitors lists all monitors.
-
Custom Monitors lists all user-created monitors.
-
Suspended Monitors will list any system monitors that have been suspended by Data Infrastructure Insights.
-
Data Infrastructure Insights will also show a number of System Monitor Groups, which will list one or more groups of system-defined monitors, including ONTAP Infrastructure and Workload monitors.

|
Custom monitors can be paused, resumed, deleted, or moved to another group. System-defined monitors can be paused and resumed but can not be deleted or moved. |
Suspended Monitors
This group will only be shown if Data Infrastructure Insights has suspended one or more monitors. A monitor may be suspended if it is generating excessive or continuous alerts. If the monitor is a custom monitor, modify the conditions to prevent the continuous alerting, and then resume the monitor. The monitor will be removed from the Suspended Monitors group when the issue causing the suspension is resolved.
System-Defined Monitors
These groups will show monitors provided by Data Infrastructure Insights, as long as your environment contains the devices and/or log availability required by the monitors.
System-Defined monitors cannot be modified, moved to another group, or deleted. However, you can duplicate a system monitor and modify or move the duplicate.
System monitors may include monitors for ONTAP Infrastructure (storage, volume, etc.) or Workloads (i.e. log monitors), or other groups. NetApp is constantly evaluating customer need and product functionality, and will update or add to system monitors and groups as needed.
Custom Monitor Groups
You can create your own groups to contain monitors based on your needs. For example, you may want a group for all of your storage-related monitors.
To create a new custom monitor group, click the "+" Create New Monitor Group button. Enter a name for the group and click Create Group. An empty group is created with that name.
To add monitors to the group, go to the All Monitors group (recommended) and do one of the following:
-
To add a single monitor, click the menu to the right of the monitor and select Add to Group. Choose the group to which to add the monitor.
-
Click on the monitor name to open the monitor's edit view, and select a group in the Associate to a monitor group section.

Remove monitors by clicking on a group and selecting Remove from Group from the menu. You can not remove monitors from the All Monitors or Custom Monitors group. To delete a monitor from these groups, you must delete the monitor itself.

|
Removing a monitor from a group does not delete the monitor from Data Infrastructure Insights. To completely remove a monitor, select the monitor and click Delete. This also removes it from the group to which it belonged and it is no longer available to any user. |
You can also move a monitor to a different group in the same manner, selecting Move to Group.
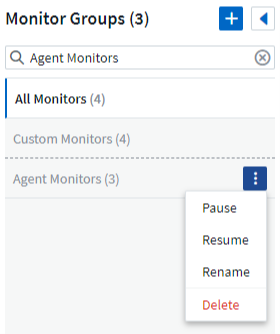
To pause or resume all monitors in a group at once, select the menu for the group and click Pause or Resume.
Use the same menu to rename or delete a group. Deleting a group does not delete the monitors from Data Infrastructure Insights; they are still available in All Monitors.
System-Defined Monitors
Data Infrastructure Insights includes a number of system-defined monitors for both metrics and logs. The system monitors available are dependent on the data collectors present on your tenant. Because of that, the monitors available in Data Infrastructure Insights may change as data collectors are added or their configurations changed.
View the System-Defined Monitors page for descriptions of monitors included with Data Infrastructure Insights.


