Docker Data Collector
 Suggest changes


Data Infrastructure Insights uses this data collector to gather metrics from Docker.
Installation
-
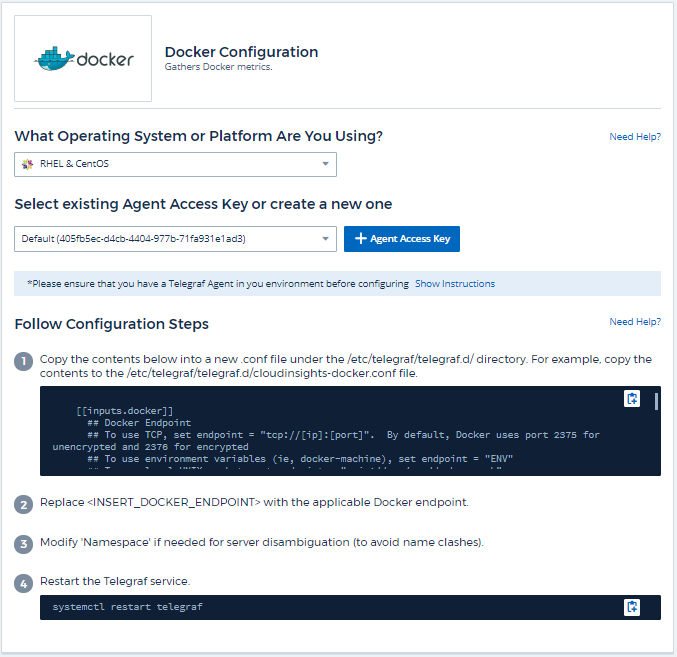
From Observability > Collectors, click +Data Collector. Choose Docker.
If you haven't configured an Agent for collection, you are prompted to install an agent on your tenant.
If you have an agent already configured, select the appropriate Operating System or Platform and click Continue.
-
Follow the instructions in the Docker Configuration screen to configure the data collector. The instructions vary depending on the type of Operating System or Platform you are using to collect data.

Setup
The Telegraf input plugin for Docker collects metrics through a specified UNIX socket or a TCP endpoint.
Compatibility
Configuration was developed against Docker version 1.12.6.
Setting Up
Accessing Docker through a UNIX socket
If the Telegraf agent is running on baremetal, add the telegraf Unix user to the docker Unix group by running the following:
sudo usermod -aG docker telegraf
If the Telegraf agent is running within a Kubernetes pod, expose the Docker Unix socket by mapping the socket into the pod as a volume and then mounting that volume to /var/run/docker.sock. For example, add the following to the PodSpec:
volumes:
...
- name: docker-sock
hostPath:
path: /var/run/docker.sock
type: File
Then, add the following to the Container:
volumeMounts:
...
- name: docker-sock
mountPath: /var/run/docker.sock
Note that the Data Infrastructure Insights installer provided for the Kubernetes platform takes care of this mapping automatically.
Access Docker through a TCP endpoint
By default, Docker uses port 2375 for unencrypted access and port 2376 for encrypted access.
Objects and Counters
The following objects and their counters are collected:
| Object: | Identifiers: | Attributes: | Datapoints: |
|---|---|---|---|
Docker Engine |
Namespace |
Node Name |
Memory |
Docker Container |
Namespace |
Kubernetes Container Hash |
Memory Active Anonymous |
Docker Container Block IO |
Namespace |
Kubernetes Container Hash |
IO Service Bytes Recursive Async |
Docker Container Network |
Namespace |
Container Image |
RX Dropped |
Docker Container CPU |
Namespace |
Kubernetes Container Hash |
Throttling Periods |
Troubleshooting
| Problem: | Try this: |
|---|---|
I do not see my Docker metrics in Data Infrastructure Insights after following the instructions on the configuration page. |
Check the Telegraf agent logs to see if it reports the following error: |
Additional information may be found from the Support page.


