Kubernetes Network Performance Monitoring and Map
 Suggest changes
The Kubernetes Network Performance Monitoring and Map feature simplifies troubleshooting by mapping dependencies between services (also called workloads), and provides real-time visibility into network performance latencies and anomalies to identify performance issues before they affect users.
This capability helps organizations reduce overall costs by analyzing and auditing Kubernetes traffic flows.
Key Features:
• The Workload Map presents Kubernetes workload dependencies and flows and highlights network and performance issues.
• Monitor network traffic between Kubernetes pods, workloads, and nodes; identifies the source of traffic and latency problems.
• Reduce overall costs by analyzing ingress, egress, cross-region, and cross-zone network traffic.
Pre-Requisites
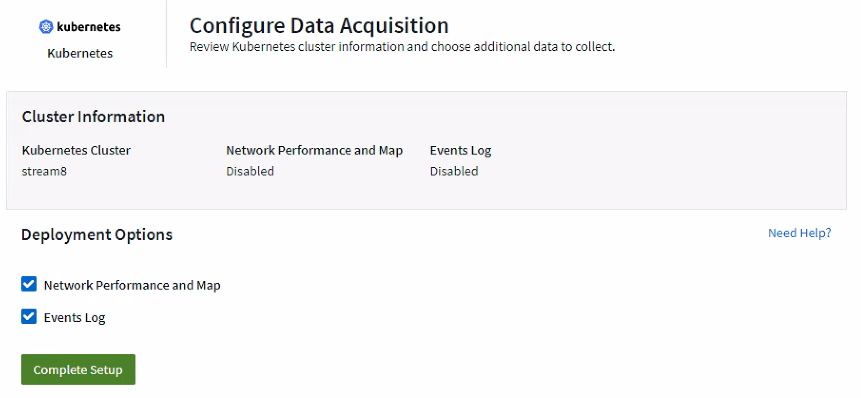
Before you can use the Kubernetes Network Performance Monitoring and Map, you must have configured the NetApp Kubernetes Monitoring Operator to enable this option. During deployment of the Operator, select the "Network Performance and Map" checkbox to enable. You can also enable this option by navigating to a Kubernetes landing page and selecting "Modify Deployment".
Monitors
The Workload Map uses monitors to derive information. Data Infrastructure Insights provides a number of default Kubernetes Monitors (note that these may be Paused by default. You can Resume (i.e. enable) the monitors you want), or you can create custom monitors for kubernetes objects, which the Workload Map will also use.
You can create Data Infrastructure Insights metric alerts on any of the object types below. Make sure the data is grouped by the default object type.
-
kubernetes.workload
-
kubernetes.daemonset
-
kubernetes.deployment
-
kubernetes.cronjob
-
kubernetes.job
-
kubernetes.replicaset
-
kubernetes.statefulset
-
kubernetes.pod
-
kubernetes.network_traffic_l4
The Map
The Map shows services/workloads and their relationships to each other. Arrows show directions of traffic. Hovering over a workload displays summary information for that workload, as you can see in this example:
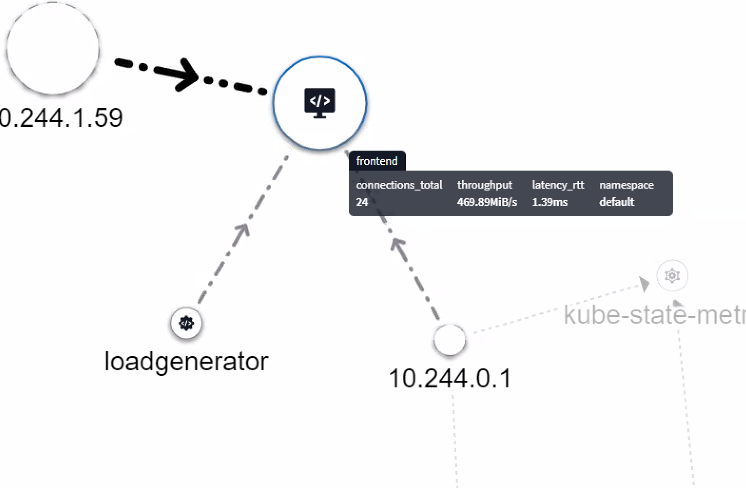
Icons within the circles represent different service types. Note that icons are only visible if the underlying objects have labels.
![]()
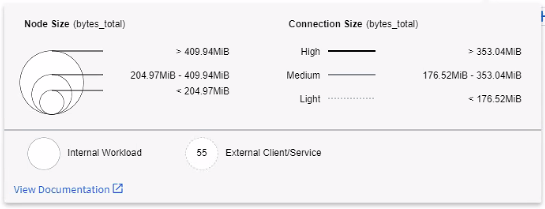
The size of each circle indicates node size. Note that these sizes are relative, your browser zoom level or screen size may affect actual circle sizes. In the same way, the traffic line style gives you an at-a-glance view of the connection size; bold solid lines are high traffic, while light dotted lines are lower traffic.
Numbers inside the circles are the number of external connections currently being processed by the service.
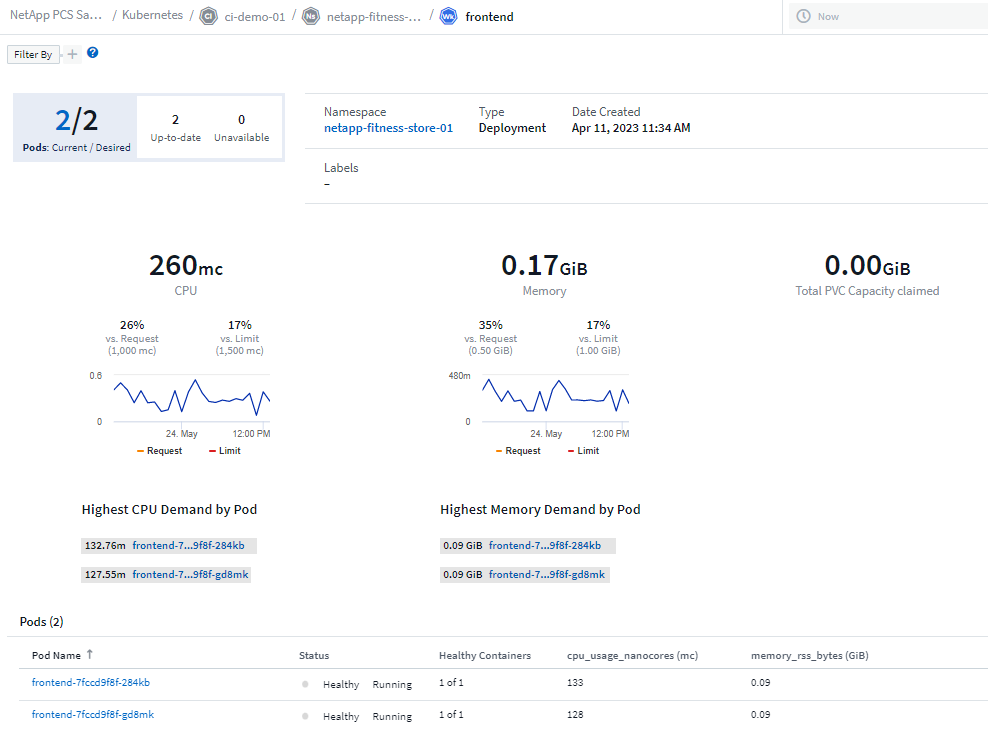
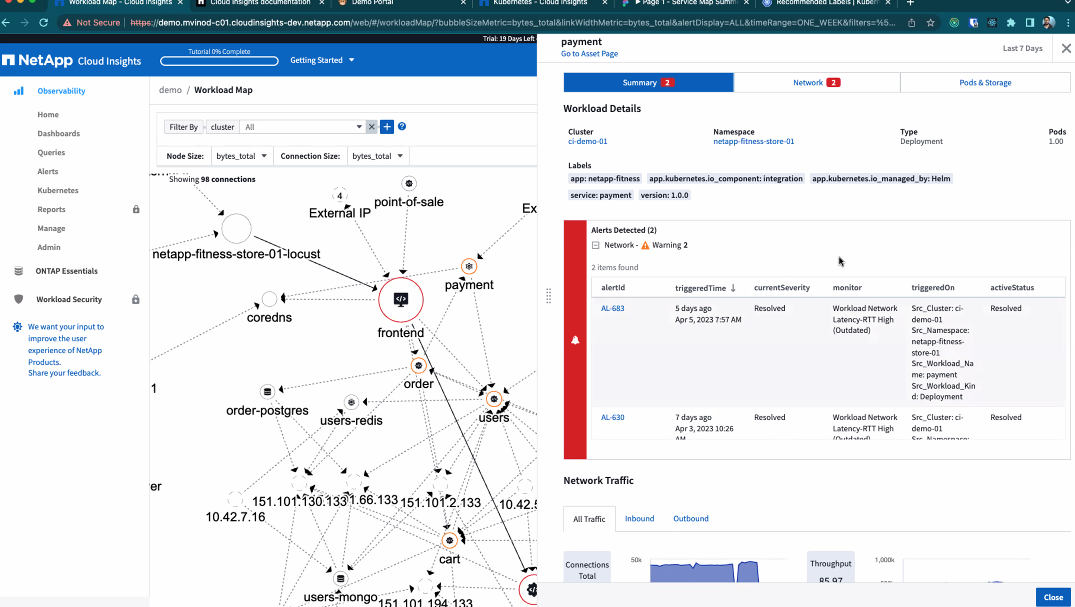
Workload Details and Alerts
Circles displayed in color indicate a warning- or critical-level alert for the workload. Hover over the circle for a summary of the issue, or click on the circle to open a slideout panel with more detail.
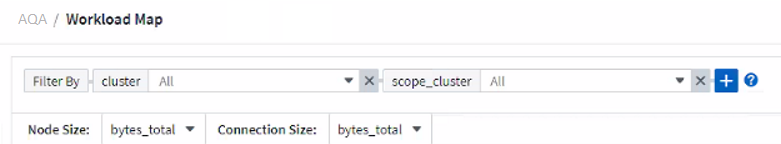
Finding and Filtering
As with other Data Infrastructure Insights features, you can easily set filters to focus on the specific objects or workload attributes you want.
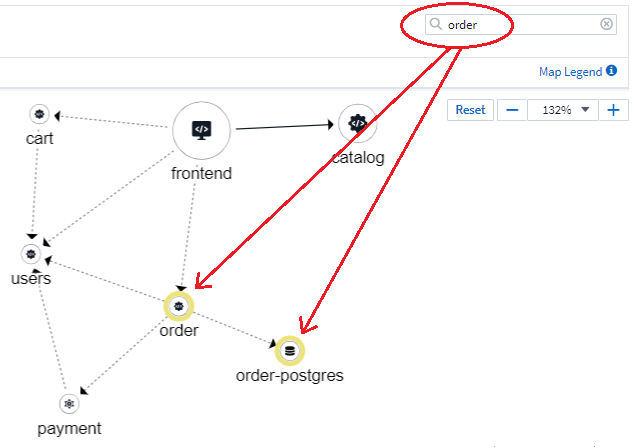
Likewise, typing a string in the Find field will highlight matching workloads.
Workload Labels
Workload labels are necessary if you want the Map to identify the types of workloads displayed (i.e. the circle icons). Labels are derived as follows:
-
Name of the service/application running in generic terms
-
If the source is a pod:
-
Label is derived from the workload label of the pod
-
Expected label on the workload: app.kubernetes.io/component
-
Label name reference: https://kubernetes.io/docs/concepts/overview/working-with-objects/common-labels/
-
Recommended labels:
-
frontend
-
backend
-
database
-
cache
-
queue
-
kafka
-
-
-
If the source is external to the kubernetes cluster:
-
Data Infrastructure Insights will attempt to parse the DNS resolved name to extract the service type.
For example, with a DNS resolved name of s3.eu-north-1.amazonaws.com, the resolved name is parsed to get s3 as the service type.
-
Dive Deep
Right-clicking on a workload presents you with additional options to explore further. For example, from here you can zoom in to view the connections for that workload.
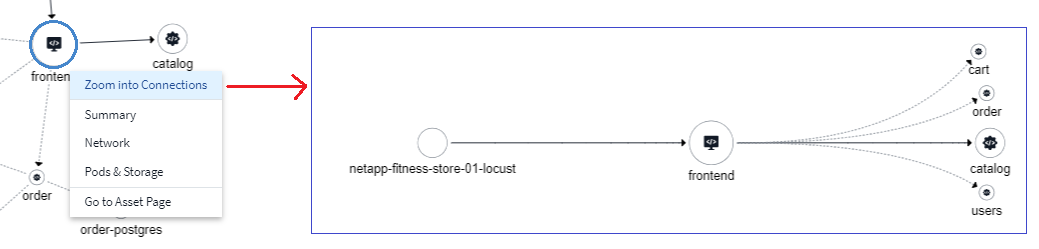
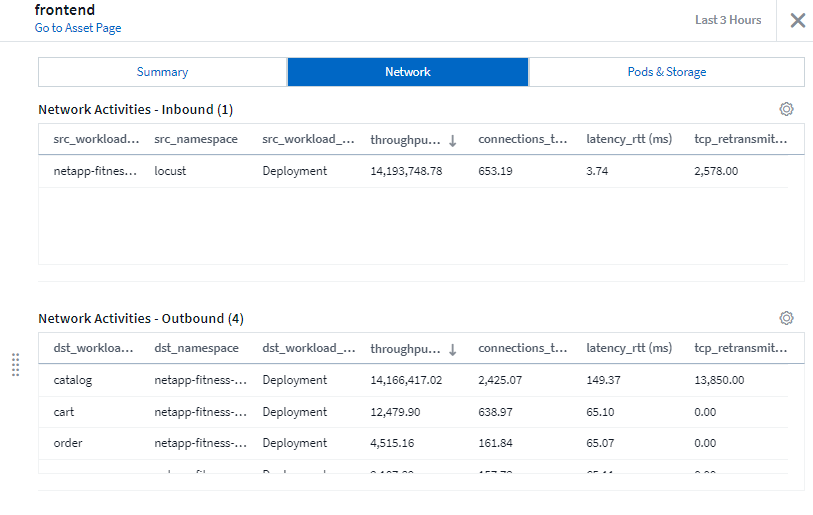
Or you can open the detail slideout panel to directly view the Summary, Network, or Pod & Storage tab.
Finally, selecting Go to Asset Page will open the detailed asset landing page for the workload.