

Viewing and Managing Alerts from Monitors
 Suggest changes
Data Infrastructure Insights displays alerts when monitored thresholds are exceeded.

|
Monitors and Alerting is available in Data Infrastructure Insights Standard Edition and higher. |
Viewing and Managing Alerts
To view and manage alerts, do the following.
-
Navigate to the Alerts > All Alerts page.
-
A list of up to the most recent 1,000 alerts is displayed. You can sort this list on any field by clicking the column header for the field. The list displays the following information. Note that not all of these columns are displayed by default. You can select columns to display by clicking on the "gear" icon:
-
Alert ID: System-generated unique alert ID
-
Triggered Time: The time at which the relevant Monitor triggered the alert
-
Current Severity (Active alerts tab): The current severity of the active alert
-
Top Severity (Resolved alerts tab); The maximum severity of the alert before it was resolved
-
Monitor: The monitor configured to trigger the alert
-
Triggered On: The object on which the monitored threshold was breached
-
Status: Current alert status, New or In Process
-
Active Status: Active or Resolved
-
Condition: The threshold condition that triggered the alert
-
Metric: The object's metric on which the monitored threshold was breached
-
Monitor Status: Current status of the monitor that triggered the alert
-
Has Corrective Action: The alert has suggested corrective actions. Open the alert page to view these.
-
You can manage an alert by clicking the menu to the right of the alert and choosing one of the following:
-
In Process to indicate that the alert is under investigation or otherwise needs to be kept open
-
Dismiss to remove the alert from the list of active alerts.
You can manage multiple alerts by selecting the checkbox to the left of each Alert and clicking Change Selected Alerts Status.
Clicking on an Alert ID opens the Alert Detail Page.
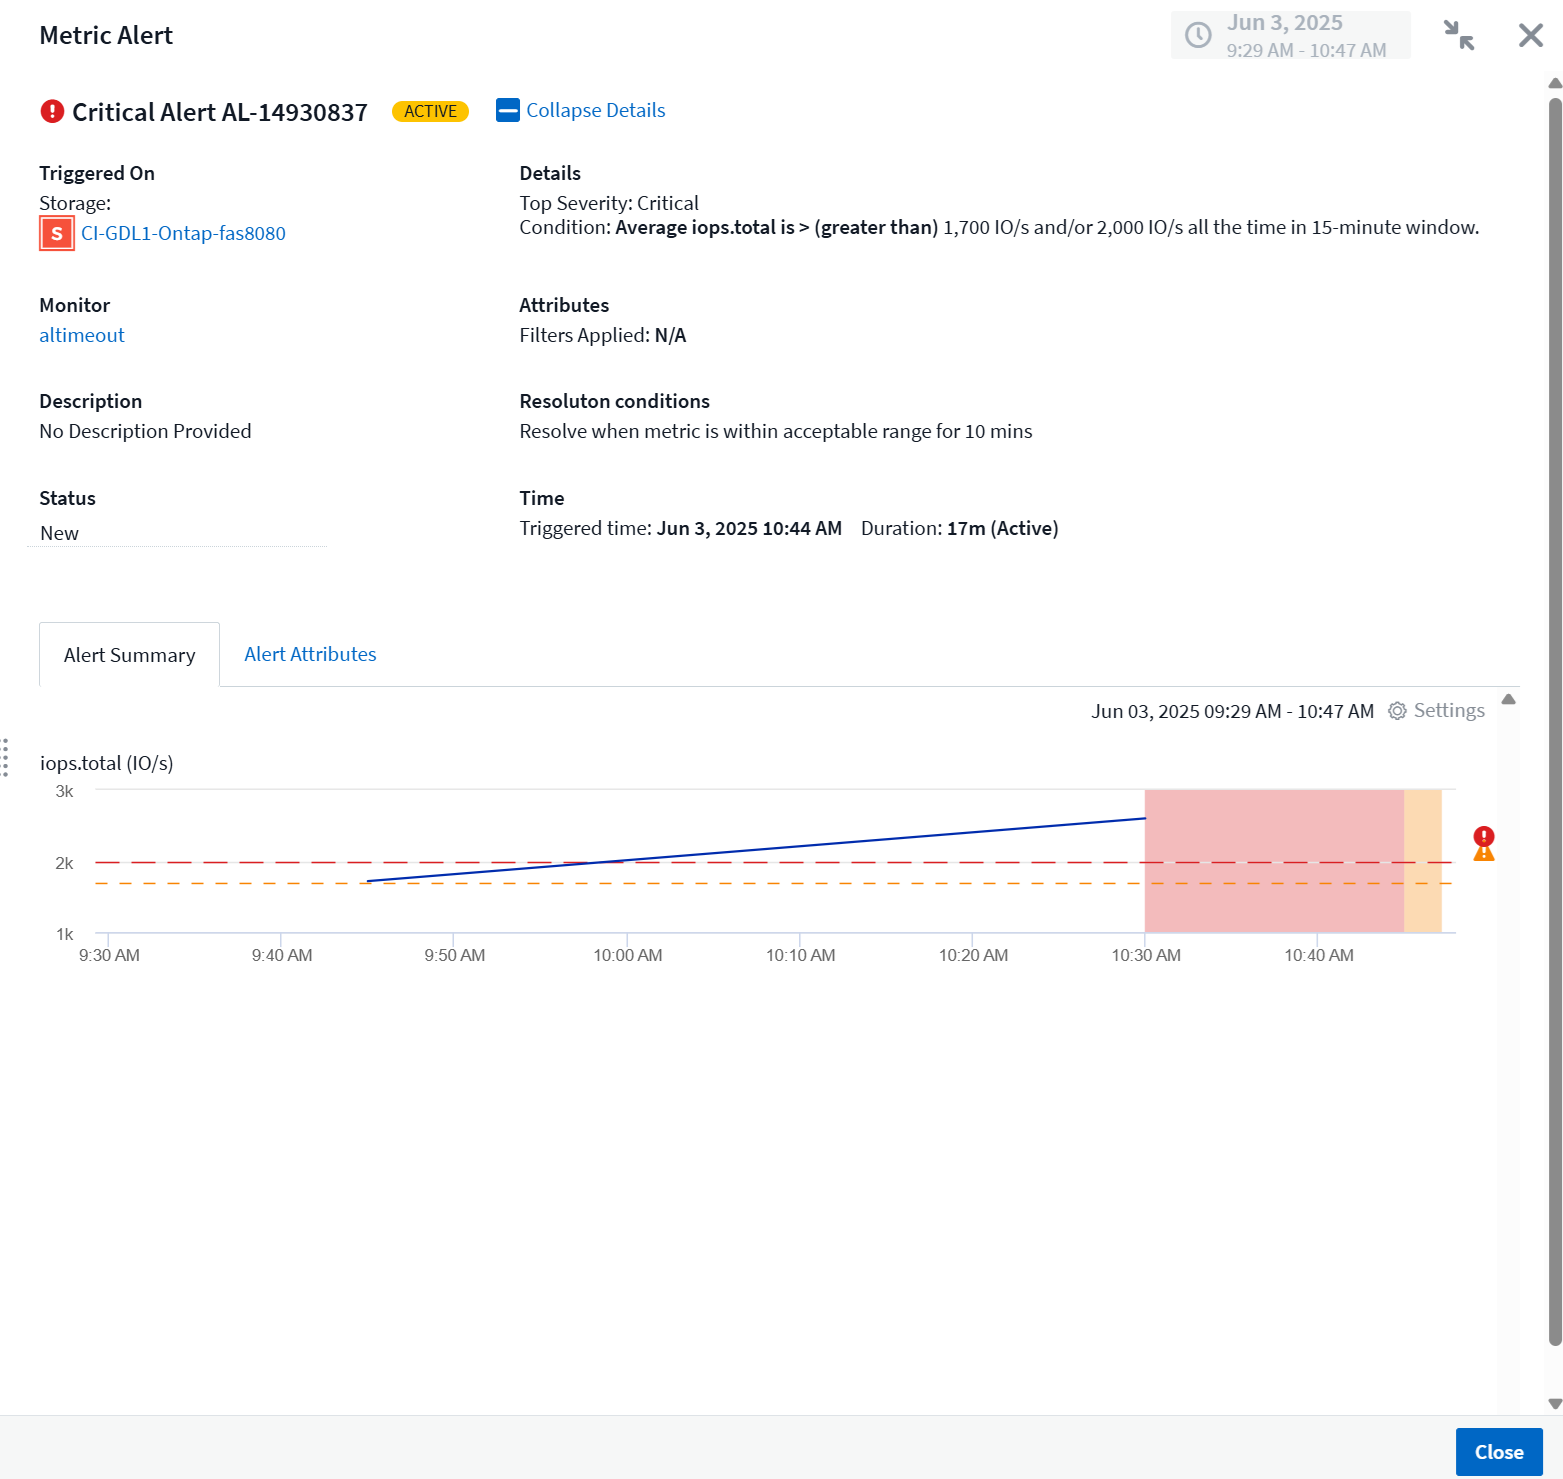
Alert Detail Panel
Select any alert row to open the alert's detail panel. The alert detail panel provides additional detail about the alert, including a Summary, a Performance section showing graphs related to the object's data, any Related Assets, and Comments entered by alert investigators.
Alerts When Data Is Missing
In a realtime system such as Data Infrastructure Insights, to trigger the analysis of a Monitor to decide if an Alert should be generated, we rely on one of two things:
-
the next datapoint to arrive
-
a timer to fire when there is no datapoint and you have waited long enough
As is the case with slow data arrival—or no data arrival—the timer mechanism needs to take over as the data arrival rate is insufficient to trigger alerts in "real time." So the question typically becomes "How long do I wait before I close the analysis window and look at what I have?" If you wait too long then you are not generating the alerts fast enough to be useful.
If you have a Monitor with a 30-minute window that notices that a condition is violated by the last data point before a long-term loss-of-data, an Alert will be generated because the Monitor received no other information to use to confirm a recovery of the metric or notice that the condition persisted.
"Permanently Active" Alerts
It is possible to configure a monitor in such a way for the condition to always exist on the monitored object—for example, IOPS > 1 or latency > 0. These are often created as 'test' monitors and then forgotten. Such monitors create alerts that stay permanently open on the constituent objects, which can cause system stress and stability issues over time.
To prevent this, Data Infrastructure Insights will automatically close any "permanently active" alert after 7 days. Note that the underlying monitor conditions may (probably will) continue to exist, causing a new alert to be issued almost immediately, but this closing of "always active" alerts alleviates some of the system stress that can otherwise occur.