Data Infrastructure Insights API
 Suggest changes


The Data Infrastructure Insights API enables NetApp customers and independent software vendors (ISVs) to integrate Data Infrastructure Insights with other applications, such as CMDB's or other ticketing systems.
Your Data Infrastructure Insights feature set role will determine which APIs you can access. User and Guest roles have fewer privileges than Administrator role. For example, if you have Administrator role in Monitor and Optimize, but User role in Reporting, you can manage all API types except Data Warehouse.
Requirements for API Access
-
An API Access Token model is used to grant access.
-
API Token management is performed by Data Infrastructure Insights users with the Administrator role.
API Documentation (Swagger)
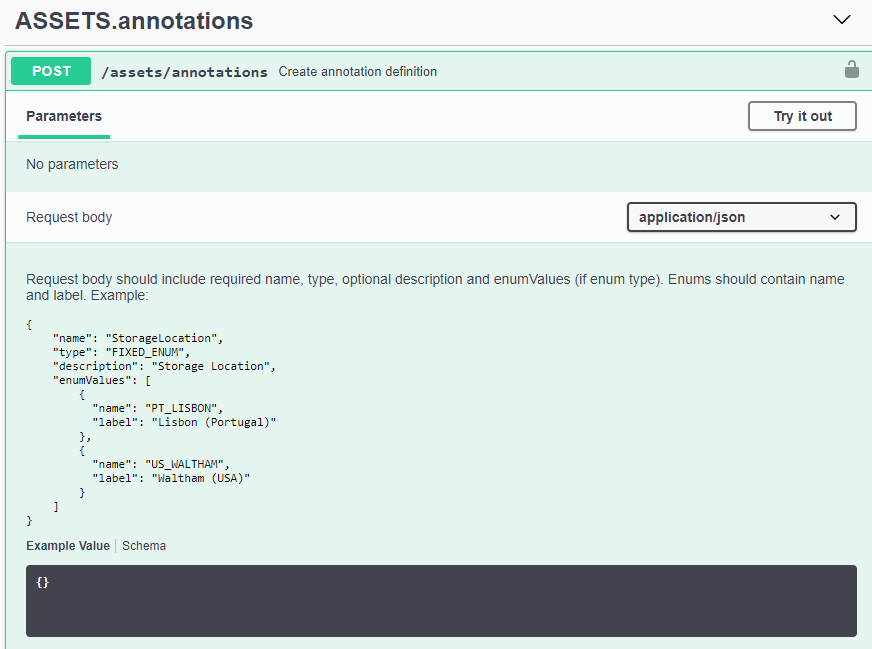
The latest API information is found by logging in to Data Infrastructure Insights and navigating to Admin > API Acccess. Click the API Documentation link.

The API Documentation is Swagger-based, which provides a brief description and usage information for the API, and allows you to try it out in your tenant. Depending on your user role and/or Data Infrastructure Insights edition, the API types available to you may vary.
API Access Tokens
Before using the Data Infrastructure Insights API, you must create one or more API Access Tokens. Access tokens are used for specified API types, and can grant read and/or write permissions. You can also set the expiration for each access token. All APIs under the specified types are valid for the access token. Each token is void of a username or password.
To create an Access Token:
-
Click Admin > API Access
-
Click +API Access Token
-
Enter Token Name
-
Select API Types
-
Specify the permissions granted for this API access
-
Specify Token Expiration
-

|
Your token will only be available for copying to the clipboard and saving during the creation process. Tokens can not be retrieved after they are created, so it is highly recommended to copy the token and save it in a secure location. You will be prompted to click the Copy API Access Token button before you can close the token creation screen. |
You can disable, enable, and revoke tokens. Tokens that are disabled can be enabled.
Tokens grant general purpose access to APIs from a customer perspective; managing access to APIs in the scope of their own tenant. Customer administrators may grant and revoke these tokens without direct involvement from Data Infrastructure Insights back end personnel.
The application receives an Access Token after a user successfully authenticates and authorizes access, then passes the Access Token as a credential when it calls the target API. The passed token informs the API that the bearer of the token has been authorized to access the API and perform specific actions specified by the scope that was granted during authorization.
The HTTP header where the Access Token is passed is X-CloudInsights-ApiKey:.
For example, use the following to retrieve storages assets:
curl https://<tenant_host_name>/rest/v1/assets/storages -H 'X-CloudInsights-ApiKey:<API_Access_Token>'
Where <API_Access_Token> is the token you saved during API access creation.
See the swagger pages for examples specific to the API you wish to use.
API Type
The Data Infrastructure Insights API is category-based, and currently contains the following types:
-
ASSETS type contains asset, query, and search APIs. DII asset attributes and metrics are sometimes referred to as “odata”. The APIs for these are typically accessed through /rest/v1/asset or /rest/v1/query. See the API Swagger documentation for more information.
-
Assets: Enumerate top-level objects and retrieve a specific object or an object hierarchy.
-
Query: Retrieve and manage Data Infrastructure Insights queries.
-
Import: Import annotations or applications and assign them to objects
-
Search: Locate a specific object without knowing the object’s unique ID or full name.
-
-
DATA COLLECTION type is used to retrieve and manage data collectors.
-
DATA INGESTION type is used to retrieve and manage ingestion data and custom metrics, such as from Telegraf agents. These are sometimes referred to as “datalake” or “lake” metrics. The APIs for these typically accessed through /rest/v1/lake. See the API Swagger documentation for more information.
-
LOG INGESTION is used to retrieve and manage log data
Additional types and/or APIs may become available over time. You can find the latest API information in the API Swagger documentation.
Note that the API types to which a user has access depend also on the User Role they have in each Data Infrastructure Insights feature set (Observability, Workload Security, Reporting).
Inventory Traversal
This section describes how to traverse a hierarchy of Data Infrastructure Insights objects.
Top Level Objects
Individual objects are identified in requests by unique URL (called “self” in JSON) and require knowledge of object type and internal id. For some of the top level objects (Hosts, Storages, and so on), REST API provides access to the complete collection.
The general format of an API URL is:
https://<tenant>/rest/v1/<type>/<object>
For example, to retrieve all storages from a tenant named mysite.c01.cloudinsights.netapp.com, the request URL is:
https://mysite.c01.cloudinsights.netapp.com/rest/v1/assets/storages
Children and Related Objects
Top level objects, such as Storage, can be used to traverse to other children and related objects. For example, to retrieve all disks for a specific storage, concatenate the storage “self” URL with “/disks”, for example:
https://<tenant>/rest/v1/assets/storages/4537/disks
Expands
Many API commands support the expand parameter, which provides additional details about the object or URLs for related objects.
The one common expand parameter is expands. The response contains a list of all available specific expands for the object.
For example, when you request the following:
https://<tenant>/rest/v1/assets/storages/2782?expand=_expands
The API returns all available expands for the object as follows:
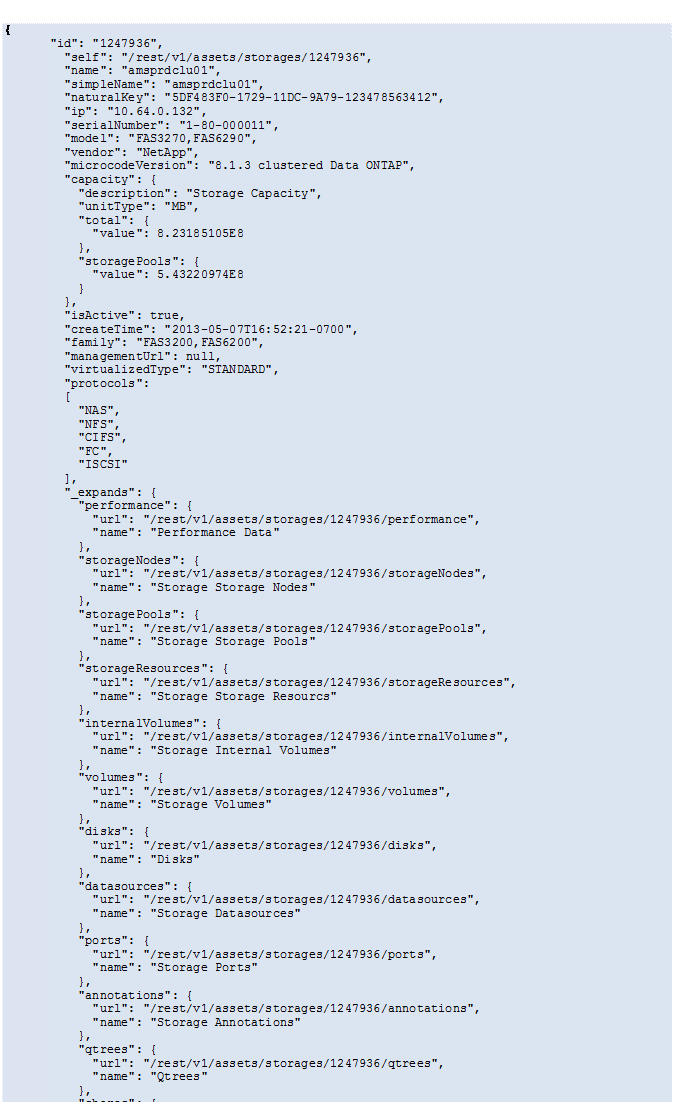
Each expand contains data, a URL, or both. The expand parameter supports multiple and nested attributes, for example:
https://<tenant>/rest/v1/assets/storages/2782?expand=performance,storageResources.storage
Expand allows you to bring in a lot of related data in one response. NetApp advises that you do not request too much information at one time; this can cause performance degradation.
To discourage this, requests for top-level collections cannot be expanded. For example, you cannot request expand data for all storage objects at once. Clients are required to retrieve the list of objects and then choose specific objects to expand.
Performance Data
Performance data is gathered across many devices as separate samples. Every hour (the default), Data Infrastructure Insights aggregates and summarizes performance samples.
The API allows access to both the samples and the summarized data. For an object with performance data, a performance summary is available as expand=performance. Performance history time series are available through nested expand=performance.history.
Examples of Performance Data objects include:
-
StoragePerformance
-
StoragePoolPerformance
-
PortPerformance
-
DiskPerformance
A Performance Metric has a description and type and contains a collection of performance summaries. For example, Latency, Traffic, and Rate.
A Performance Summary has a description, unit, sample start time, sample end time, and a collection of summarized values (current, min, max, avg, etc.) calculated from a single performance counter over a time range (1 hour, 24 hours, 3 days, and so on).
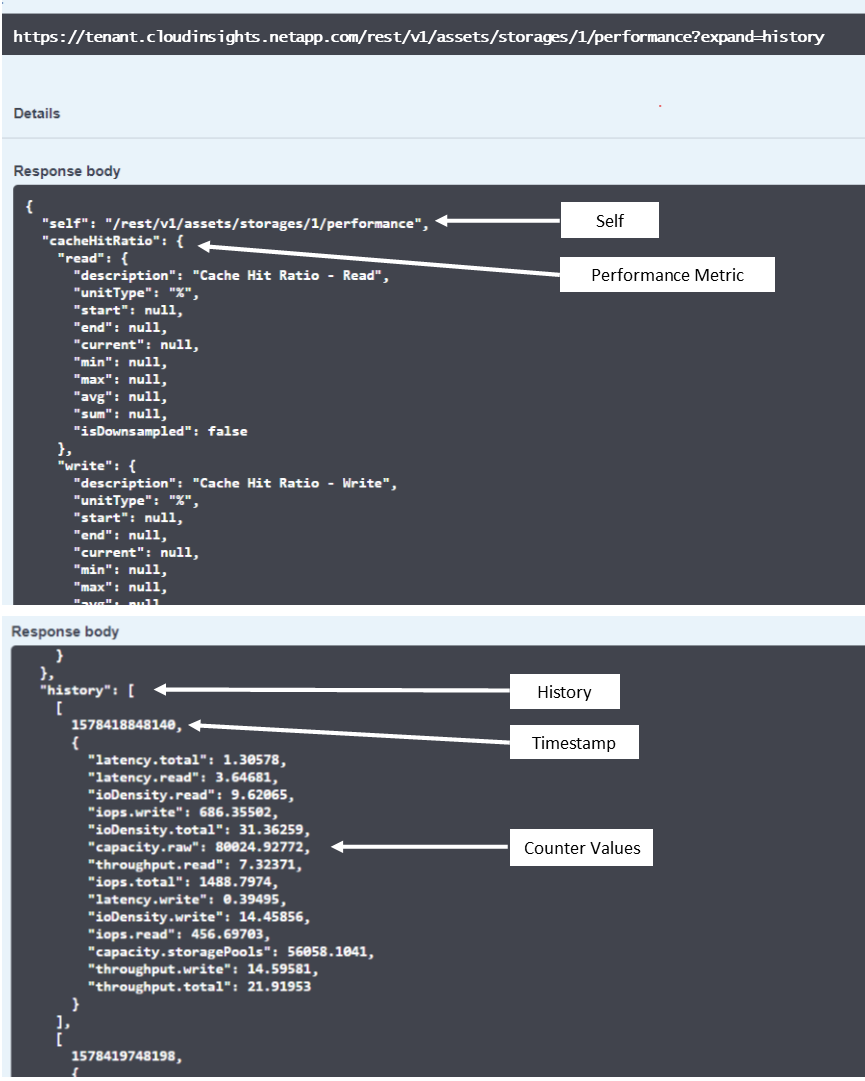
The resulting Performance Data dictionary has the following keys:
-
"self" is the object's unique URL
-
“history” is the list of pairs of timestamp and map of counters values
-
Every other dictionary key (“diskThroughput” and so on) is the name of a performance metric.
Each performance data object type has a unique set of performance metrics. For example, the Virtual Machine performance object supports “diskThroughput” as a performance metric. Each supported performance metric is of a certain “performanceCategory” presented in the metric dictionary. Data Infrastructure Insights supports several performance metric type listed later in this document. Each performance metric dictionary will also have the “description” field that is a human-readable description of this performance metric and a set of performance summary counter entries.
The Performance Summary counter is the summarization of performance counters. It presents typical aggregated values like min, max, and avg for a counter and also the latest observed value, time range for summarized data, unit type for counter and thresholds for data. Only thresholds are optional; the rest of attributes are mandatory.
Performance summaries are available for these types of counters:
-
Read – Summary for read operations
-
Write – Summary for write operations
-
Total – Summary for all operations. It may be higher than the simple sum of read and write; it may include other operations.
-
Total Max – Summary for all operations. This is the maximum total value in the specified time range.
Object Performance Metrics
The API can return detailed metrics for objects on your tenant, for example:
-
Storage Performance Metrics such as IOPS (Number of input/output requests per second), Latency, or Throughput.
-
Switch Performance Metrics, such as Traffic Utilization, BB Credit Zero data, or Port Errors.
See the API Swagger documentation for information on metrics for each object type.
Performance History Data
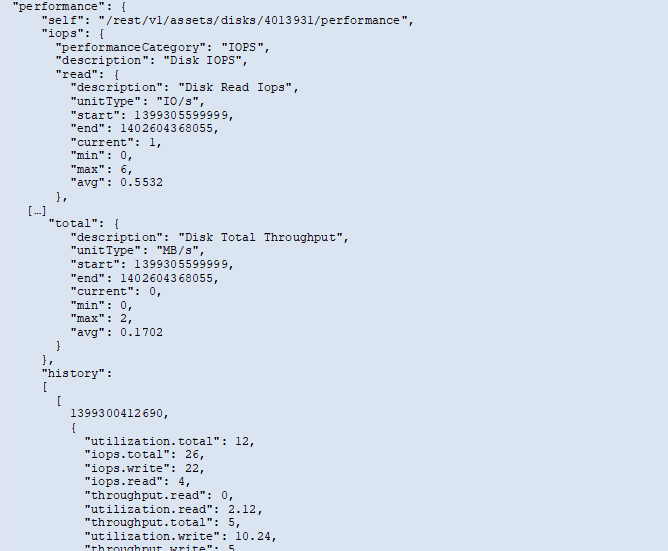
History data is presented in performance data as a list of timestamp and counter maps pairs.
History counters are named based on the performance metric object name. For example, the virtual machine performance object supports “diskThroughput” so the history map will contain keys named “diskThroughput.read”, “diskThroughput.write” and “diskThroughput.total”.

|
Timestamp is in UNIX time format. |
The following is an example of a performance data JSON for a disk:
Objects with Capacity Attributes
Objects with capacity attributes use basic data types and the CapacityItem for representation.
CapacityItem
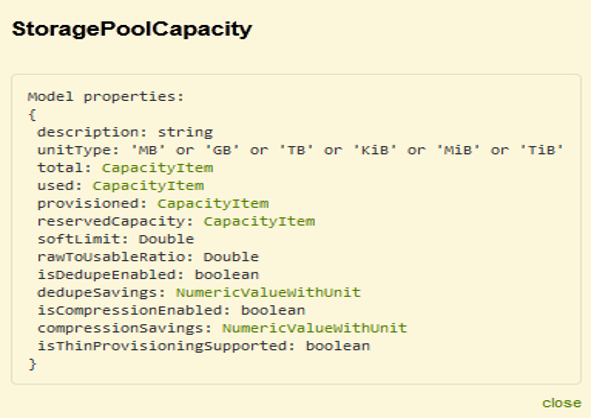
CapacityItem is a single logical unit of capacity. It has “value” and “highThreshold” in units defined by its parent object. It also supports an optional breakdown map that explains how the capacity value is constructed. For example, the total capacity of a 100 TB storagePool would be a CapacityItem with a value of 100. The breakdown may show 60 TB allocated for “data” and 40 TB for “snapshots”.
Note: “highThreshold” represents system defined thresholds for the corresponding metrics, which a client can use to generate alerts or visual cues on values that are out of acceptable configured ranges.
The following shows the capacity for StoragePools with multiple capacity counters:
Using Search to Look Up Objects
The search API is a simple entry point to the system. The only input parameter to the API is a free-form string and the resulting JSON contains a categorized list of results. Types are different asset types from the Inventory, such as storages, hosts, dataStores, and so on. Each type would contain a list of objects of the type that match the search criteria.
Data Infrastructure Insights is an extensible (wide open) solution that allows integrations with third party orchestration, business management, change control and ticketing systems as well as custom CMDB integrations.
Cloud Insight’s RESTful API is a primary point of integration that allows simple and effective movement of data as well as allows users to gain seamless access to their data.
Disabling or Revoking an API Token
To temporarily disable an API token, on the API token list page, click the "three dots" menu for the API, and select Disable. You can Re-enable the token at any time using the same menu and selecting Enable.
To permanently remove an API token, from the menu, select "Revoke". You cannot re-enable a revoked token; you must create a new token.

Rotating Expired API Access Tokens
API access tokens have an expiration date. When an API access token expires, users need to generate a new token (of type Data Ingestion with Read/Write permissions) and reconfigure Telegraf to use the newly-generated token instead of the expired token. The steps below detail how to do this.
Kubernetes
Note that these commands are using the default namespace "netapp-monitoring". If you have set your own namespace, substitute that namespace in these and all subsequent commands and files.
Note: If you have the latest NetApp Kubernetes Monitoring Operator installed and using an API access token that is renewable, expiring tokens will automatically be replaced by new/refreshed API access tokens. There is no need to perform the manual steps listed below.
-
Create a new API token.
-
Follow the steps for Manual Upgrade, selecting the new API token.
Note: Customers managing their NetApp Kubernetes Monitoring Operator with a configuration management tool, such as Kustomize, can follow the same steps to generate and download an updated set of YAMLs to push to their repository.
RHEL/CentOS and Debian/Ubuntu
-
Edit the Telegraf configuration files, and replace all instances of the old API token with the new API token.
sudo sed -i.bkup ‘s/<OLD_API_TOKEN>/<NEW_API_TOKEN>/g’ /etc/telegraf/telegraf.d/*.conf
-
Restart Telegraf.
sudo systemctl restart telegraf
Windows
-
For each Telegraf configuration file in C:\Program Files\telegraf\telegraf.d, replace all instances of the old API token with the new API token.
cp <plugin>.conf <plugin>.conf.bkup
(Get-Content <plugin>.conf).Replace(‘<OLD_API_TOKEN>’, ‘<NEW_API_TOKEN>’) | Set-Content <plugin>.conf
-
Restart Telegraf.
Stop-Service telegraf
Start-Service telegraf


