ONTAP Essentials
 Suggest changes


ONTAP Essentials is a set of dashboards and workflows that provide detailed overviews of your ONTAP inventories and workloads. You may see the following terms used when working in ONTAP Essentials:
-
Infrastructure/Inventory: Objects that provide storage/networking services to user data
-
Workloads: Objects that provide interface to users to read/write data.
-
Data Protection: Objects that can be protected using NetApp data protection technologies
For additional terms and definitions related to ONTAP, see the ONTAP Data Collector documentation.
ONTAP Essentials requires at least one working ONTAP data collector with data collected within the last seven days.
Overview
To begin exploring, select ONTAP Essentials from the main Data Infrastructure Insights menu.
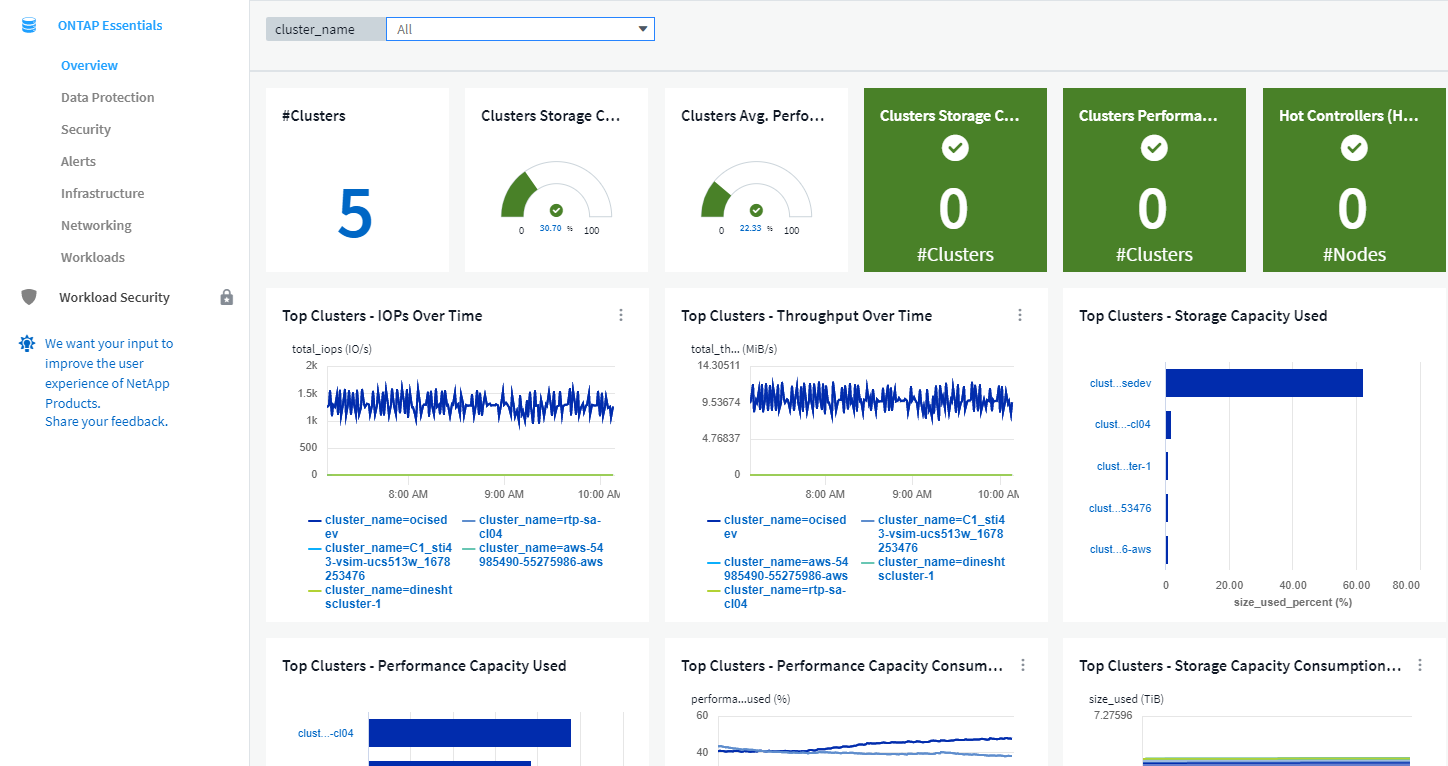
The Overview dashboard displays useful information like the number of clusters on your tenant with their overall capacity and performance percentages. You will also see predictive data regarding the number of expected days until storage capacity or performance capacity runs out of space. Additionally, if any controllers in your infrastructure are running with their CPU at more than 65%--potentially putting your cluster at risk in case of failover—ONTAP Essentials shows those as "Hot" controllers.
Informative graphs give you a look into performance over time as well as breakdowns of capacity usage. Each of these graphs or data points can be used as a starting point for exploration or investigation.
Note: A "days to full" number of "0" (zero) indicates that days to full is estimated at greater than 90 days. In other words, your systems aren't in danger of running out of space any time soon.
Data Protection
The Data Protection page shows the status of volumes protected by Snapshot copies or SnapMirror policies.
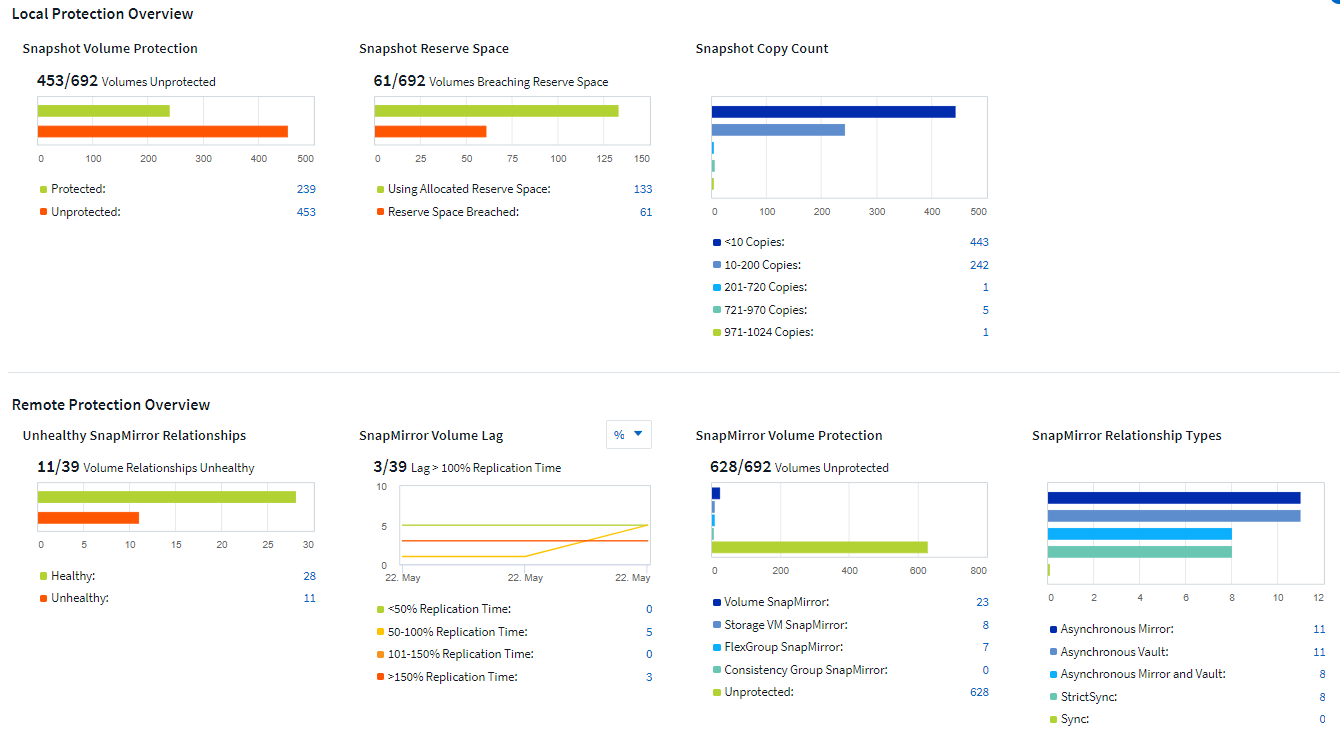
In the Local Protection Overview section, the charts provide the following information for volumes protected by Snapshot copies:
-
The number of volumes protected by Snapshot copies, as well as those not protected.
-
The number of volumes that are using or exceeding the reserve space for the Snapshot copies.
-
The number of volumes in specific ranges of Snapshot copy count (i.e. less than 10 copies, 10 to 200, etc.).
In the Remote Protection Overview section, the charts provide information related to volumes protected by SnapMirror policies:
-
The number of healthy and unhealthy SnapMirror relationships.
-
The number of SnapMirror relationships experiencing recovery point objective (RPO) lag based on the lag status.
-
The number of relationships protected by SnapMirror volume protection types such as Volume SnapMirror, SVMDR relationships, FlexGroup SnapMirror relationships, SnapMirror Business Continuity (SMBC) consistency Group relationships, as well as unprotected volumes.
-
The number of relationships protected by the SnapMirror relationship types such as Asynchronous Mirror, Asynchronous Vault, Asynchronous MirrorVault, StrictSync, and Sync.
The Clusters grid at the bottom of the page provides details related to the following:
-
Volumes not protected by Snapshots.
-
Volumes breaching snapshot reserve space.
-
Volumes not protected by snapmirror policies and snapmirror relationships experiencing lag.
-
Unhealthy SnapMirror relationships.

Security
The Security Dashboard gives you an instant view of your current security situation, showing charts for hardware and software volume encryption, anti-file tampering status, and cluster authentication methods. Security criteria is evaluated based on recommendations defined in the NetApp Security Hardening Guide for ONTAP 9.
Select any of the encryption or anti-file tampering counts to dive into your environment.
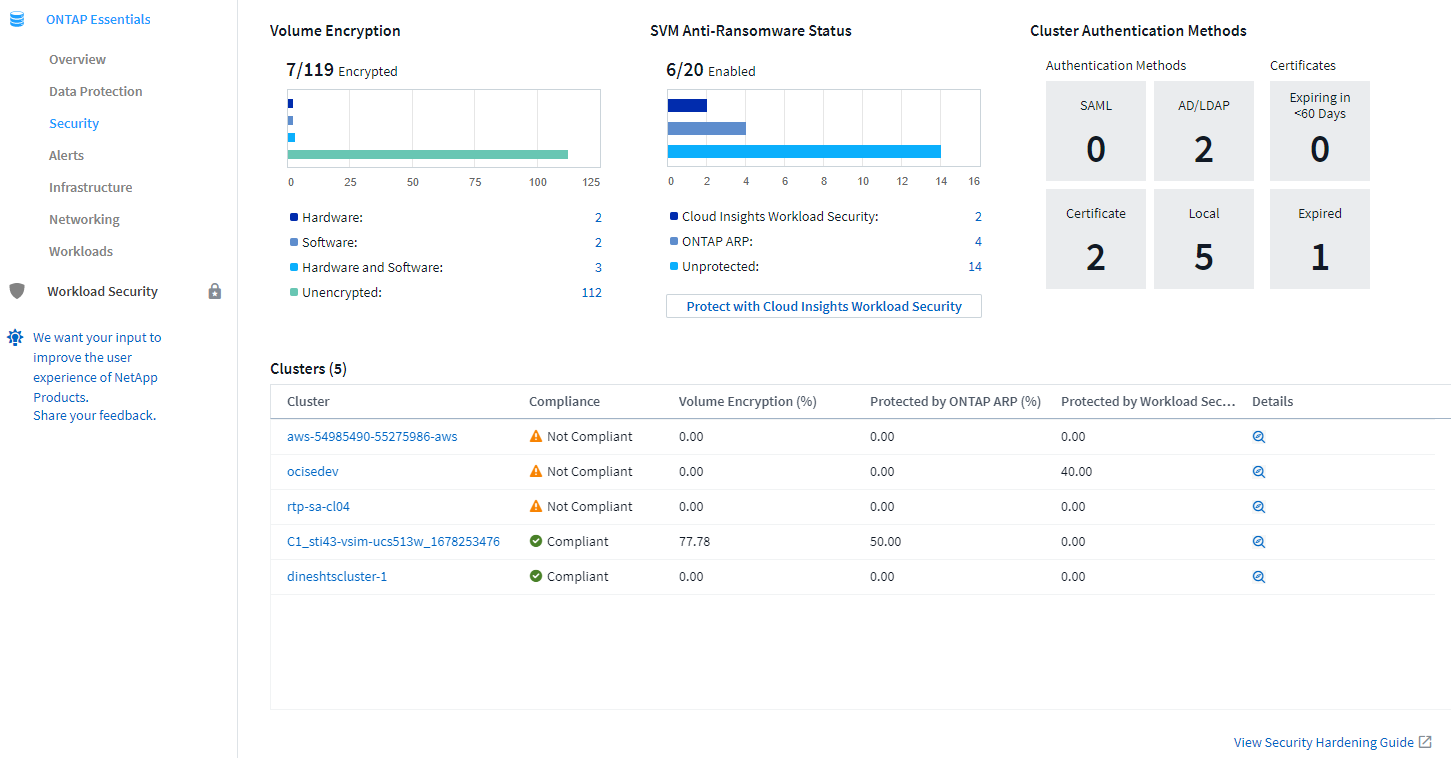
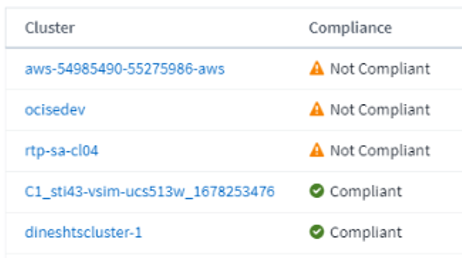
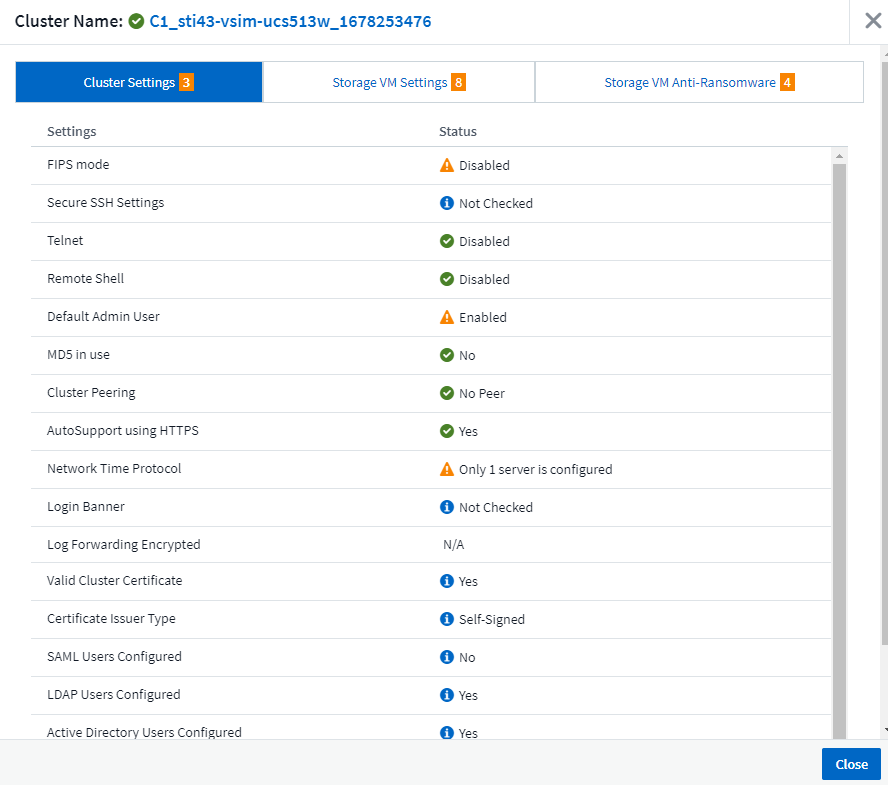
The ONTAP Essentials Security dashboard monitors your environment to determine cluster compliance status. Refer to the Cluster Compliance Categories to learn more. ONTAP Essentials uses the following monitors to determine compliance:
| Monitor Name | Attribute Name (Displayed in Cluster Details) | Attribute Compliant Value |
|---|---|---|
FIPS Mode Disabled |
FIPS mode |
Enabled |
Cluster Insecure ciphers for SSH |
Secure SSH Settings |
Yes |
Telnet Protocol Enabled |
Telnet |
Disabled |
Remote Shell Enabled |
Remote Shell |
Disabled |
Default Local Admin User Enabled |
Default Admin User |
Disabled |
MD5 Hashed password |
MD5 in use |
No |
Cluster Peer Communication Not Encrypted |
Cluster Peering |
Encrypted/ No Peer |
AutoSupport HTTPS Transport Disabled |
AutoSupport using HTTPS |
Yes |
No NTP Servers are Configured |
Network Time Protocol |
Configured |
NTP Server Count is Low |
Network Time Protocol |
Configured |
Cluster Login Banner Disabled |
Login Banner |
Enabled |
Log Forwarding Not Encrypted |
Log Forwarding Encrypted |
Yes |
Note that if a monitor above is disabled, the cluster details will show the value as ‘Not checked’ for the corresponding security compliance attribute.
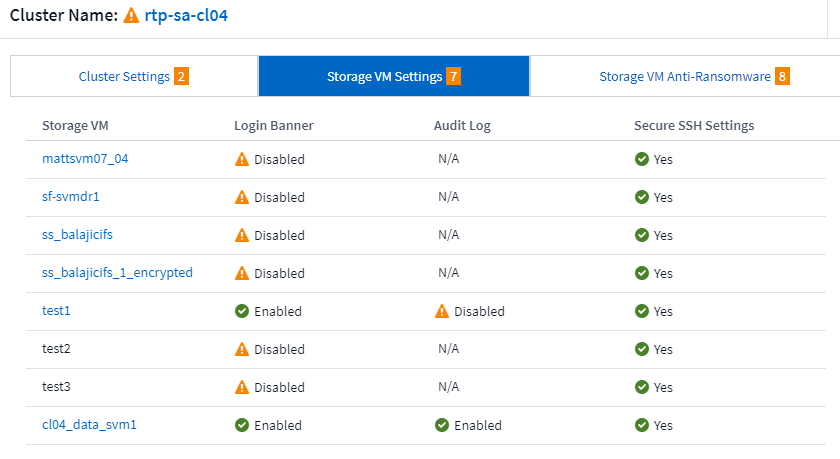
For SVMs, the Security dashboard looks at the following monitors:
| Monitor Name | Attribute Name (Displayed in Storage VM Settings) | Attribute Compliant Value |
|---|---|---|
Storage VM Insecure ciphers for SSH |
Secure SSH Settings |
Yes |
Storage VM Login banner disabled |
Login Banner |
Enabled |
Storage VM Audit Log Disabled |
Audit Log |
Enabled |
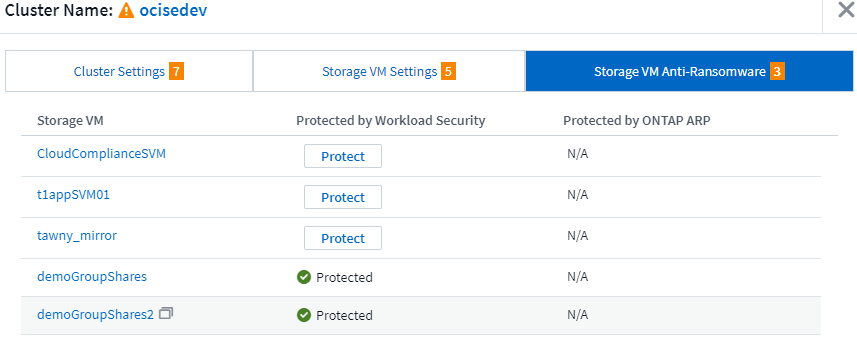
In the cluster list, select View Details for each cluster to open a "slideout" panel showing you the current settings for Cluster, Storage VM, or Anti-Ransomware.
Cluster details include connection status, certificate information, and more:
Storage VM details show audit and SSH information:
Anti-Ransomware details show whether a storage VM is protected by ONTAP's Anti-Ransomware Protection or Data Infrastructure Insights Workload Security. Note that the ONTAP ARP column displays the current status of ONTAP's on-board Anti-Ransomware Protection, which is configured on the ONTAP system. Data Infrastructure Insights Workload Security can be enabled by selecting "Protect" in that column.
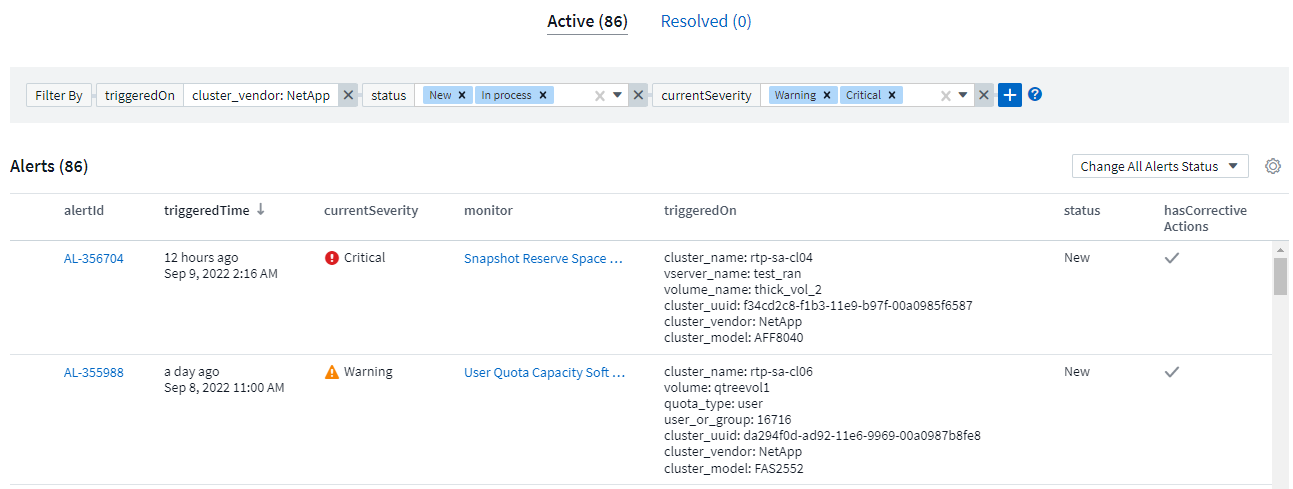
Alerts
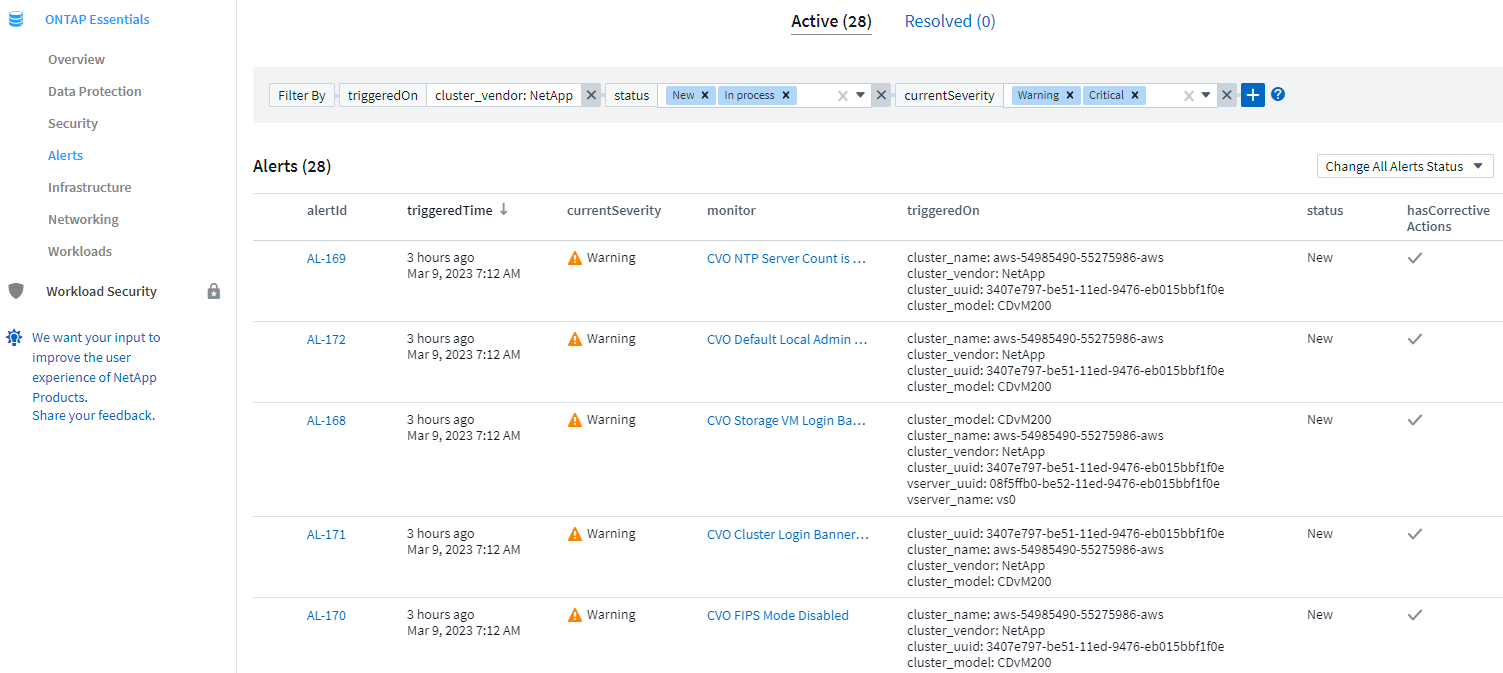
Here you can view the Active alerts on your tenant and quickly drill down into potential problems. Select the Resolved tab to view alerts that have been resolved.
Infrastructure
The ONTAP Essentials Infrastructure page gives you a view of cluster health and performance, using pre-built (yet further customizable) queries on all the basic ONTAP objects. Select the object type you wish to explore (cluster, storage pool, etc.) and choose whether to view health or performance information. Set filters to dive deeper into individual systems.
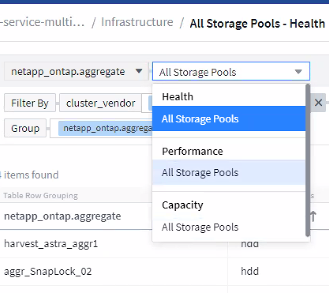
Infrastructure page showing cluster health:

Networking
ONTAP Essentials Networking gives you views into your FC, NVME FC, Ethernet, and iSCSI infrastructure. On these pages you can explore things like ports in your clusters and their nodes.
Workloads
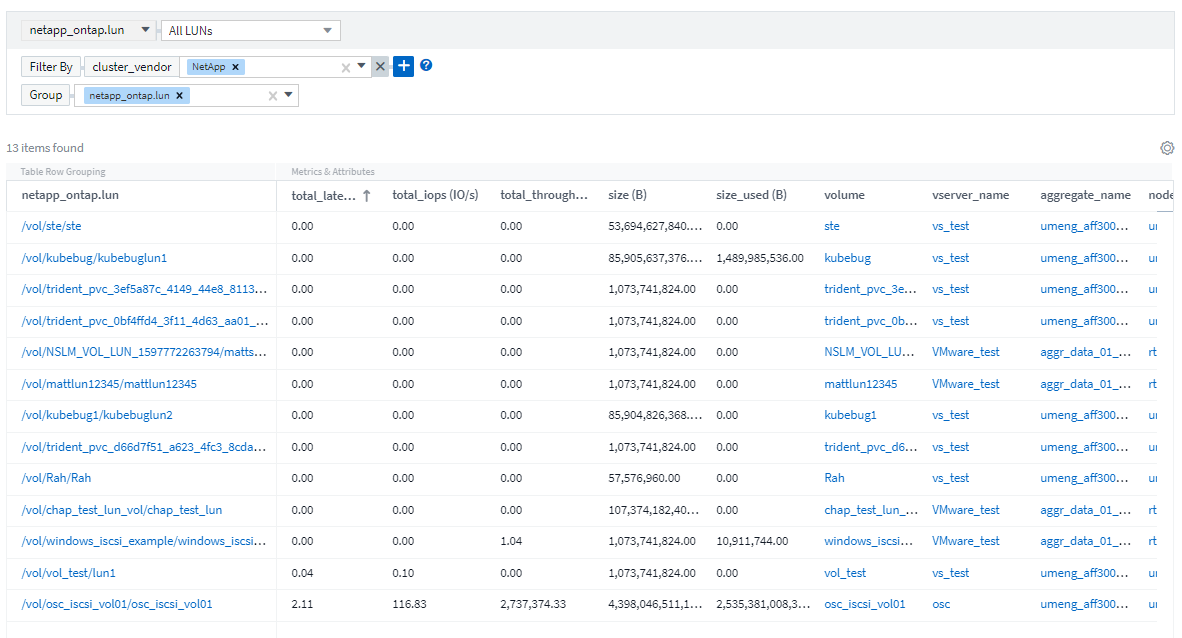
View and explore workloads on LUNs/Volumes, NFS or SMB Shares, or Qtrees on your tenant.
