

View performance metrics for Keystone subscriptions
 Suggest changes
To monitor the performance of your systems, you can view performance metrics of the ONTAP volumes managed by your Keystone subscriptions.

|
This tab is optionally available to you in Digital Advisor. Contact support for viewing this tab. It is not available in the NetApp Console. |
To view this tab in Digital Advisor, follow these steps:
-
Select General > Keystone Subscriptions > Performance.
-
Select the subscription number. By default, the first subscription number is selected.
-
Select the required volume name from the list.
Alternately, you can click the
 icon against an ONTAP volume in the Volumes tab to navigate to this tab.
 -
Select the date range for the query. The date range can be the beginning of the month or the subscription start date to the current date or the subscription end date. You cannot select a future date.
The retrieved details are based on the performance service level objective for each performance service level. For example, the peak IOPS, maximum throughput, target latency, and other metrics are determined by the individual settings for the performance service level. For more information about the settings, see Performance service levels in Keystone.

|
If you select the SLO Reference Line check box, the IOPS, throughput, and latency graphs are rendered based on the performance service level objective for the performance service level. Else, they are displayed in actual numbers. |
The performance data displayed on the horizontal graph is an average at every five-minute interval, and arranged as per the date range of the query. You can scroll across the graphs and hover your mouse over specific data points to drill further down into the collected data.
You can view and compare the performance metrics in the following sections based on the combination of the subscription number, volume name, and the date range selected. The details are displayed as per performance service level assigned to the volume. You can see the cluster name and volume type, that is, the read and write permissions assigned to the volume. Any warning message associated with the volume is also displayed.
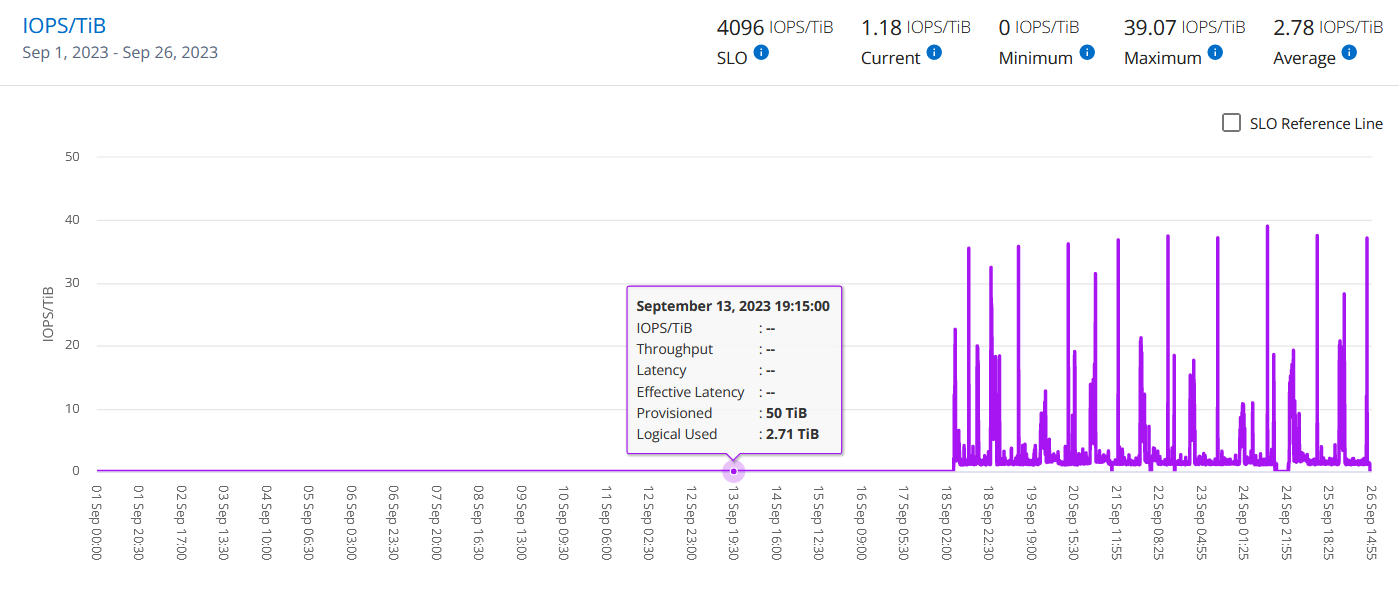
IOPS
This section displays the input-output graphs for the workloads in the volume based on the date range of the query. The peak IOPS for the performance service level and the current IOPS (in the last five minutes, not based on the date range of the query) are displayed, along with the minimum, maximum, and average IOPS for the time range, in IOPS/Tib.
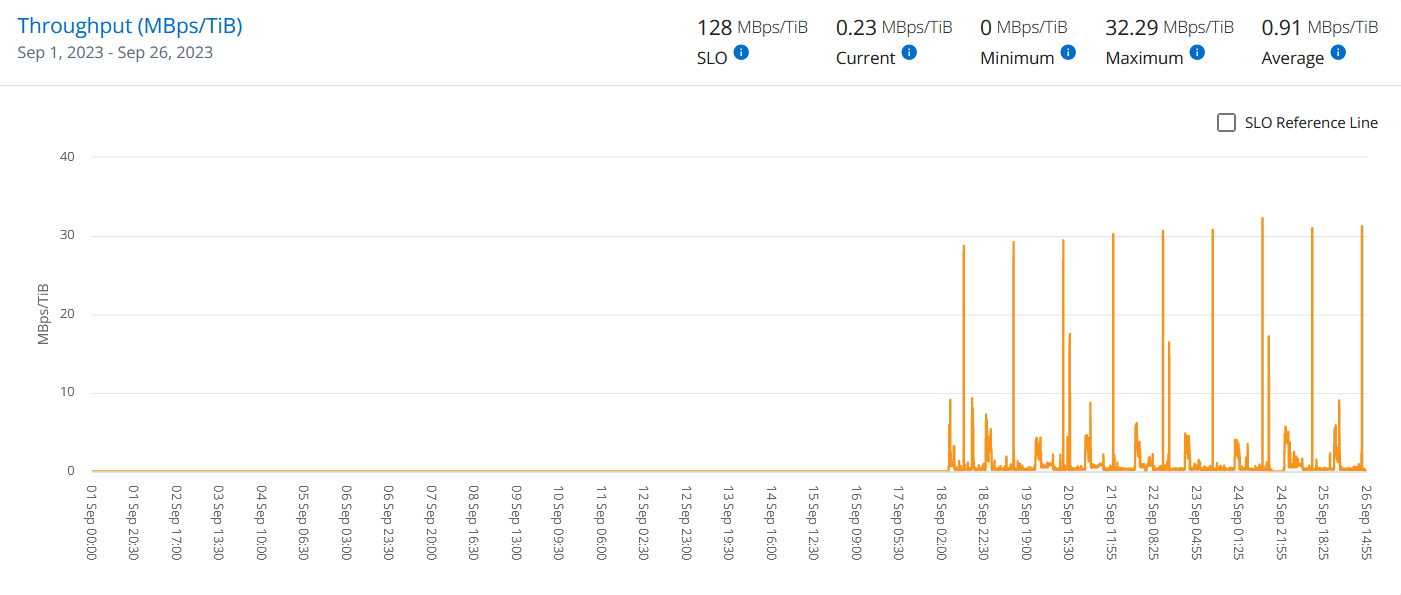
Throughput
This section displays the throughput graphs for the workloads in the volume based on the date range of the query. The maximum throughput for the performance service level (SLO Max), and current throughput (in the last five minutes, not based on the date range of the query) are displayed, along with the minimum, maximum, and average throughput for the time range, in MBps/TiB.
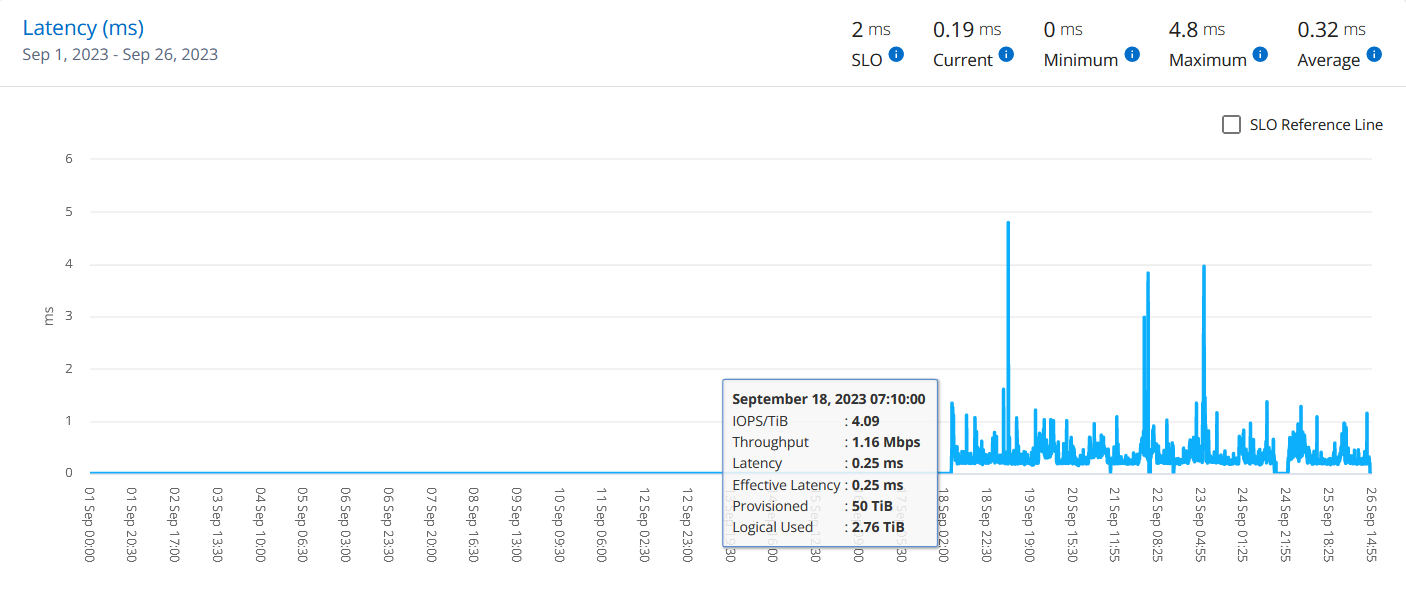
Latency (ms)
This section displays the latency graphs for the workloads in the volume based on the date range of the query. The maximum latency for performance service level (SLO Target), and current latency (in the last five minutes, not based on the date range of the query) are displayed, along with the minimum, maximum, and average latency for the time range, in milliseconds.
This graph has the following colors:
-
Light blue: Latency. This is the actual latency that includes any latency other than your Keystone service. This might include additional latency, such as the latency occurring between your network and client.
-
Dark blue: Effective latency. Effective latency is the latency applicable only to your Keystone service with respect to your SLA.
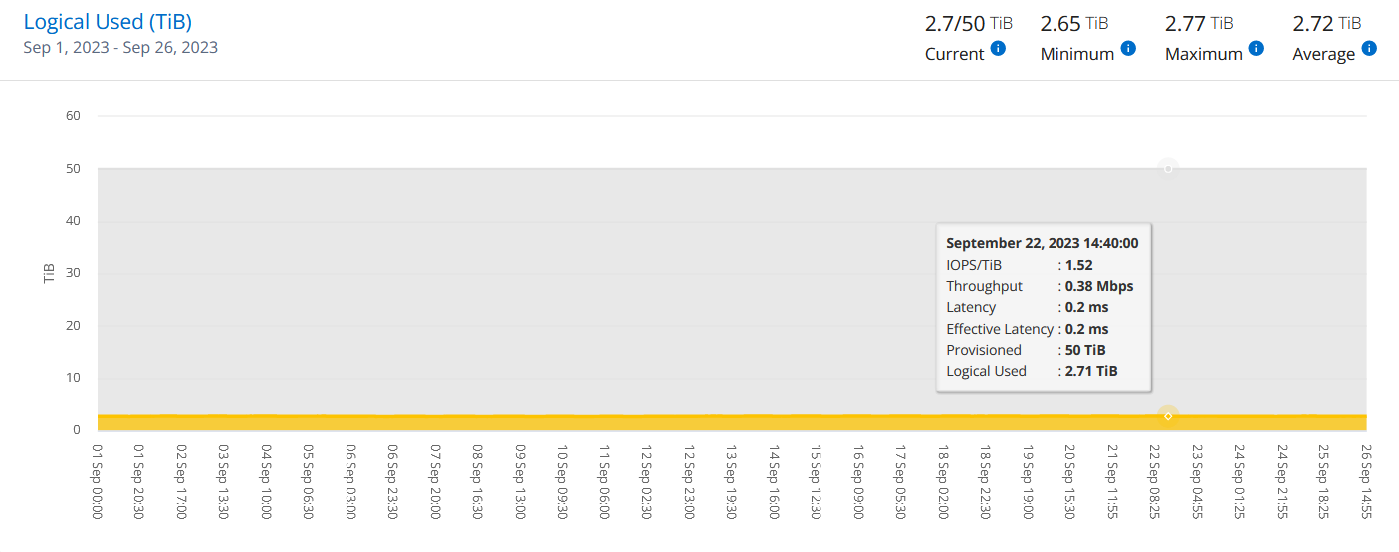
Logical Used (TiB)
This section displays the provisioned and the logical used capacities of the volume. The current logical used capacity (in the last five minutes, not based on the date range of the query), along with the minimum, maximum, and average usage for the time range are displayed in TiBs. On this graph, the grey area represents the committed capacity, and the yellow graph indicates the logical use.
Related information