Dashboard settings
 Suggest changes


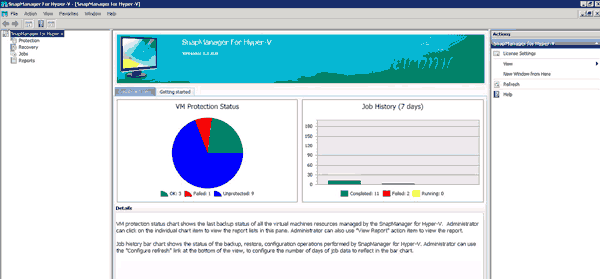
The SnapManager for Hyper-V dashboard displays an overview of resources that are currently being protected, as well as those that are not protected. You can select different segments of either the VM Protection Status pie chart or the Job History bar graph to view general information about the status of your jobs, resources, and history.

-
VM protection status
When you select a segment in the VM Protection Status pie chart, you can view information about the protection status of the virtual machines in the Details pane. The descriptions for valid values are as follows:
-
OK
Displays the most recent successful backup of all virtual machines.
-
Failed
Displays the most recent failed backup of each virtual machine.
-
Unprotected
Displays the virtual machines that do not belong to any datasets and are therefore unprotected.
-
-
Job history
When you select a segment in the Job History bar graph, you can view, in the Details pane, the history of completed, failed, and running jobs over a specified period of time. You can change the length of time that job details are displayed in the Job History bar graph. The default value is seven days.
-
Configure refresh
You can change how often the dashboard refreshes the displayed information by using the Configure refresh button. The default value is 10 minutes.


