Troubleshoot metadata issues
 Suggest changes


You can perform several tasks to help determine the source of metadata problems.
Low metadata storage alert
If the Low metadata storage alert is triggered, you must add new Storage Nodes.
-
You are signed in to the Grid Manager using a supported web browser.
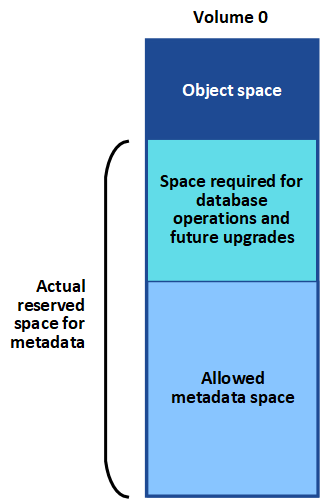
StorageGRID reserves a certain amount of space on volume 0 of each Storage Node for object metadata. This space is known as the actual reserved space, and it is subdivided into the space allowed for object metadata (the allowed metadata space) and the space required for essential database operations, such as compaction and repair. The allowed metadata space governs overall object capacity.

If object metadata consumes more than 100% of the space allowed for metadata, database operations can't run efficiently and errors will occur.
You can monitor object metadata capacity for each Storage Node to help you anticipate errors and correct them before they occur.
StorageGRID uses the following Prometheus metric to measure how full the allowed metadata space is:
storagegrid_storage_utilization_metadata_bytes/storagegrid_storage_utilization_metadata_allowed_bytes
When this Prometheus expression reaches certain thresholds, the Low metadata storage alert is triggered.
-
Minor: Object metadata is using 70% or more of the allowed metadata space. You should add new Storage Nodes as soon as possible.
-
Major: Object metadata is using 90% or more of the allowed metadata space. You must add new Storage Nodes immediately.
When object metadata is using 90% or more of the allowed metadata space, a warning appears on the dashboard. If this warning appears, you must add new Storage Nodes immediately. You must never allow object metadata to use more than 100% of the allowed space. -
Critical: Object metadata is using 100% or more of the allowed metadata space and is starting to consume the space required for essential database operations. You must stop the ingest of new objects, and you must add new Storage Nodes immediately.
In the following example, object metadata is using more than 100% of the allowed metadata space. This is a critical situation, which will result in inefficient database operation and errors.


|
If the size of volume 0 is smaller than the Metadata Reserved Space storage option (for example, in a non-production environment), the calculation for the Low metadata storage alert might be inaccurate. |
-
Select ALERTS > Current.
-
From the table of alerts, expand the Low metadata storage alert group, if required, and select the specific alert you want to view.
-
Review the details in the alert dialog box.
-
If a major or critical Low metadata storage alert has been triggered, perform an expansion to add Storage Nodes immediately.
Because StorageGRID keeps complete copies of all object metadata at each site, the metadata capacity of the entire grid is limited by the metadata capacity of the smallest site. If you need to add metadata capacity to one site, you should also expand any other sites by the same number of Storage Nodes. After you perform the expansion, StorageGRID redistributes the existing object metadata to the new nodes, which increases the overall metadata capacity of the grid. No user action is required. The Low metadata storage alert is cleared.
Services: Status - Cassandra (SVST) alarm
The Services: Status - Cassandra (SVST) alarm indicates that you might need to rebuild the Cassandra database for a Storage Node. Cassandra is used as the metadata store for StorageGRID.
-
You must be signed in to the Grid Manager using a supported web browser.
-
You have specific access permissions.
-
You must have the
Passwords.txtfile.
If Cassandra is stopped for more than 15 days (for example, the Storage Node is powered off), Cassandra will not start when the node is brought back online. You must rebuild the Cassandra database for the affected DDS service.
You can run diagnostics to obtain additional information about the current state of your grid.

|
If two or more of the Cassandra database services are down for more than 15 days, contact technical support, and don't proceed with the steps below. |
-
Select SUPPORT > Tools > Grid topology.
-
Select Site > Storage Node > SSM > Services > Alarms > Main to display alarms.
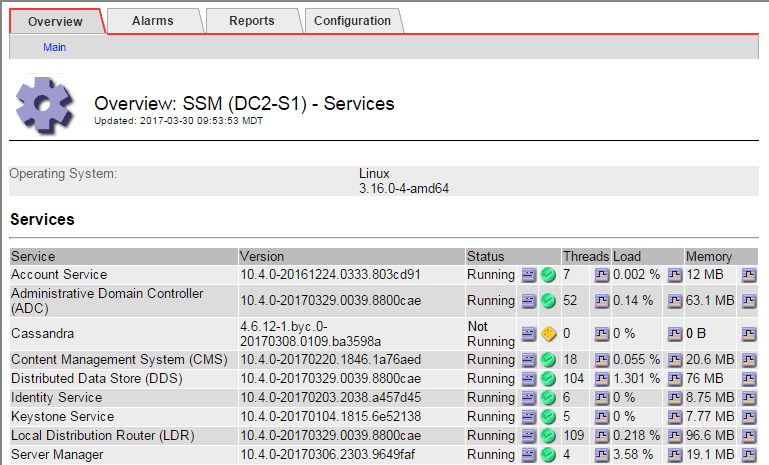
This example shows that the SVST alarm was triggered.

The SSM Services Main page also indicates that Cassandra is not running.

-
Try restarting Cassandra from the Storage Node:
-
Log in to the grid node:
-
Enter the following command:
ssh admin@grid_node_IP -
Enter the password listed in the
Passwords.txtfile. -
Enter the following command to switch to root:
su - -
Enter the password listed in the
Passwords.txtfile. When you are logged in as root, the prompt changes from$to#.
-
-
Enter:
/etc/init.d/cassandra status -
If Cassandra is not running, restart it:
/etc/init.d/cassandra restart
-
-
If Cassandra does not restart, determine how long Cassandra has been down. If Cassandra has been down for longer than 15 days, you must rebuild the Cassandra database.
If two or more of the Cassandra database services are down, contact technical support, and don't proceed with the steps below. You can determine how long Cassandra has been down by charting it or by reviewing the servermanager.log file.
-
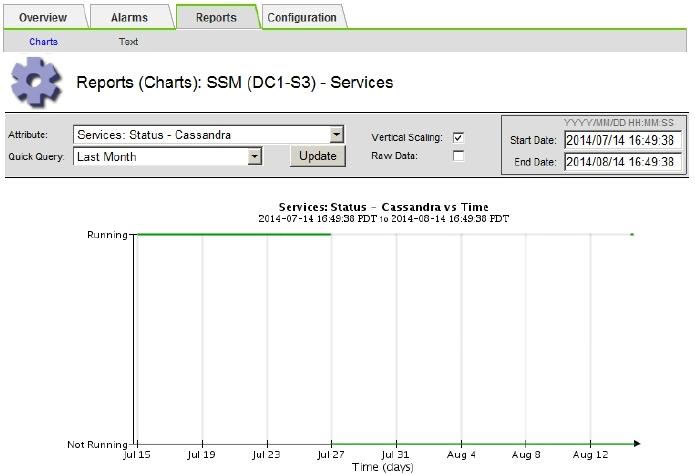
To chart Cassandra:
-
Select SUPPORT > Tools > Grid topology. Then select Site > Storage Node > SSM > Services > Reports > Charts.
-
Select Attribute > Service: Status - Cassandra.
-
For Start Date, enter a date that is at least 16 days before the current date. For End Date, enter the current date.
-
Click Update.
-
If the chart shows Cassandra as being down for more than 15 days, rebuild the Cassandra database.
The following chart example shows that Cassandra has been down for at least 17 days.

-
-
To review the servermanager.log file on the Storage Node:
-
Log in to the grid node:
-
Enter the following command:
ssh admin@grid_node_IP -
Enter the password listed in the
Passwords.txtfile. -
Enter the following command to switch to root:
su - -
Enter the password listed in the
Passwords.txtfile. When you are logged in as root, the prompt changes from$to#.
-
-
Enter:
cat /var/local/log/servermanager.logThe contents of the servermanager.log file are displayed.
If Cassandra has been down for longer than 15 days, the following message is displayed in the servermanager.log file:
"2014-08-14 21:01:35 +0000 | cassandra | cassandra not
started because it has been offline for longer than
its 15 day grace period - rebuild cassandra
-
Make sure the timestamp of this message is the time when you attempted restarting Cassandra as instructed in step Restart Cassandra from the Storage Node.
There can be more than one entry for Cassandra; you must locate the most recent entry.
-
If Cassandra has been down for longer than 15 days, you must rebuild the Cassandra database.
For instructions, see Recover Storage Node down more than 15 days.
-
Contact technical support if alarms don't clear after Cassandra is rebuilt.
-
Cassandra Out of Memory errors (SMTT alarm)
A Total Events (SMTT) alarm is triggered when the Cassandra database has an out-of-memory error. If this error occurs, contact technical support to work through the issue.
If an out-of-memory error occurs for the Cassandra database, a heap dump is created, a Total Events (SMTT) alarm is triggered, and the Cassandra Heap Out Of Memory Errors count is incremented by one.
-
View the event:
-
Select SUPPORT > Tools > Grid topology.
-
Expand the site, then select grid_node.
-
Select SSM, then select Events > Configuration.
-
-
Verify that the Cassandra Heap Out Of Memory Errors count is 1 or greater.
You can run diagnostics to obtain additional information about the current state of your grid.
-
Log in to the selected node as "admin" using SSH, and switch to the local root user.
-
Go to
/var/local/core/, compress theCassandra.hproffile, and send it to technical support. -
Make a backup of the
Cassandra.hproffile, and delete it from the/var/local/core/ directory.This file can be as large as 24 GB, so you should remove it to free up space.
-
After the issue is resolved, select the Reset checkbox for the Cassandra Heap Out Of Memory Errors count. Then select Apply Changes.
To reset event counts, you must have the Grid topology page configuration permission.


