Asset Page Summary section
 Suggest changes
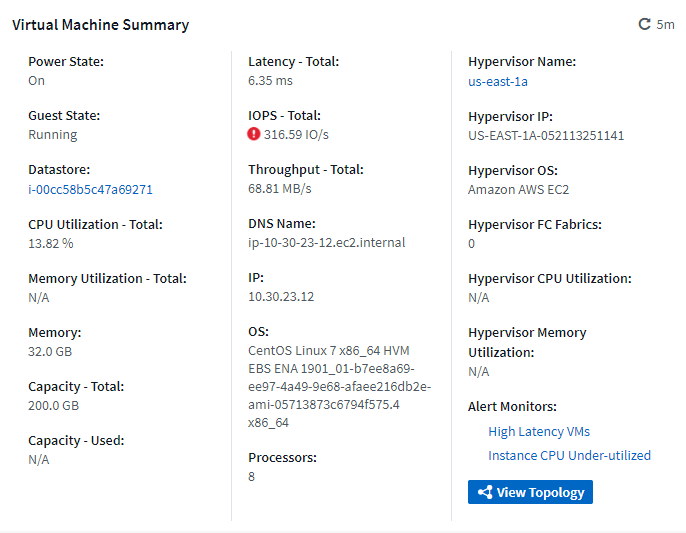
The Summary section of an asset page displays general information about an asset, including whether any metrics or performance policies are cause for concern. Potential problem areas are indicated by a red circle.
The information in the summary section, as well as in any tables or custom widgets on the asset page, refreshes automatically based on the selected time range. You can see the current refresh rate in the upper-right corner of the Summary section, the tables, and any custom widgets.
Note: The information displayed in the Summary section varies, depending on the type of asset you are viewing.
You can click any of the asset links to view their asset pages. For example, if you are viewing a storage node, you can click a link to view the asset page of the storage it is associated with.
You can view the metrics associated with the asset. A red circle next to a metric indicates that you might need to diagnose and resolve potential problems.

|
You may notice that volume capacity might show greater than 100% on some storage assets. This is due to metadata related to the capacity of the volume being part of the consumed capacity data reported by the asset. |
If applicable, you can click an alert link to view the alert and monitor associated with the asset.
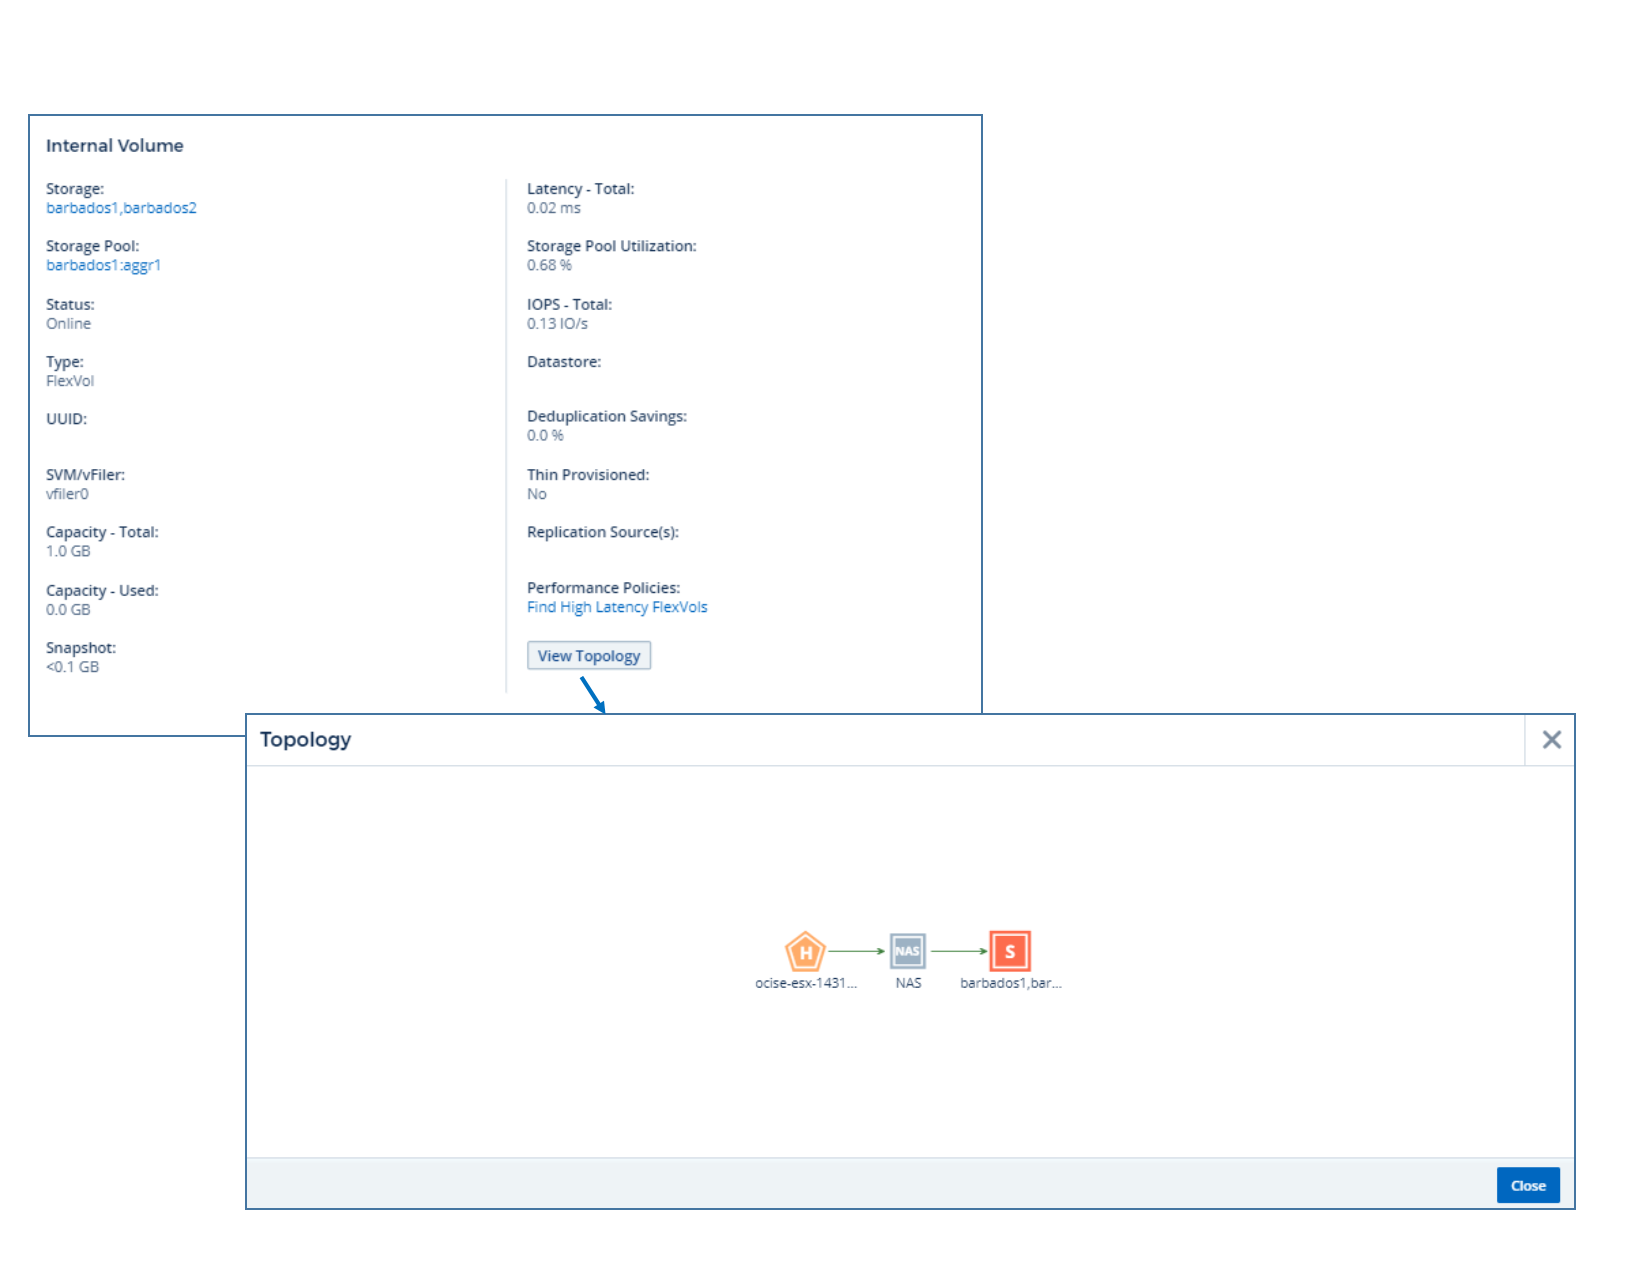
Topology
On certain asset pages, the summary section contains a link to view the topology of the asset and its connections.
Topology is available for the following asset types:
-
Application
-
Disk
-
Fabric
-
Host
-
Internal Volume
-
Port
-
Switch
-
Virtual Machine
-
VMDK
-
Volume