

Flink Data Collector
 Suggest changes
Data Infrastructure Insights uses this data collector to gather metrics from Flink.

|
This collector is deprecated. It will no longer be available starting January 2027. |
Installation
-
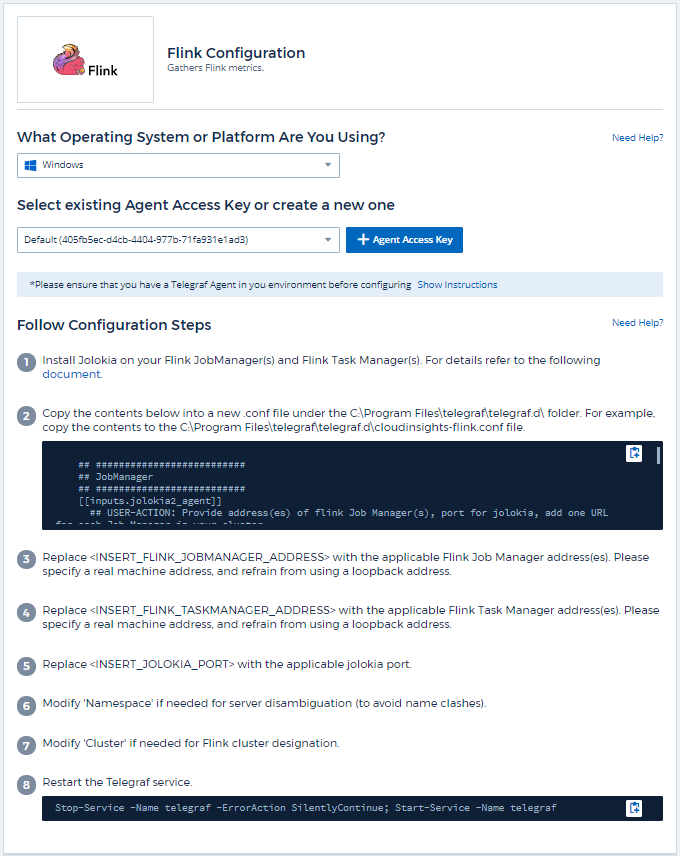
From Observability > Collectors, click +Data Collector. Choose Flink.
Select the Operating System or Platform on which the Telegraf agent is installed.
-
If you haven't already installed an Agent for collection, or you wish to install an Agent for a different Operating System or Platform, click Show Instructions to expand the Agent installation instructions.
-
Select the Agent Access Key for use with this data collector. You can add a new Agent Access Key by clicking the + Agent Access Key button. Best practice: Use a different Agent Access Key only when you want to group data collectors, for example, by OS/Platform.
-
Follow the configuration steps to configure the data collector. The instructions vary depending on the type of Operating System or Platform you are using to collect data.
Setup
A full Flink deployment involves the following components:
JobManager: The Flink primary system. Coordinates a series of TaskManagers. In a High Availability setup, system will have more than one JobManager.
TaskManager: This is where Flink operators are executed.
The Flink plugin is based on the telegraf's Jolokia plugin. As such as a requirement to gather info from all Flink components, JMX needs to be configured and exposed via Jolokia on all components.
Compatibility
Configuration was developed against Flink version 1.7.0.
Setting Up
Jolokia Agent Jar
For all individual components, a version the Jolokia agent jar file must be downloaded. The version tested against was Jolokia agent 1.6.0.
Instructions below assume that downloaded jar file (jolokia-jvm-1.6.0-agent.jar) is placed under location '/opt/flink/lib/'.
JobManager
To configure JobManager to expose the Jolokia API, you can setup the following environment variable on your nodes then restart the JobManager:
export FLINK_ENV_JAVA_OPTS="-javaagent:/opt/flink/lib/jolokia-jvm-1.6.0-agent.jar=port=8778,host=0.0.0.0"
You can choose a different port for Jolokia (8778). If you have an internal IP to lock Jolokia onto you can replace the "catch all" 0.0.0.0 by your own IP. Notice this IP needs to be accessible from the telegraf plugin.
TaskManager
To configure TaskManager(s) to expose the Jolokia API, you can setup the following environment variable on your nodes then restart the TaskManager:
export FLINK_ENV_JAVA_OPTS="-javaagent:/opt/flink/lib/jolokia-jvm-1.6.0-agent.jar=port=8778,host=0.0.0.0"
You can choose a different port for Jolokia (8778). If you have an internal IP to lock Jolokia onto you can replace the "catch all" 0.0.0.0 by your own IP. Notice this IP needs to be accessible from the telegraf plugin.
Objects and Counters
The following objects and their counters are collected:
| Object: | Identifiers: | Attributes: | Datapoints: |
|---|---|---|---|
Flink Task Manager |
Cluster |
Node Name |
Network Available Memory Segments |
Flink Job |
Cluster |
Node Name |
Downtime |
Flink Job Manager |
Cluster |
Node Name |
Garbage Collection PS MarkSweep Count |
Flink Task |
Cluster |
Server |
Buffers In Pool Usage |
Flink Task Operator |
Cluster |
Server |
Current Input Watermark |
Troubleshooting
Additional information may be found from the Support page.