

Kubernetes Cluster Detail Page
 Suggest changes
The Kubernetes cluster detail page displays a detailed overview of your Kubernetes cluster.
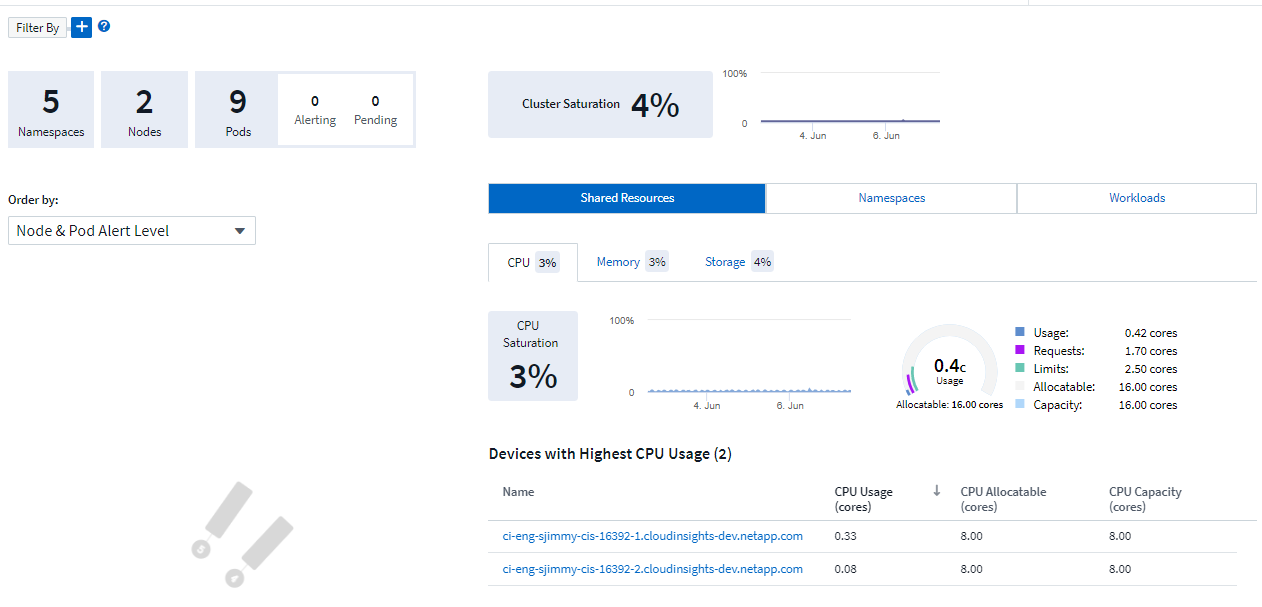
Namespace, Node, and Pod Counts
The counts at the top of the page show you the total number of namespaces, nodes, and pods in the cluster, as well as the number of popds that are currently alerting and pending.
Shared Resources and Saturation
On the top right of the detail page is your cluster saturation as a current percentage as well as a graph showing the recent trend over time. Cluster saturation is the highest of CPU, memory, or storage saturation at each point in time.
Below that, the page shows by default Shared Resources usage, with tabs for CPU, Memory, and Storage. Each tab shows the saturation percentage and trend over time, with additional usage details. For storage, the value shown is the greater of backend and filesystem saturation, which are calculated independently.
The devices with the highest usage are shown in a table at the bottom. Click any link to explore these devices.
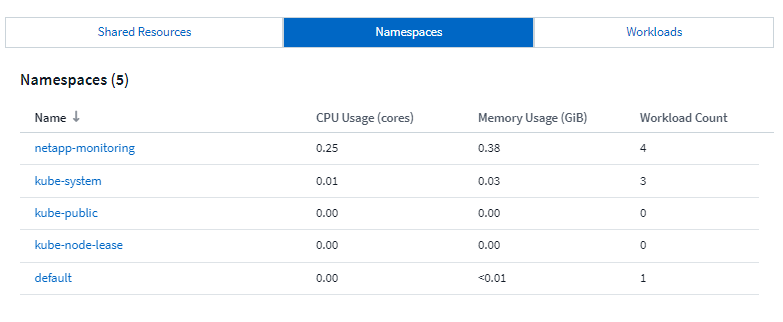
Namespaces
The Namespaces tab displays a list of all the namespaces in your Kubernetes environment, showing CPU and Memory usage as well as a count of workloads in each namespace. Click the Name links to explore each namespace.
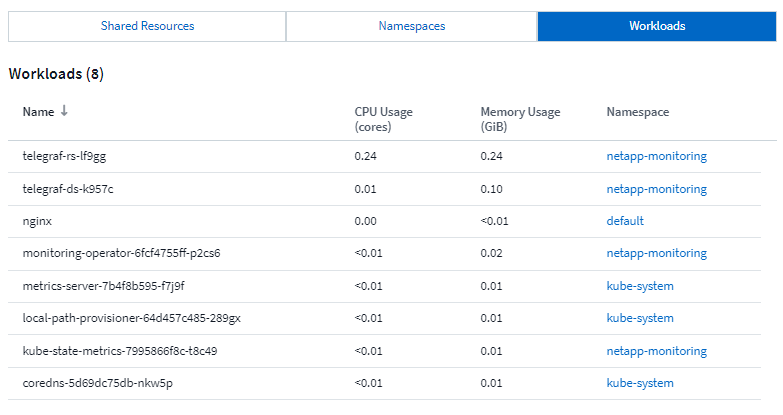
Workloads
Similarly, the Workloads tab displays a list of the workloads in each namespace, again showing CPU and Memory usage. Clicking the Namespace links drills into each.
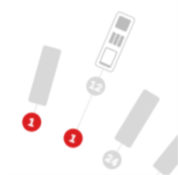
The Cluster "Wheel"
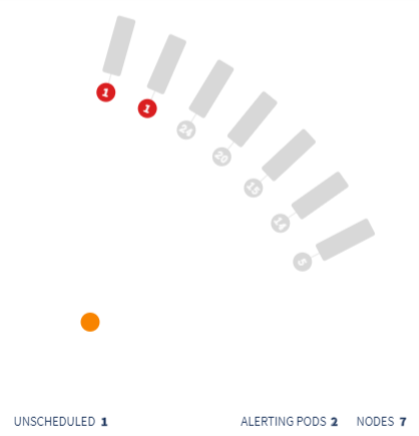
The Cluster "Wheel" section provides node and pod health at a glance, which you can drill into for more information. If your cluster contains more nodes than can be displayed in this area of the page, you will be able to turn the wheel using the buttons available.
Alerting pods or nodes are displayed in red. "Warning" areas are displayed in orange. Pods that are unscheduled (that is, unattached) will display in the lower corner of the Cluster "Wheel".
Hovering over a pod (circle) or Node (bar) will extend the view of the node.
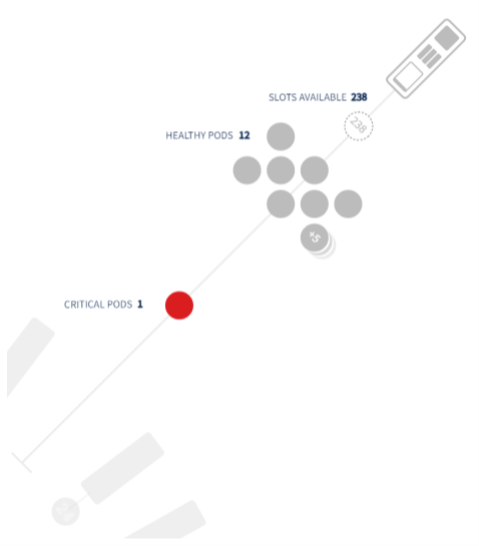
Clicking on the pod or node in that view will zoom in to the expanded Node view.
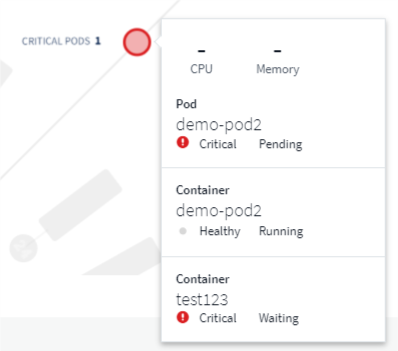
From here, you can hover over an element to display details about that element. For example, hovering over the critical pod in this example displays details about that pod.
You can view Filesystem, Memory, and CPU information by hovering over the Node elements.
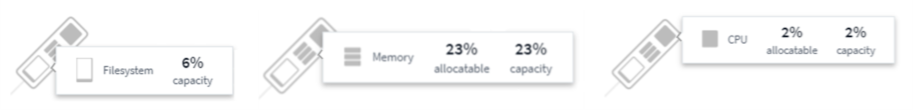
A note about the gauges
The Memory and CPU gauges show three colors, since they show used in relation to both allocatable capacity and total capacity.