Cloud Insights

Hadoop Data Collector

Contributors netapp-alavoie

Cloud Insights uses this data collector to gather metrics from Hadoop.

Installation

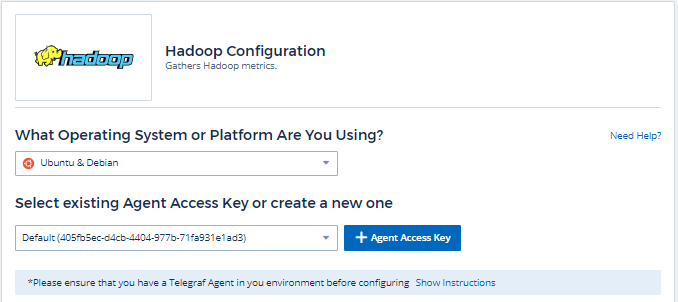
  1. From Observability > Collectors, click +Data Collector. Choose Hadoop.

    Select the Operating System or Platform on which the Telegraf agent is installed.

  2. If you haven't already installed an Agent for collection, or you wish to install an Agent for a different Operating System or Platform, click Show Instructions to expand the Agent installation instructions.

  3. Select the Agent Access Key for use with this data collector. You can add a new Agent Access Key by clicking the + Agent Access Key button. Best practice: Use a different Agent Access Key only when you want to group data collectors, for example, by OS/Platform.

  4. Follow the configuration steps to configure the data collector. The instructions vary depending on the type of Operating System or Platform you are using to collect data.

Hadoop configuration

Setup

A full Hadoop deployment involves the following components:

  • NameNode: The Hadoop Distributed File System (HDFS) primary system. Coordinates a series of DataNodes.

  • Secondary NameNode: a warm failover for the main NameNode. In Hadoop the promotion to NameNode does not occur automatically. Secondary NameNode gathers information from NameNode to be ready to be promoted when needed.

  • DataNode: Actual owner for data.

  • ResourceManager: The compute primary system (Yarn). Coordinates a series of NodeManagers.

  • NodeManager: The resource for compute. Actual location for running of applications.

  • JobHistoryServer: Responsible for servicing all job history related requests.

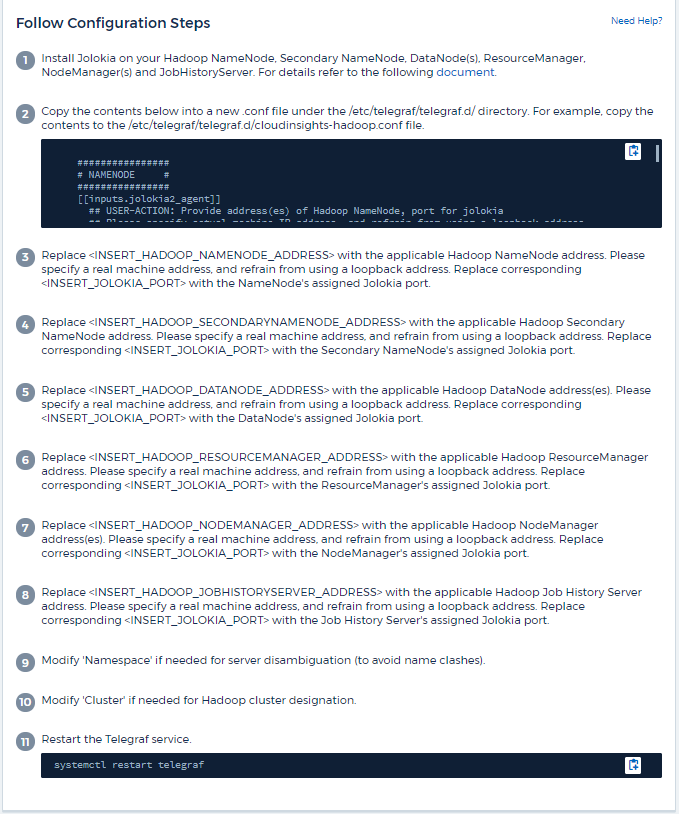
The Hadoop plugin is based on the telegraf's Jolokia plugin. As such as a requirement to gather info from all Hadoop components, JMX needs to be configured and exposed via Jolokia on all components.

Compatibility

Configuration was developed against Hadoop version 2.9.2.

Setting Up

Jolokia Agent Jar

For all individual components, a version the Jolokia agent jar file must be downloaded. The version tested against was Jolokia agent 1.6.0.

Instructions below assume that downloaded jar file (jolokia-jvm-1.6.0-agent.jar) is placed under location '/opt/hadoop/lib/'.

NameNode

To configure NameNode to expose the Jolokia API, you can setup the following in <HADOOP_HOME>/etc/hadoop/hadoop-env.sh:

export HADOOP_NAMENODE_OPTS="$HADOOP_NAMENODE_OPTS -javaagent:/opt/hadoop/lib/jolokia-jvm-1.6.0-agent.jar=port=7800,host=0.0.0.0 -Dcom.sun.management.jmxremote -Dcom.sun.management.jmxremote.port=8000 -Dcom.sun.management.jmxremote.ssl=false -Dcom.sun.management.jmxremote.password.file=$HADOOP_HOME/conf/jmxremote.password"
You can choose a different port for JMX (8000 above) and Jolokia (7800). If you have an internal IP to lock Jolokia onto you can replace the "catch all" 0.0.0.0 by your own IP. Notice this IP needs to be accessible from the telegraf plugin. You can use the option '-Dcom.sun.management.jmxremote.authenticate=false' if you don't want to authenticate. Use at your own risk.

Secondary NameNode

To configure the Secondary NameNode to expose the Jolokia API, you can setup the following in <HADOOP_HOME>/etc/hadoop/hadoop-env.sh:

export HADOOP_SECONDARYNAMENODE_OPTS="$HADOOP_SECONDARYNAMENODE_OPTS -javaagent:/opt/hadoop/lib/jolokia-jvm-1.6.0-agent.jar=port=7802,host=0.0.0.0 -Dcom.sun.management.jmxremote -Dcom.sun.management.jmxremote.port=8002 -Dcom.sun.management.jmxremote.ssl=false -Dcom.sun.management.jmxremote.password.file=$HADOOP_HOME/conf/jmxremote.password"
You can choose a different port for JMX (8002 above) and Jolokia (7802). If you have an internal IP to lock Jolokia onto you can replace the "catch all" 0.0.0.0 by your own IP. Notice this IP needs to be accessible from the telegraf plugin. You can use the option '-Dcom.sun.management.jmxremote.authenticate=false' if you don't want to authenticate. Use at your own risk.

DataNode

To configure the DataNodes to expose the Jolokia API, you can setup the following in <HADOOP_HOME>/etc/hadoop/hadoop-env.sh:

export HADOOP_DATANODE_OPTS="$HADOOP_DATANODE_OPTS -javaagent:/opt/hadoop/lib/jolokia-jvm-1.6.0-agent.jar=port=7801,host=0.0.0.0 -Dcom.sun.management.jmxremote -Dcom.sun.management.jmxremote.port=8001 -Dcom.sun.management.jmxremote.ssl=false -Dcom.sun.management.jmxremote.password.file=$HADOOP_HOME/conf/jmxremote.password"
You can choose a different port for JMX (8001 above) and Jolokia (7801). If you have an internal IP to lock Jolokia onto you can replace the "catch all" 0.0.0.0 by your own IP. Notice this IP needs to be accessible from the telegraf plugin. You can use the option '-Dcom.sun.management.jmxremote.authenticate=false' if you don't want to authenticate. Use at your own risk.

ResourceManager

To configure the ResourceManager to expose the Jolokia API, you can setup the following in <HADOOP_HOME>/etc/hadoop/hadoop-env.sh:

export YARN_RESOURCEMANAGER_OPTS="$YARN_RESOURCEMANAGER_OPTS -javaagent:/opt/hadoop/lib/jolokia-jvm-1.6.0-agent.jar=port=7803,host=0.0.0.0 -Dcom.sun.management.jmxremote -Dcom.sun.management.jmxremote.port=8003 -Dcom.sun.management.jmxremote.ssl=false -Dcom.sun.management.jmxremote.password.file=$HADOOP_HOME/conf/jmxremote.password"
You can choose a different port for JMX (8003 above) and Jolokia (7803). If you have an internal IP to lock Jolokia onto you can replace the "catch all" 0.0.0.0 by your own IP. Notice this IP needs to be accessible from the telegraf plugin. You can use the option '-Dcom.sun.management.jmxremote.authenticate=false' if you don't want to authenticate. Use at your own risk.

NodeManager

To configure the NodeManagers to expose the Jolokia API, you can setup the following in <HADOOP_HOME>/etc/hadoop/hadoop-env.sh:

export YARN_NODEMANAGER_OPTS="$YARN_NODEMANAGER_OPTS -javaagent:/opt/hadoop/lib/jolokia-jvm-1.6.0-agent.jar=port=7804,host=0.0.0.0 -Dcom.sun.management.jmxremote -Dcom.sun.management.jmxremote.port=8004 -Dcom.sun.management.jmxremote.ssl=false -Dcom.sun.management.jmxremote.password.file=$HADOOP_HOME/conf/jmxremote.password"
You can choose a different port for JMX (8004 above) and Jolokia (7804). If you have an internal IP to lock Jolokia onto you can replace the "catch all" 0.0.0.0 by your own IP. Notice this IP needs to be accessible from the telegraf plugin. You can use the option '-Dcom.sun.management.jmxremote.authenticate=false' if you don't want to authenticate. Use at your own risk.

JobHistoryServer

To configure the JobHistoryServer to expose the Jolokia API, you can setup the following in <HADOOP_HOME>/etc/hadoop/hadoop-env.sh:

export HADOOP_JOB_HISTORYSERVER_OPTS="$HADOOP_JOB_HISTORYSERVER_OPTS -javaagent:/opt/hadoop/lib/jolokia-jvm-1.6.0-agent.jar=port=7805,host=0.0.0.0 -Dcom.sun.management.jmxremote -Dcom.sun.management.jmxremote.port=8005 -Dcom.sun.management.jmxremote.password.file=$HADOOP_HOME/conf/jmxremote.password"
You can choose a different port for JMX (8005 above) and Jolokia (7805). If you have an internal IP to lock Jolokia onto you can replace the "catch all" 0.0.0.0 by your own IP. Notice this IP needs to be accessible from the telegraf plugin. You can use the option '-Dcom.sun.management.jmxremote.authenticate=false' if you don't want to authenticate. Use at your own risk.

Objects and Counters

The following objects and their counters are collected:

Object: Identifiers: Attributes: Datapoints:

Hadoop Secondary NameNode

Cluster
Namespace
Server

Node Name
Node IP
Compile Info
Version

GC Count
GC Copies Count
GC Marks Sweep Compact Count
GC Number Info Threshold Exceeded
GC Number Warning Threshold Exceeded
GC Time
GC Copy Time
GC Marks Sweep Compact Time
GC Total Extra Sleep Time
Logs Error Count
Logs Fatal Count
Logs Info Count
Logs Warn Count
Memory Heap Committed
Memory Heap Max
Memory Heap Used
Memory Max
Memory Non Heap Committed
Memory Non Heap Max
Memory Non Heap Used
Threads Blocked
Threads New
Threads Runnable
Threads Terminated
Threads Timed Waiting
Threads Waiting

Hadoop NodeManager

Cluster
Namespace
Server

Node Name
Node IP

Containers Allocated
Memory Allocate
Memory Allocated Oportunistic
Virtual Cores Allocated Oportunistic
Virtual Cores Allocated
Memory Available
Virtual Cores Available
Directories Bad Local
Directories Bad Log
Cache Size Before Clean
Container Launch Duration Avg Time
Container Launch Duration Number Of Operations
Containers Completed
Containers Failed
Containers Initing
Containers Killed
Containers Launched
Containers Reiniting
ContaIners Rolled Back on Failure
Containers Running
Disk Utilization Good Local Directories
Disk Utilization Good Log Directories
Bytes Deleted Private
Bytes Deleted Public
Containers Running Opportunistic
Bytes Deleted Total
Shuffle Connections
Shuffle Output Bytes
Shuffle Outputs Failed
Shuffle Outputs Ok
GC Count
GC Copies Count
GC Marks Sweep Compact Count
GC Number Info Threshold Exceeded
GC Number Warning Threshold Exceeded
GC Time
GC Copy Time
GC Marks Sweep Compact Time
GC Total Extra Sleep Time
Logs Error Count
Logs Fatal Count
Logs Info Count
Logs Warn Count
Memory Heap Committed
Memory Heap Max
Memory Heap Used
Memory Max
Memory Non Heap Committed
Memory Non Heap Max
Memory Non Heap Used
Threads Blocked
Threads New
Threads Runnable
Threads Terminated
Threads Timed Waiting
Threads Waiting

Hadoop ResourceManager

Cluster
Namespace
Server

Node Name
Node IP

ApplicationMaster Launch Delay Avg
ApplicationMaster Launch Delay Number
ApplicationMaster Register Delay Avg
ApplicationMaster Register Delay Number
NodeManager Active Number
NodeManager Decomissioned Number
NodeManager Decomissioning Number
NodeManager Lost Number
NodeManager Rebooted Number
NodeManager Shutdown Number
NodeManager Healthy Number
NodeManager Memory Limit
NodeManager Virtual Cores Limit
Used Capacity
Active Applications
Active Users
Aggregate Containers Allocated
Aggregate Containers Preempted
Aggregate Containers Released
Aggregate Memory Seconds Preempted
Aggregate Node Local Containers Allocated
Aggregate Off Switch Containers Allocated
Aggregate Ack Local Containers Allocated
Aggregate Virtual Cores Seconds Preempted
Containers Allocated
Memory Allocated
Virtual Cores Allocated
Application Attempt First Container Allocation Delay Avg Time
Application Attempt First Container Allocation Delay Number
Applications Completed
Applications Failed
Applications Killed
Applications Pending
Applications Running
Applications Submitted
Memory Available
Virtual Cores Available
Containers Pending
Memory Pending
Virtual Cores Pending
Containers Reserved
Memory Reserved
Virtual Cores Reserved
Memory ApplicationMaster Used
Virtual Cores ApplicationMaster Used
Capacity Used
GC Count
GC Copies Count
GC Marks Sweep Compact Count
GC Number Info Threshold Exceeded
GC Number Warning Threshold Exceeded
GC Time
GC Copy Time
GC Marks Sweep Compact Time
GC Total Extra Sleep Time
Logs Error Count
Logs Fatal Count
Logs Info Count
Logs Warn Count
Memory Heap Committed
Memory Heap Max
Memory Heap Used
Memory Max
Memory Non Heap Committed
Memory Non Heap Max
Memory Non Heap Used
Threads Blocked
Threads New
Threads Runnable
Threads Terminated
Threads Timed Waiting
Threads Waiting

Hadoop DataNode

Cluster
Namespace
Server

Node Name
Node IP
Cluster ID
Version

Transceiver Count
Transmits in Progress
Cache Capacity
Cache Used
Capacity
DFS Used
Estimated Capacity Lost Total
Last Volume Failure Rate
Blocks Number Cached
Blocks Number Failed to Cache
Blocks Number Failed to Uncache
Volumes Number Failed
Capacity Remaining
GC Count
GC Copies Count
GC Marks Sweep Compact Count
GC Number Info Threshold Exceeded
GC Number Warning Threshold Exceeded
GC Time
GC Copy Time
GC Marks Sweep Compact Time
GC Total Extra Sleep Time
Logs Error Count
Logs Fatal Count
Logs Info Count
Logs Warn Count
Memory Heap Committed
Memory Heap Max
Memory Heap Used
Memory Max
Memory Non Heap Committed
Memory Non Heap Max
Memory Non Heap Used
Threads Blocked
Threads New
Threads Runnable
Threads Terminated
Threads Timed Waiting
Threads Waiting

Hadoop NameNode

Cluster
Namespace
Server

Node Name
Node IP
Transaction ID Last Written
Time Since Last Loaded Edits
HA State
File System State
Block Pool ID
Cluster ID
Compile Info
Distinct Version Count
Version

Block Capacity
Blocks Total
Capacity Total
Capacity Used
Capacity Used Non DFS
Blocks Corrupt
Estimated Capacity Lost Total
Blocks Excess
Heartbeats Expired
Files Total
File System Lock Queue Length
Blocks Missing
Blocks Missing Replication with Factor One
Clients Active
Data Nodes Dead
Data Nodes Decommissioning Dead
Data Nodes Decommissioning Live
Data Nodes Decomissioning
Encryption Zones Number
Data Nodes Entering Maintenance
Files Under Construction
Data Nodes Dead in Maintenance
Data Nodes Live in Maintenance
Data Nodes Live
Storages Stale
Replication Pending Timeouts
Data Node Message Pending
Blocks Pending Deletion
Blocks Pending Replication
Blocks Misreplicated Postponed
Blocks Scheduled Replication
Snapshots
Snapshottable Directories
Data Nodes Stale
Files Total
Load Total
Sync Count Total
Transactions Since Last Checkpoint
Transactions Since Last Log Roll
Blocks Underreplicated
Volume Failures Total
Sync Times Total
Objects Max
Operations Block Add
Operations Allow Snapshots
Operations Block Batched
Operations Block Queued
Operations Block Received and Deleted
Operations Report Avg Time
Operations Block Report Number
Cache Report Avg Time
Cache Report Number
Operations Create File
Operations Create Snapshots
Operations Create SymLink
Operations Delete File
Operations Delete Snapshot
Operations Disallow Snapshot
Operations File In/Out
Files Appended
Files Created
Files Deleted
Files Listing
Files Renamed
Files Truncated
File System Load Time
Operations Generate EDEK Avg Time
Operations Generate EDEK
Operations Get Additional Data Node
Blocks Get Locations
Get Edit Avg Time
Get Edit Number
Get Image Avg Time
Get Image Number
Operations Get Link Target
Operations Get Listing
Operations List Snapshottable Dir
Replication Not Scheduled Number
Put Image Avg Time
Put Image Number
Operations Rename Snapshots
Resource Check Time Avg Time
Resource Check Time Number
Safe Mode Time
Operations Snapshot Diff Report
Operations Storage Block Report
Replication Successful
Sync Avg Time
Operations Sync Number
Replication Timeout
Operations Total
Transaction Avg Time
Transaction Batchd In Sync
Transaction Number
EDEK Warmup Time Avg
EDEK Warmup Number
Block Pool Used Space
Cache Capacity
Cache Used
Capacity Free
Block Pool Used Percent
Percent Remaining
Percent Used
Threads
GC Count
GC Copies Count
GC Marks Sweep Compact Count
GC Number Info Threshold Exceeded
GC Number Warning Threshold Exceeded
GC Time
GC Copy Time
GC Marks Sweep Compact Time
GC Total Extra Sleep Time
Logs Error Count
Logs Fatal Count
Logs Info Count
Logs Warn Count
Memory Heap Committed
Memory Heap Max
Memory Heap Used
Memory Max
Memory Non Heap Committed
Memory Non Heap Max
Memory Non Heap Used
Threads Blocked
Threads New
Threads Runnable
Threads Terminated
Threads Timed Waiting
Threads Waiting

Hadoop JobHistoryServer

Cluster
Namespace
Server

Node Name
Node IP

GC Count
GC Copies Count
GC Marks Sweep Compact Count
GC Number Info Threshold Exceeded
GC Number Warning Threshold Exceeded
GC Time
GC Copy Time
GC Marks Sweep Compact Time
GC Total Extra Sleep Time
Logs Error Count
Logs Fatal Count
Logs Info Count
Logs Warn Count
Memory Heap Committed
Memory Heap Max
Memory Heap Used
Memory Max
Memory Non Heap Committed
Memory Non Heap Max
Memory Non Heap Used
Threads Blocked
Threads New
Threads Runnable
Threads Terminated
Threads Timed Waiting
Threads Waiting

Troubleshooting

Additional information may be found from the Support page.