

Kibana Data Collector
 Suggest changes
Data Infrastructure Insights uses this data collector to gather metrics from Kibana.

|
This collector is deprecated. It will no longer be available starting January 2027. |
Installation
-
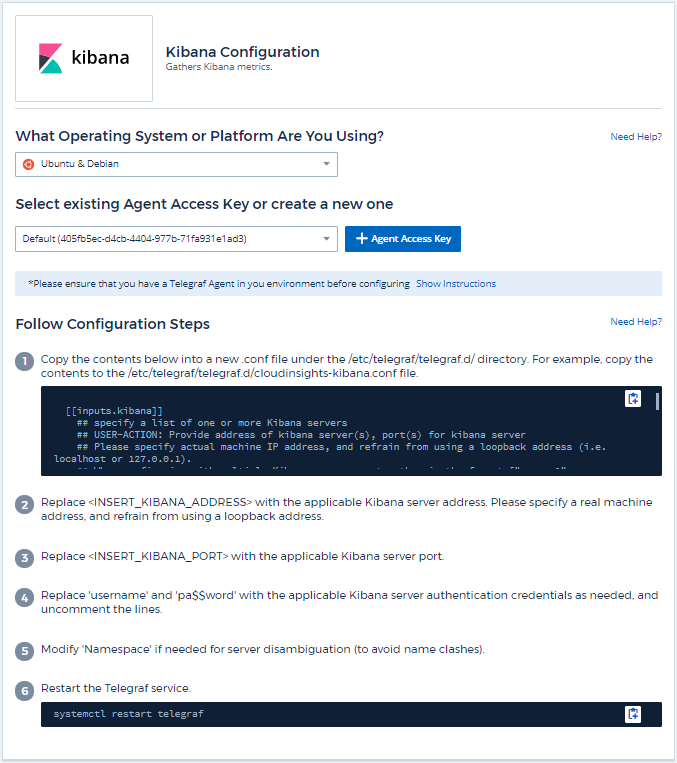
From Observability > Collectors, click +Data Collector. Choose Kibana.
Select the Operating System or Platform on which the Telegraf agent is installed.
-
If you haven't already installed an Agent for collection, or you wish to install an Agent for a different Operating System or Platform, click Show Instructions to expand the Agent installation instructions.
-
Select the Agent Access Key for use with this data collector. You can add a new Agent Access Key by clicking the + Agent Access Key button. Best practice: Use a different Agent Access Key only when you want to group data collectors, for example, by OS/Platform.
-
Follow the configuration steps to configure the data collector. The instructions vary depending on the type of Operating System or Platform you are using to collect data.
Setup
Information may be found in the Kibana documentation.
Objects and Counters
The following objects and their counters are collected:
| Object: | Identifiers: | Attributes: | Datapoints: |
|---|---|---|---|
Kibana |
Namespace |
Node IP |
Concurrent Connections |
Troubleshooting
Additional information may be found from the Support page.