Dashboard Example: Virtual Machine Performance
 Suggest changes
There are many challenges facing IT operations today. Administrators are being asked to do more with less, and having full visibility into your dynamic data centers is a must. In this example, we will show you how to create a dashboard with widgets that give you operational insights into the virtual machine (VM) performance on your tenant. By following this example, and creating widgets to target your own specific needs, you can do things like visualizing backend storage performance compared to frontend virtual machine performance, or viewing VM latency versus I/O demand.
Here we will create a Virtual Machine Performance dashboard containing the following:
-
a table listing VM names and performance data
-
a chart comparing VM Latency to Storage Latency
-
a chart showing Read, Write and Total IOPS for VMs
-
a chart showing Max Throughput for your VMs
This is just a basic example. You can customize your dashboard to highlight and compare any performance data you choose, in order to target for your own operational best practices.
-
Log in to Insight as a user with administrative permissions.
-
From the Dashboards menu, select [+New dashboard].
The New dashboard page opens.
-
At the top of the page, enter a unique name for the dashboard, for example "VM Performance by Application".
-
Click Save to save the dashboard with the new name.
-
Let's start adding our widgets. If necessary, click the Edit icon to enable Edit mode.
-
Click the Add Widget icon and select Table to add a new table widget to the dashboard.
The Edit Widget dialog opens. The default data displayed is for all storages on your tenant.
-
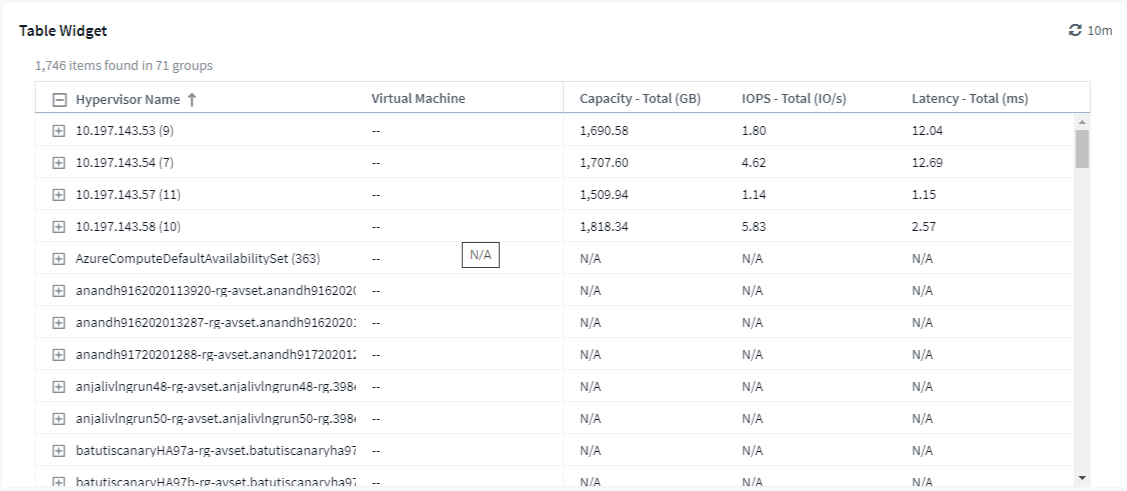
We can customize this widget. In the Name field at the top, delete "Widget 1" and enter "Virtual Machine Performance table".
-
Click the asset type drop-down and change Storage to Virtual Machine.
The table data changes to show all virtual machines on your tenant.
-
Let's add a few columns to the table. Click the Gear icon on the right and select Hypervisor name, IOPS - Total, and Latency - Total. You can also try typing the name into the search to quickly display the desired field.
These columns are now displayed in the table. You can sort the table by any of these columns. Note that the columns are displayed in the order in which they were added to the widget.
-
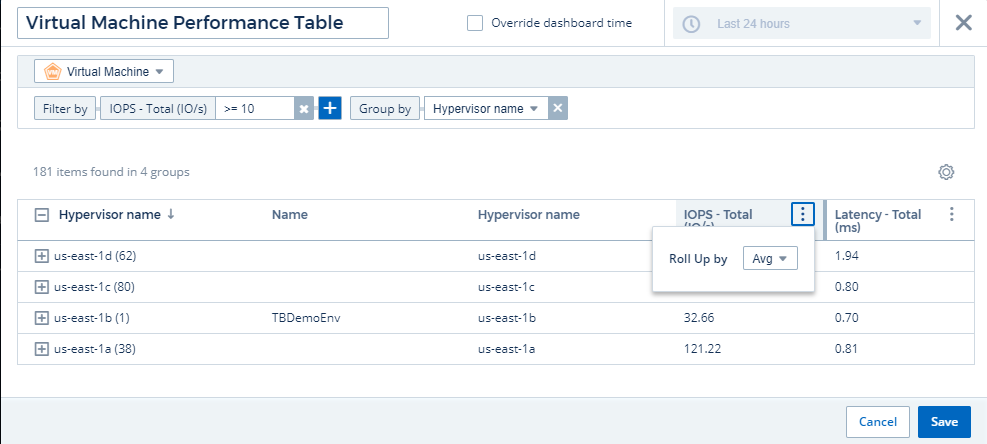
For this exercise we will exclude VMs that are not actively in use, so let's filter out anything with less than 10 total IOPS. Click the [+] button next to Filter by and select IOPS - Total. Click on Any and enter "10" in the from field. Leave the to field empty. Click outsude the filter field or press Enter to set the filter.
The table now shows only VMs with 10 or more total IOPS.
-
We can further collapse the table by grouping results. Click the [+] button next to Group by and select a field to group by, such as Application or Hypervisor name. Grouping is automatically applied.
The table rows are now grouped according to your setting. You can expand and collapse the groups as needed. Grouped rows show rolled up data for each of the columns. Some columns allow you to choose the roll up method for that column.
-
When you have customized the table widget to your satisfaction, click the [Save] button.
The table widget is saved to the dashboard.
You can resize the widget on the dashboard by dragging the lower-right corner. Make the widget wider to show all the columns clearly. Click Save to save the current dashboard.
Next we will add some charts to show our VM Performance. Let's create a line chart comparing VM latency with VMDK latency.
-
If necessary, click the Edit icon on the dashboard to enable Edit mode.
-
Click the [Add widget] icon and select Line Chart to add a new line chart widget to the dashboard.
-
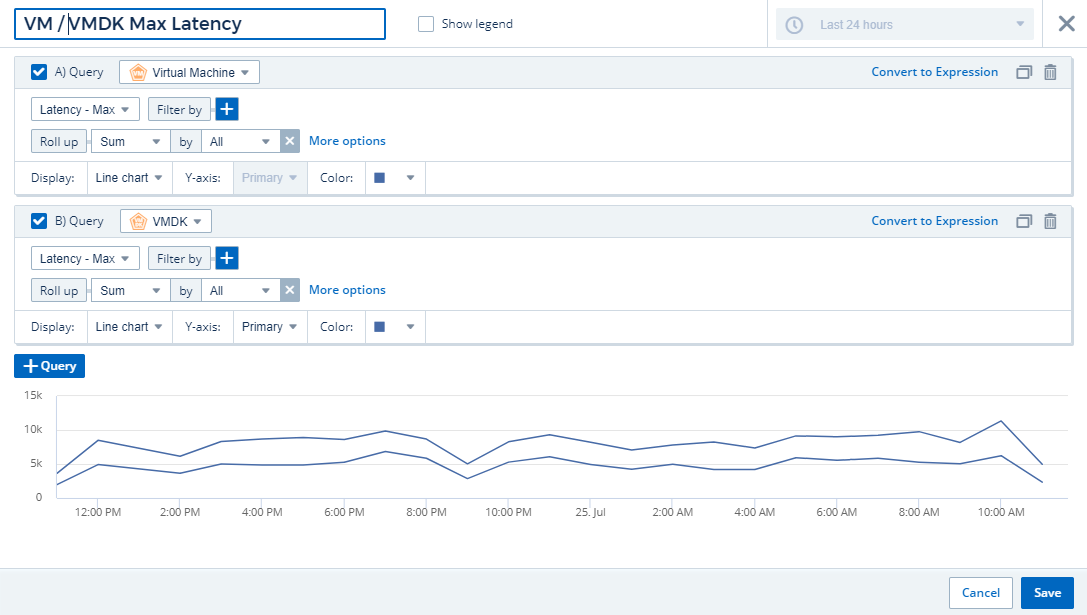
The Edit Widget dialog opens. Name this widget "VM / VMDK Max Latency"
-
Select Virtual Machine and choose Latency - Max. Set any filters you wish, or leave Filter by empty. For Roll up, choose Sum by All. Display this data as a Line Chart, and leave Y-Axis as Primary.
-
Click the [+Query] button to add a second data line. For this line, select VMDK and Latency - Max. Set any filters you wish, or leave Filter by empty. For Roll up, choose Sum by All. Display this data as a Line Chart, and leave Y-Axis as Primary.
-
Click [Save] to add this widget to the dashboard.
Next we will add a chart showing VM Read, Write and Total IOPS in a single chart.
-
Click the [Add widget] icon and select Area Chart to add a new area chart widget to the dashboard.
-
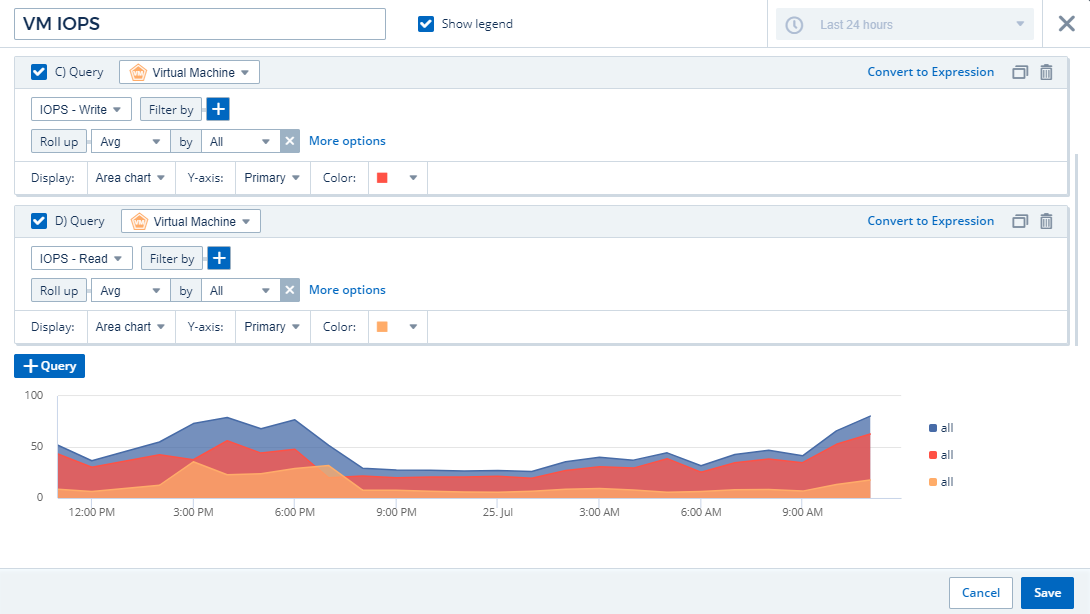
The Edit Widget dialog opens. Name this widget "VM IOPS"
-
Select Virtual Machine and choose IOPS - Total. Set any filters you wish, or leave Filter by empty. for Roll up, choose Sum by All. Display this data as an Area Chart, and leave Y-Axis as Primary.
-
Click the [+Query] button to add a second data line. For this line, select Virtual Machine and choose IOPS - Read.
-
Click the [+Query] button to add a third data line. For this line, select Virtual Machine and choose IOPS - Write.
-
Click Show legend to display a legend for this widget on the dashboard.
-
Click [Save] to add this widget to the dashboard.
Next we will add a chart showing VM Throughput for each Application associated with the VM. We will use the Roll Up feature for this.
-
Click the [Add widget] icon and select Line Chart to add a new line chart widget to the dashboard.
-
The Edit Widget dialog opens. Name this widget "VM Throughput by Application"
-
Select Virtual Machine and choose Throughput - Total. Set any filters you wish, or leave Filter by empty. For Roll up, choose "Max" and select by "Application" or "Name". Show the Top 10 applications. Display this data as a Line Chart, and leave Y-Axis as Primary.
-
Click [Save] to add this widget to the dashboard.
You can move widgets on the dashboard by holding down the mouse button anywhere in the top of the widget and dragging it to a new location.
You can resize widgets by dragging the lower-right corner.
Be sure to [Save] the dashboard after you make your changes.
Your final VM Performance Dashboard will look something like this: