Data Infrastructure Insightsの新機能
 変更を提案
変更を提案
NetAppは、製品とサービスを継続的に改善および強化しています。ここでは、Data Infrastructure Insights (旧称Cloud Insights) で利用できる最新の機能の一部を紹介します。
2025年12月
共有クエリによるクエリアクセスの制御
きめ細かな権限制御を使用して作成したクエリを共有します。変更を防止するには読み取り専用のビューア モードを選択し、変更を許可するには編集モードを選択します。プライベートクエリには作成者がアクセスできますが、共有クエリは注釈ルールで活用したり、特殊なユースケース用に複製したりできるため、組織全体でクエリの使用方法や変更方法を完全に制御できます。
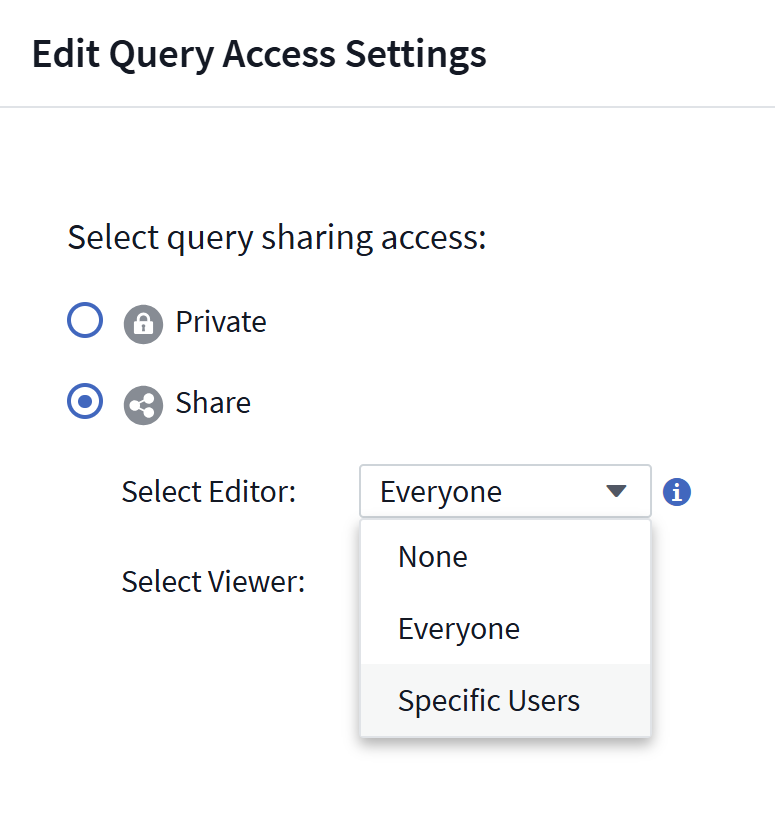
さらに、Guest ロールを持つユーザーは、独自のプライベートクエリを作成および管理できるようになりました。
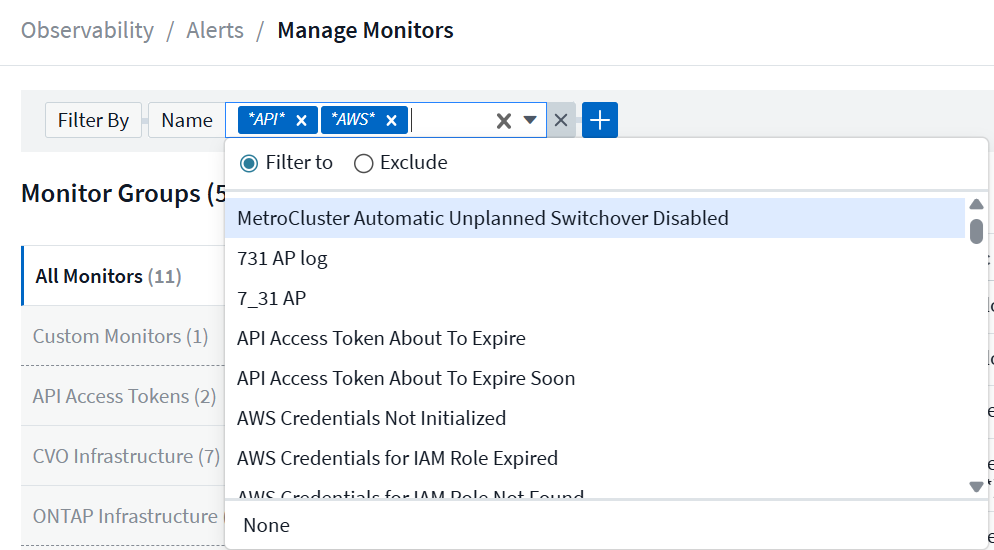
モニター管理時のフィルタリングの改善
モニター リストとグループのフィルタリングが改善され、ワイルドカード サポート、複数のフィルタ、含める/除外する機能などが追加されました。
よりクリーンなダッシュボードの視覚化
ダッシュボードのデザインが改善され、最も重要な情報を把握しやすくなりました。ウィジェットを区切るドロップ シャドウ ボーダーによって視覚的な明瞭性が向上し、区切り線が削除されたことで乱雑さが軽減され、データの分析に集中できるようになりました。これらの改良により、よりクリーンで直感的なダッシュボード エクスペリエンスが実現し、傾向や異常をより迅速かつ容易に発見できるようになります。
2025年11月
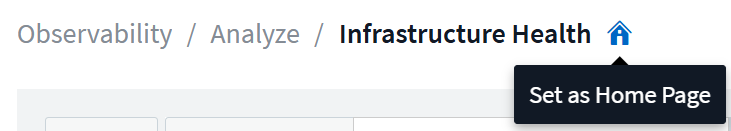
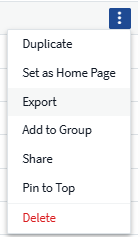
パーソナライズされたホームページを設定する
任意のData Infrastructure Insightsページをパーソナライズされたホームページとして設定することで、毎日の監視ワークフローを効率化します。各ユーザーは、重要なダッシュボード、アラート、インフラストラクチャの健全性、ワークロードのセキュリティなど、自分にとって重要なものに集中するために、異なるホームページを選択できます。
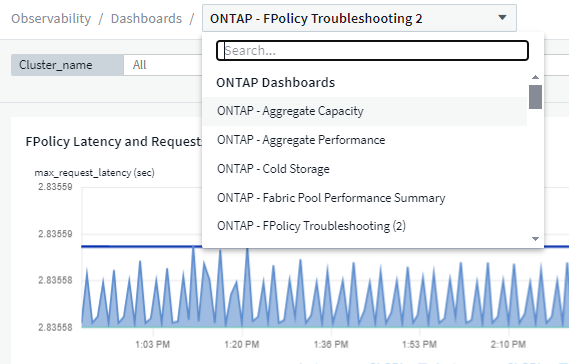
自動ダッシュボードグループ化で整理整頓
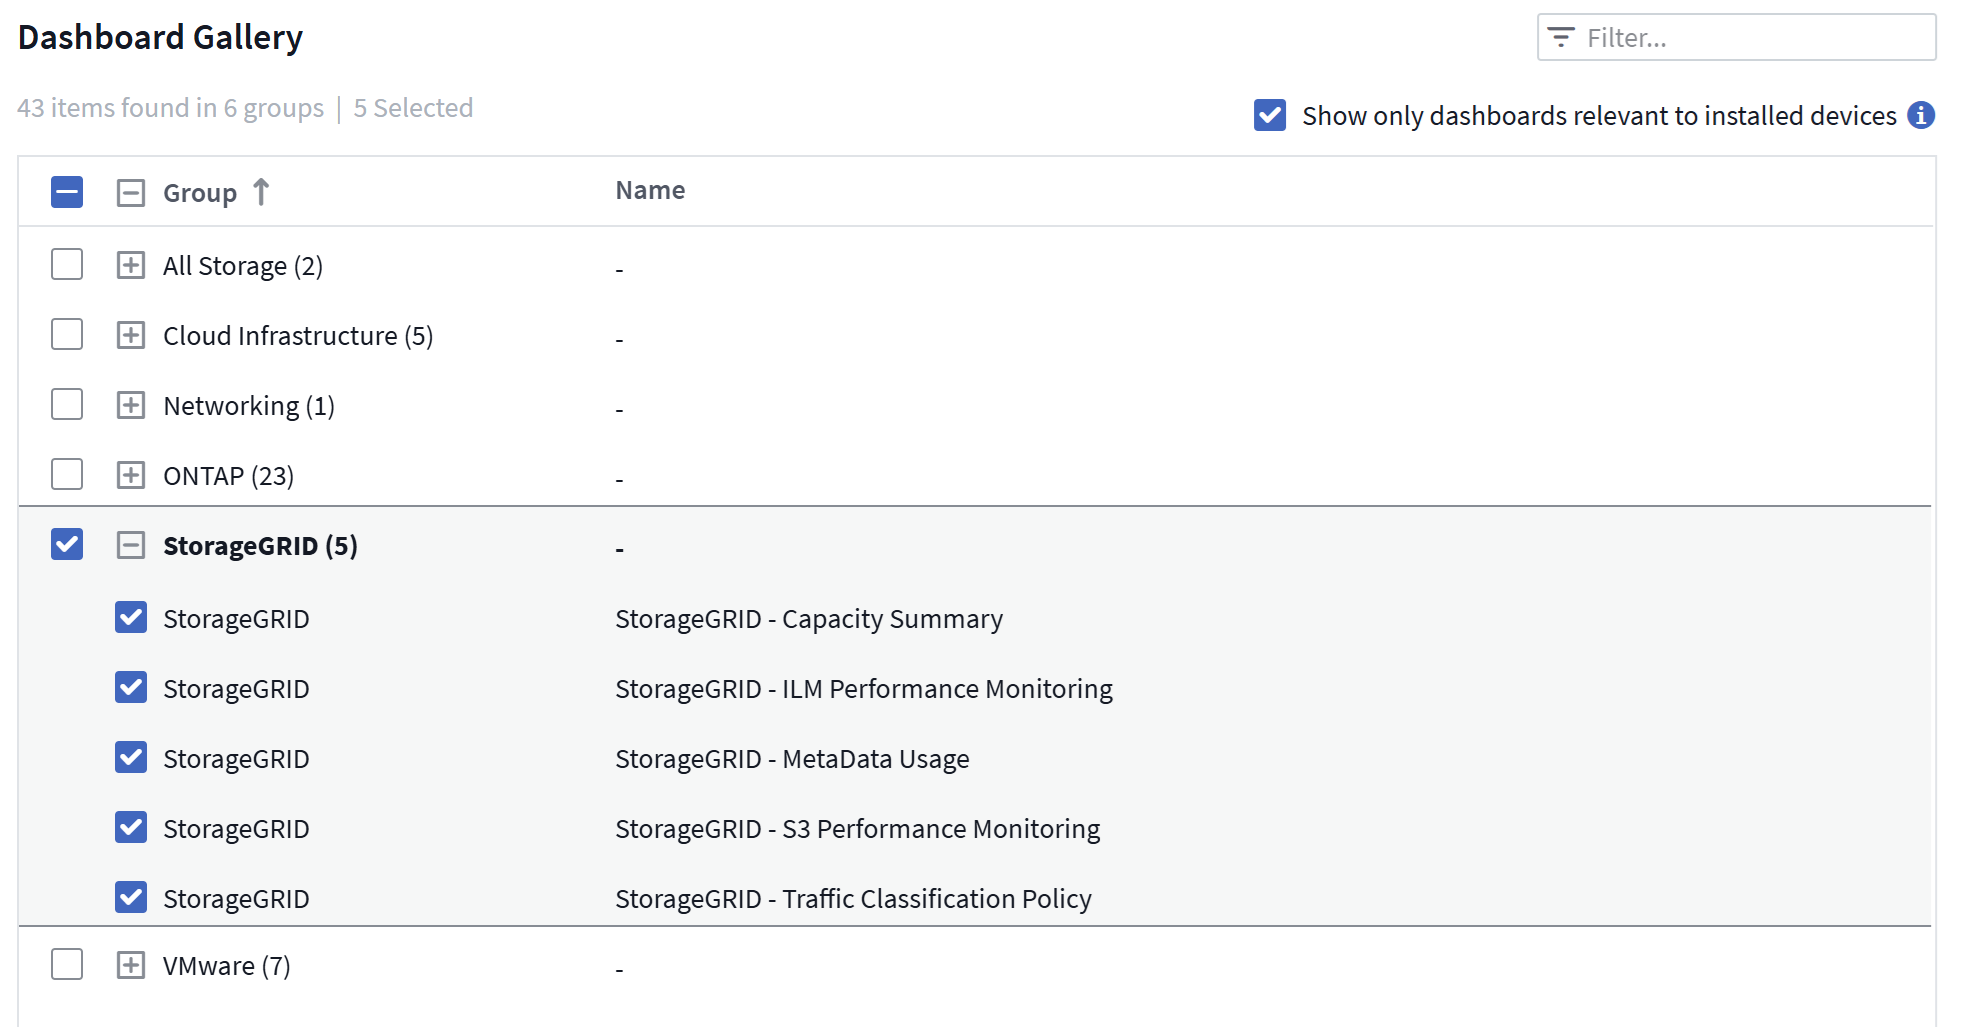
インポートされたギャラリー ダッシュボードを論理カテゴリに自動的に整理するインテリジェントなグループ化により、ダッシュボードのエクスペリエンスを変革します。新しいグループ化機能により、ダッシュボードのインポートが簡単になり、各ダッシュボードがその機能と環境との関連性に基づいて適切なグループに配置されます。
2025年10月
インフラストラクチャの健全性: ストレージとファブリックのリスクを即座に可視化
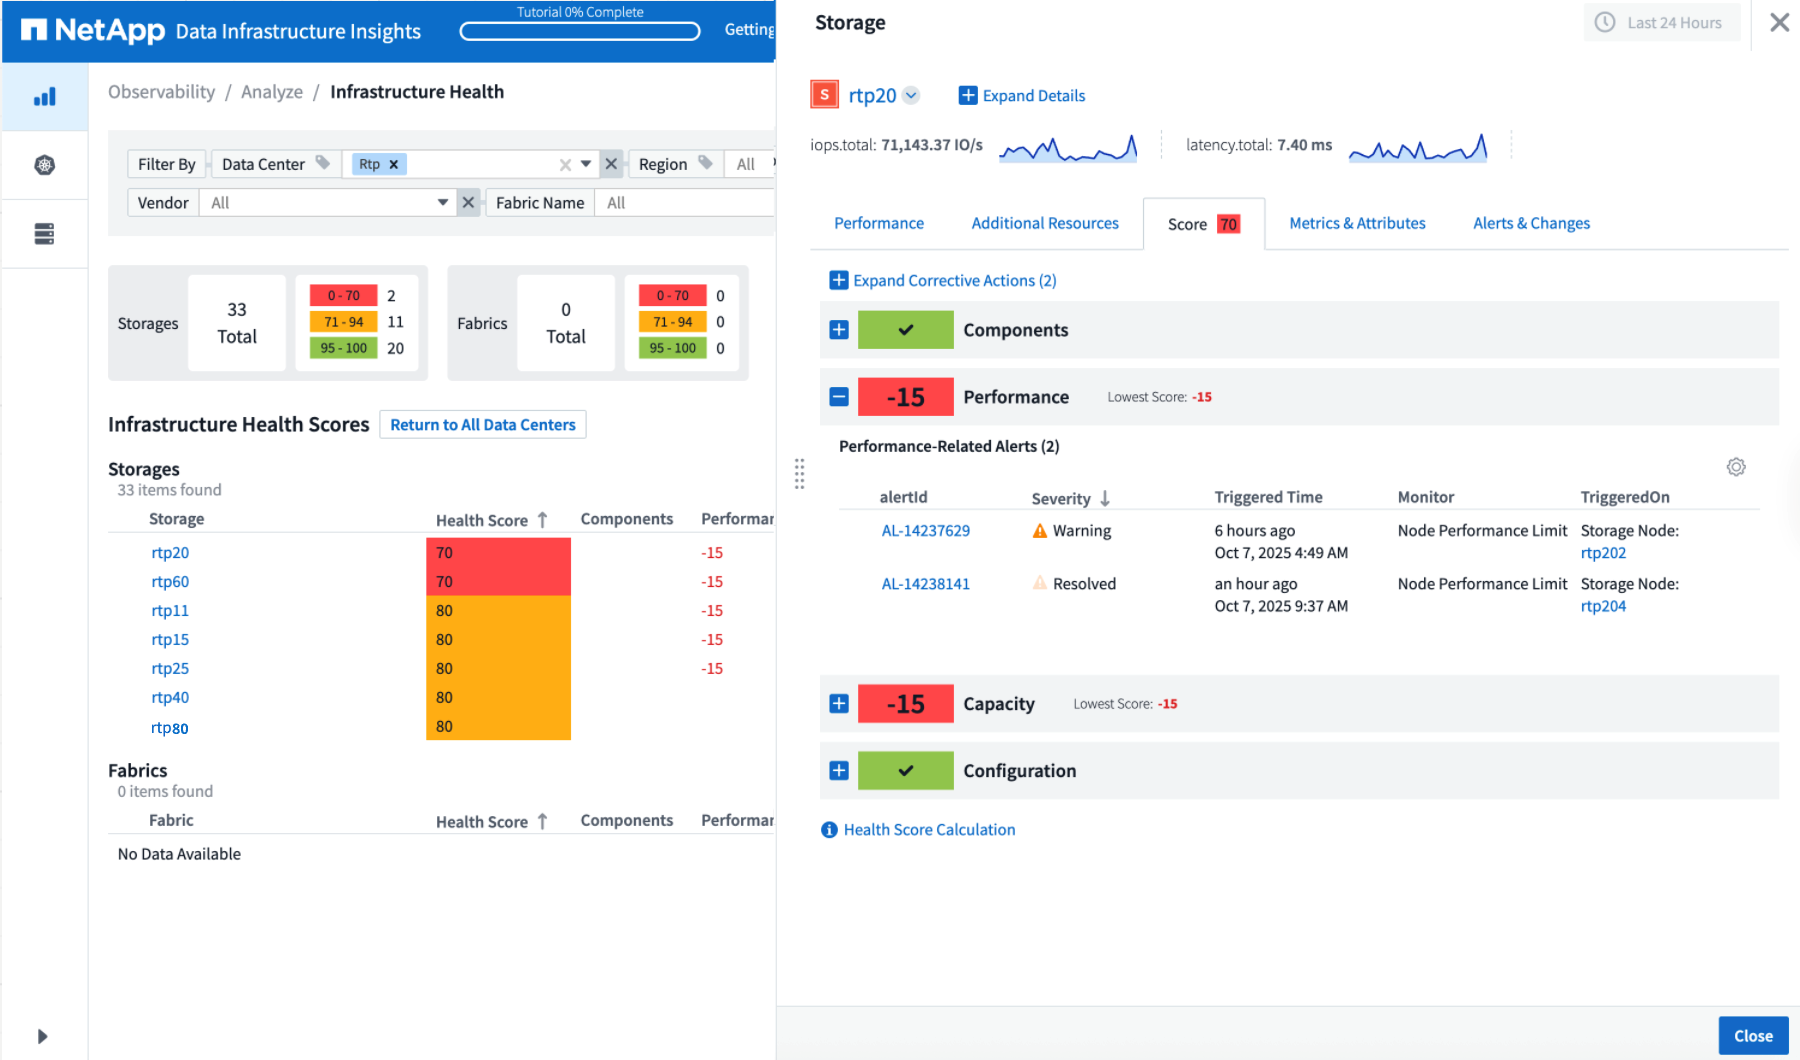
新しい インフラストラクチャの健全性 機能を使用すると、ストレージとファブリック全体の潜在的なリスクを即座に把握できます。単一の色分けされたダッシュボードにより、統合されたリスクの可視性が得られ、ダウンタイムを最小限に抑え、収益損失を迅速に軽減できます。
100 未満のスコアは潜在的な問題を示します。スコアが低いほど、リソースの健全性が低くなります。データ センターまたはリージョン別にリソースをグループ化して、直感的で統合されたヘルス スコアを得ることで、重要な領域の優先順位付けやトラブルシューティングを簡単に行うことができます。
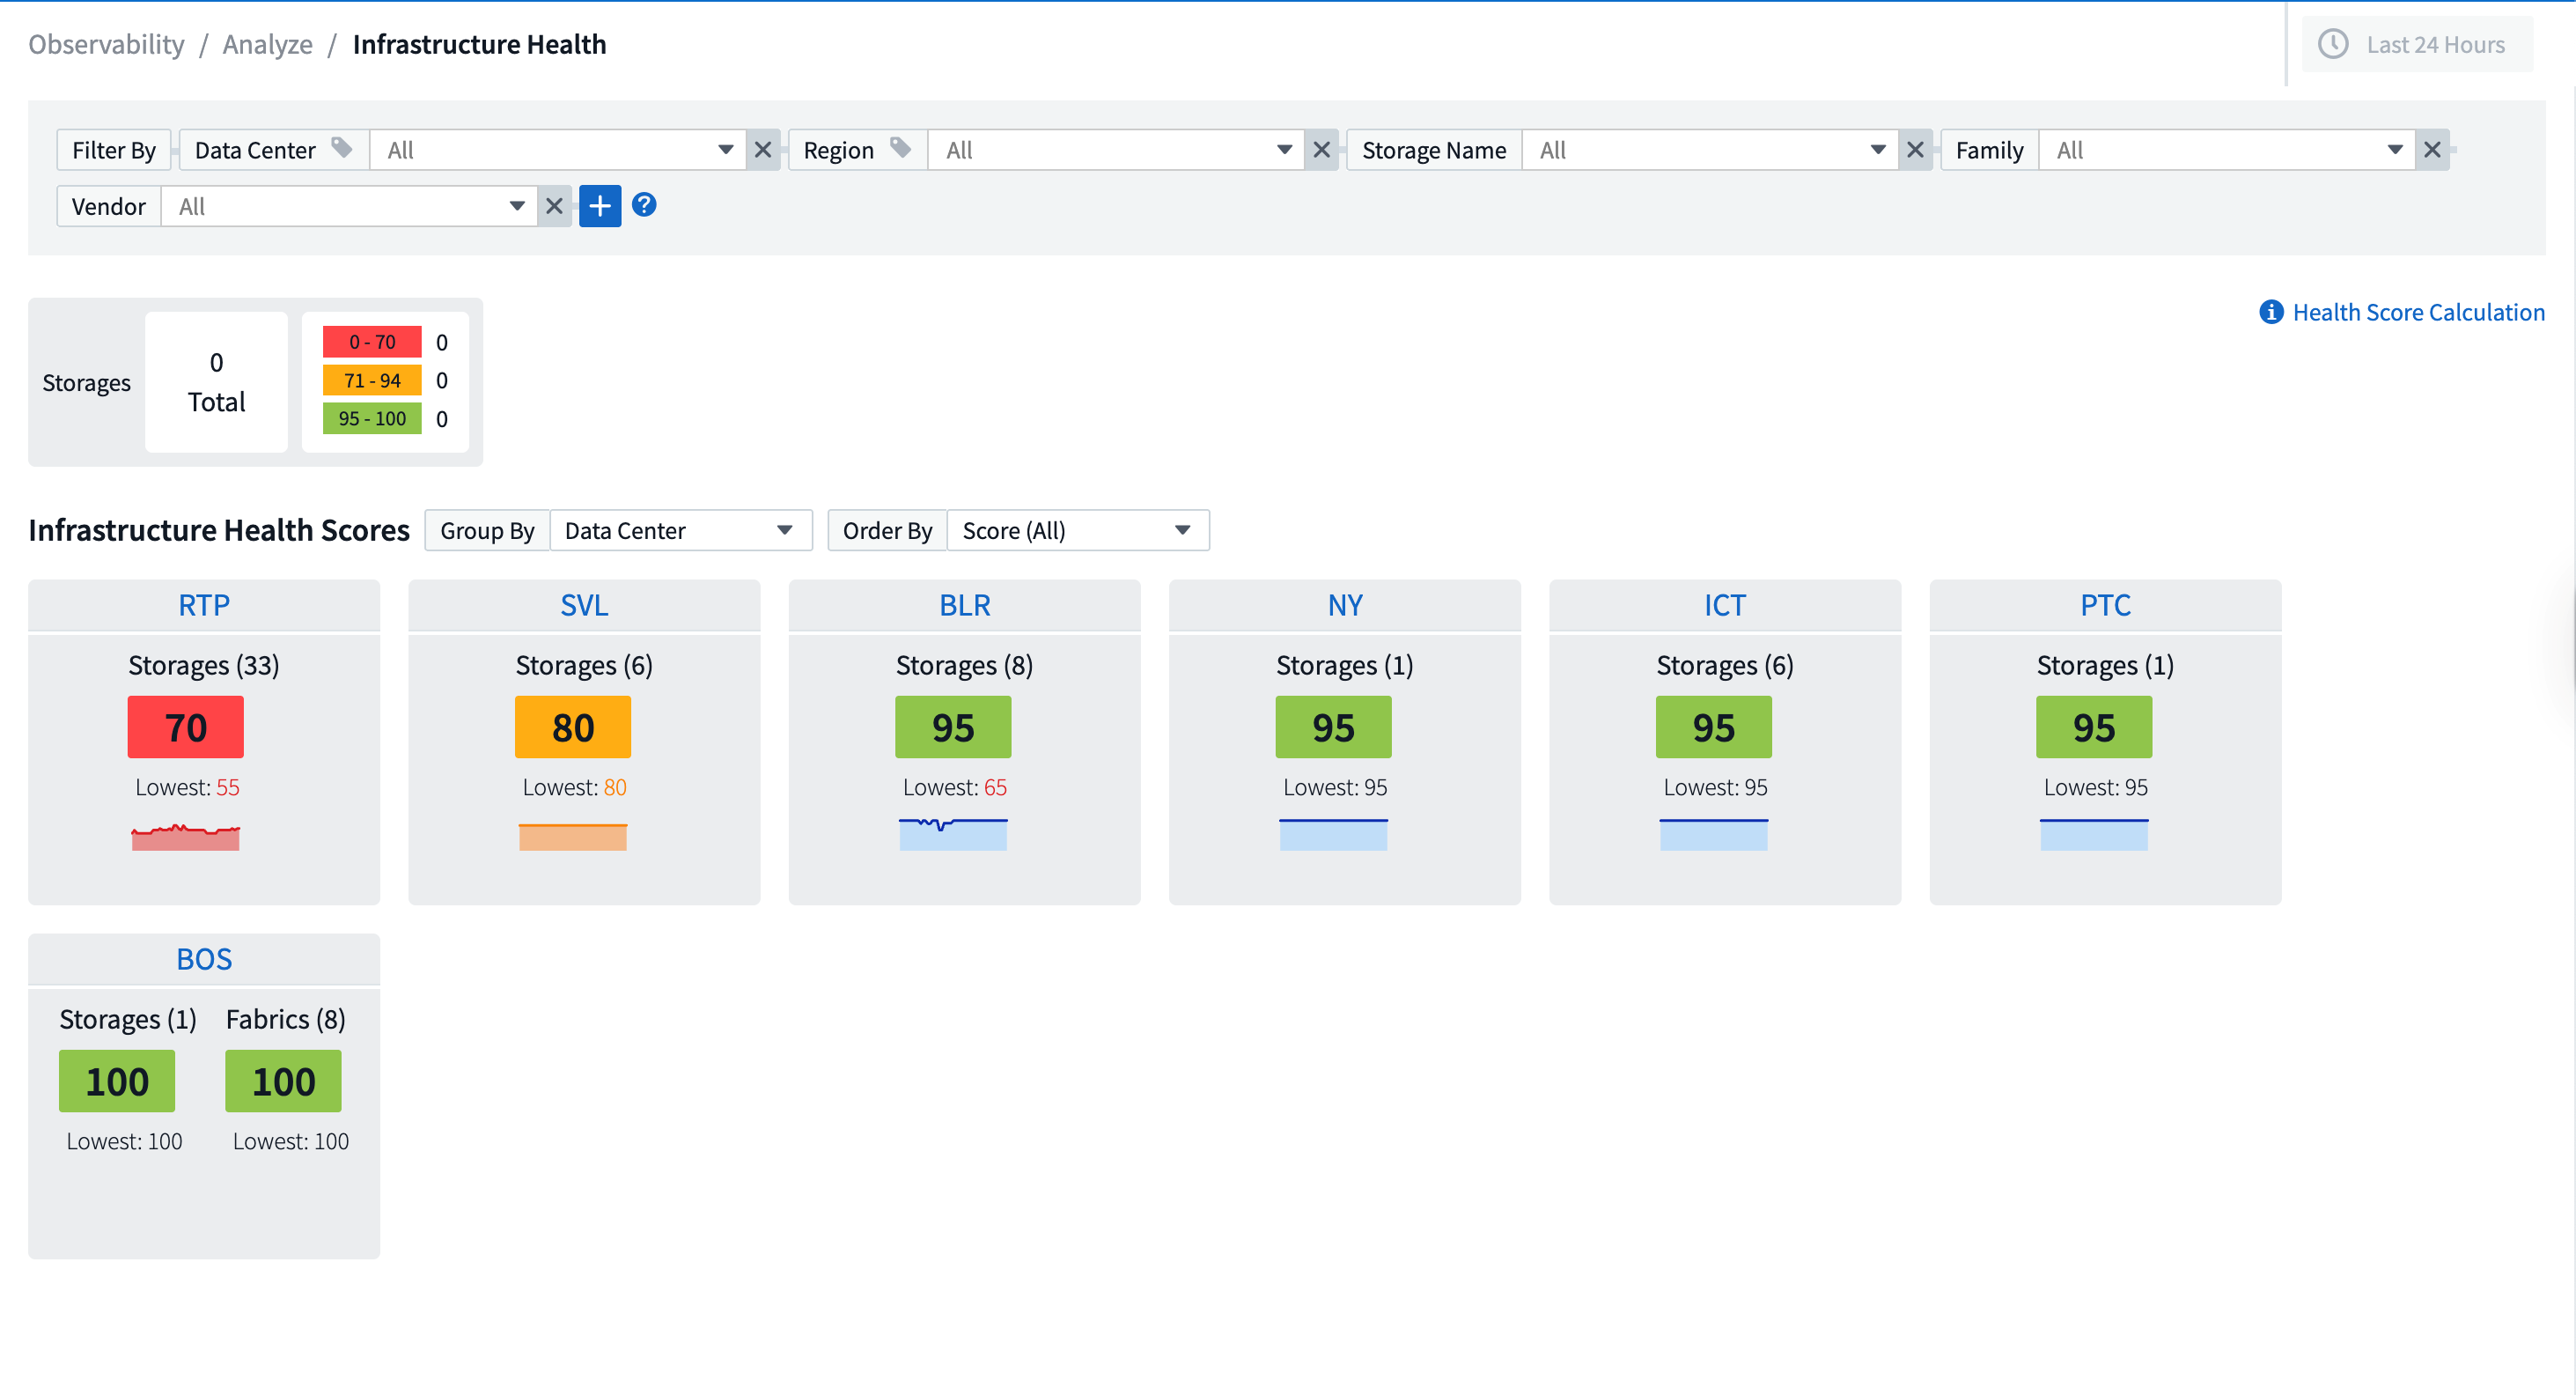
ボタンをクリックするだけで画面上のスライドアウト パネルに詳細情報が表示されるため、注意が必要な問題を迅速に特定し、システムの安全性と回復力を維持できます。
正確な警告のためのマルチコンディションモニター
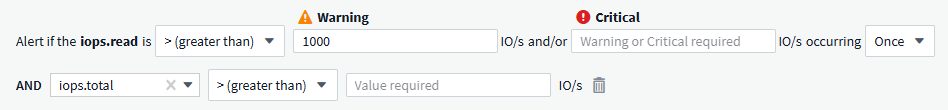
オプションの 2 番目の条件をメトリック モニターに追加することで、アラート ノイズを削減し、監視の精度を向上します。アラートは両方の条件が満たされた場合にのみトリガーされるため、最も重要なシナリオに重点を置いた、よりターゲットを絞った通知が提供されます。
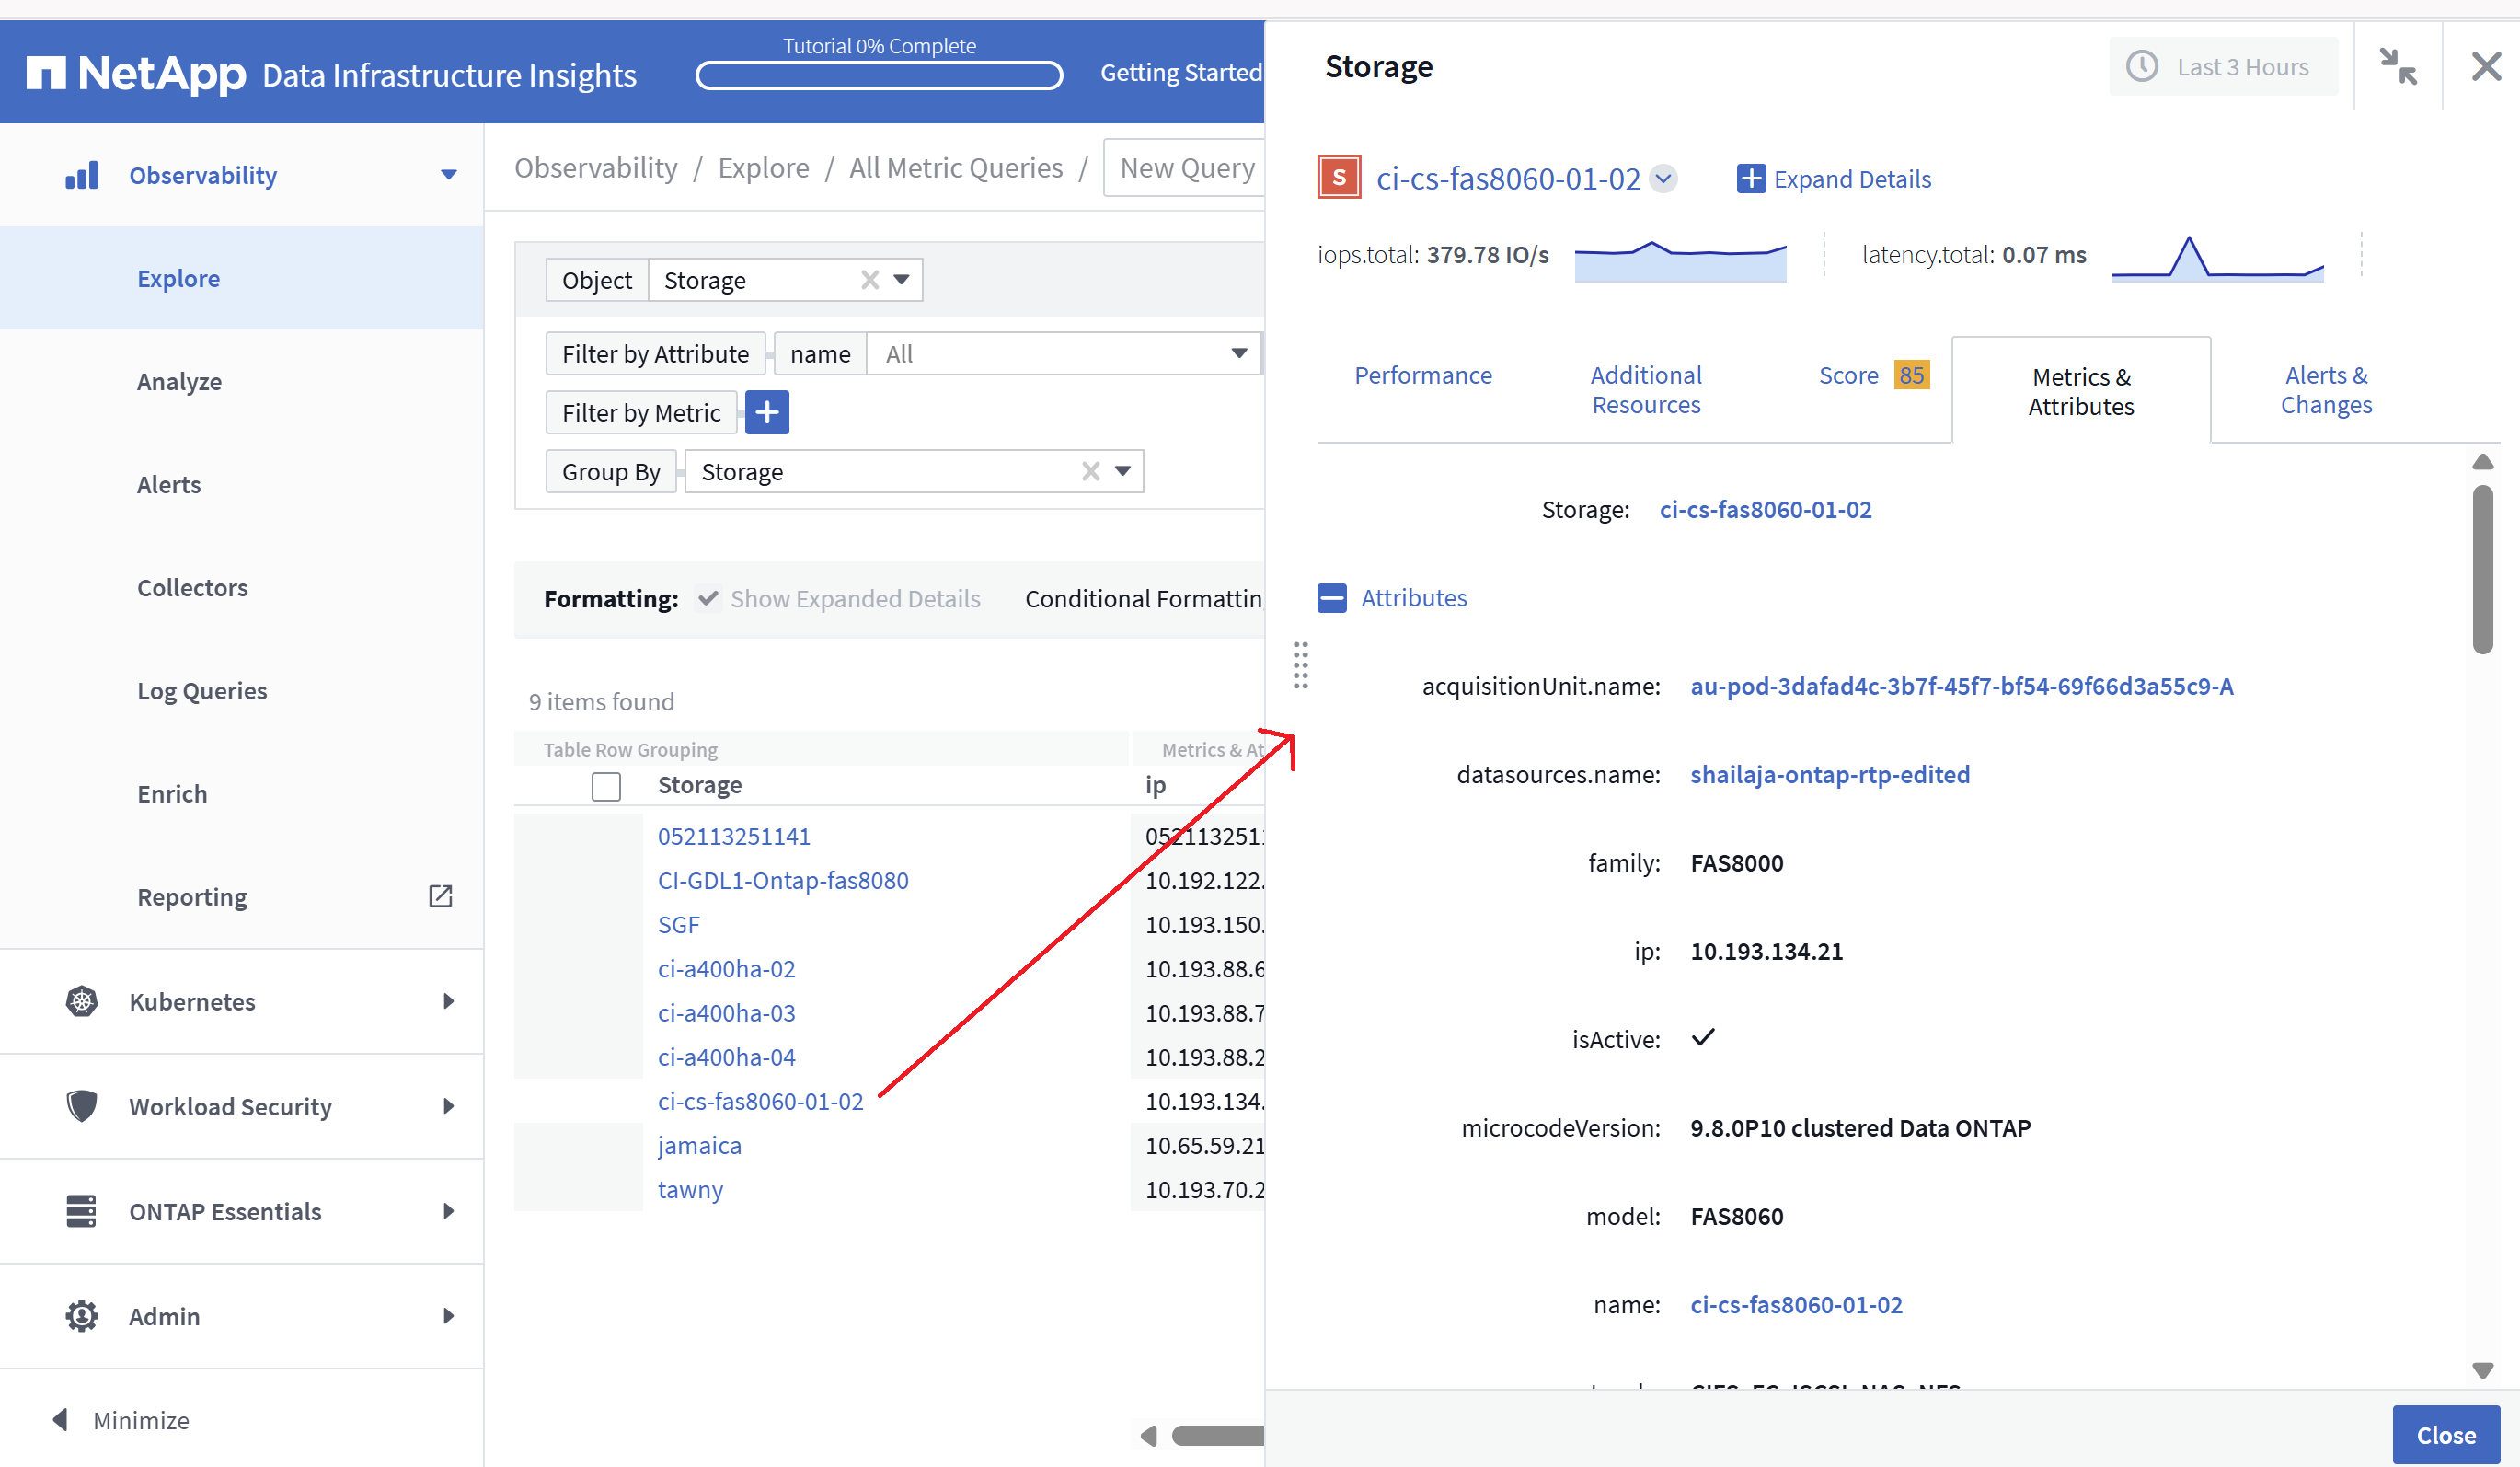
クエリの改善: 一目でわかるオブジェクトの詳細
オブジェクト クエリ結果リストの行を選択すると、選択したオブジェクトの詳細パネルが開きます。メトリックと属性 (オブジェクト クエリのデフォルト ビュー)、アラートと変更、パフォーマンス、ヘルス スコアをすばやく表示したり、関連リソースを調べたりできます。関連するオブジェクト情報はすべてすぐに入手できます。
ワークロードセキュリティの改善
2 つの新しい API により、Workload Security 環境をより詳細に制御できるようになります。
-
GET /rest/v1/cloudsecure/activities/groups を使用してグループを表示および管理します。
-
POST /rest/v1/cloudsecure/collectors/{collector-uuid}/status を使用してデータコレクターを一時停止および再開します。
さらに、Workload Security ロールの権限チェックがさらに安全になりました。セキュリティが強化された結果、既存のユーザーの一部はコレクターを追加するときに権限の問題が発生する可能性があります。指示に従ってユーザー権限を確認してください。"ドキュメント" 。
2025年8月
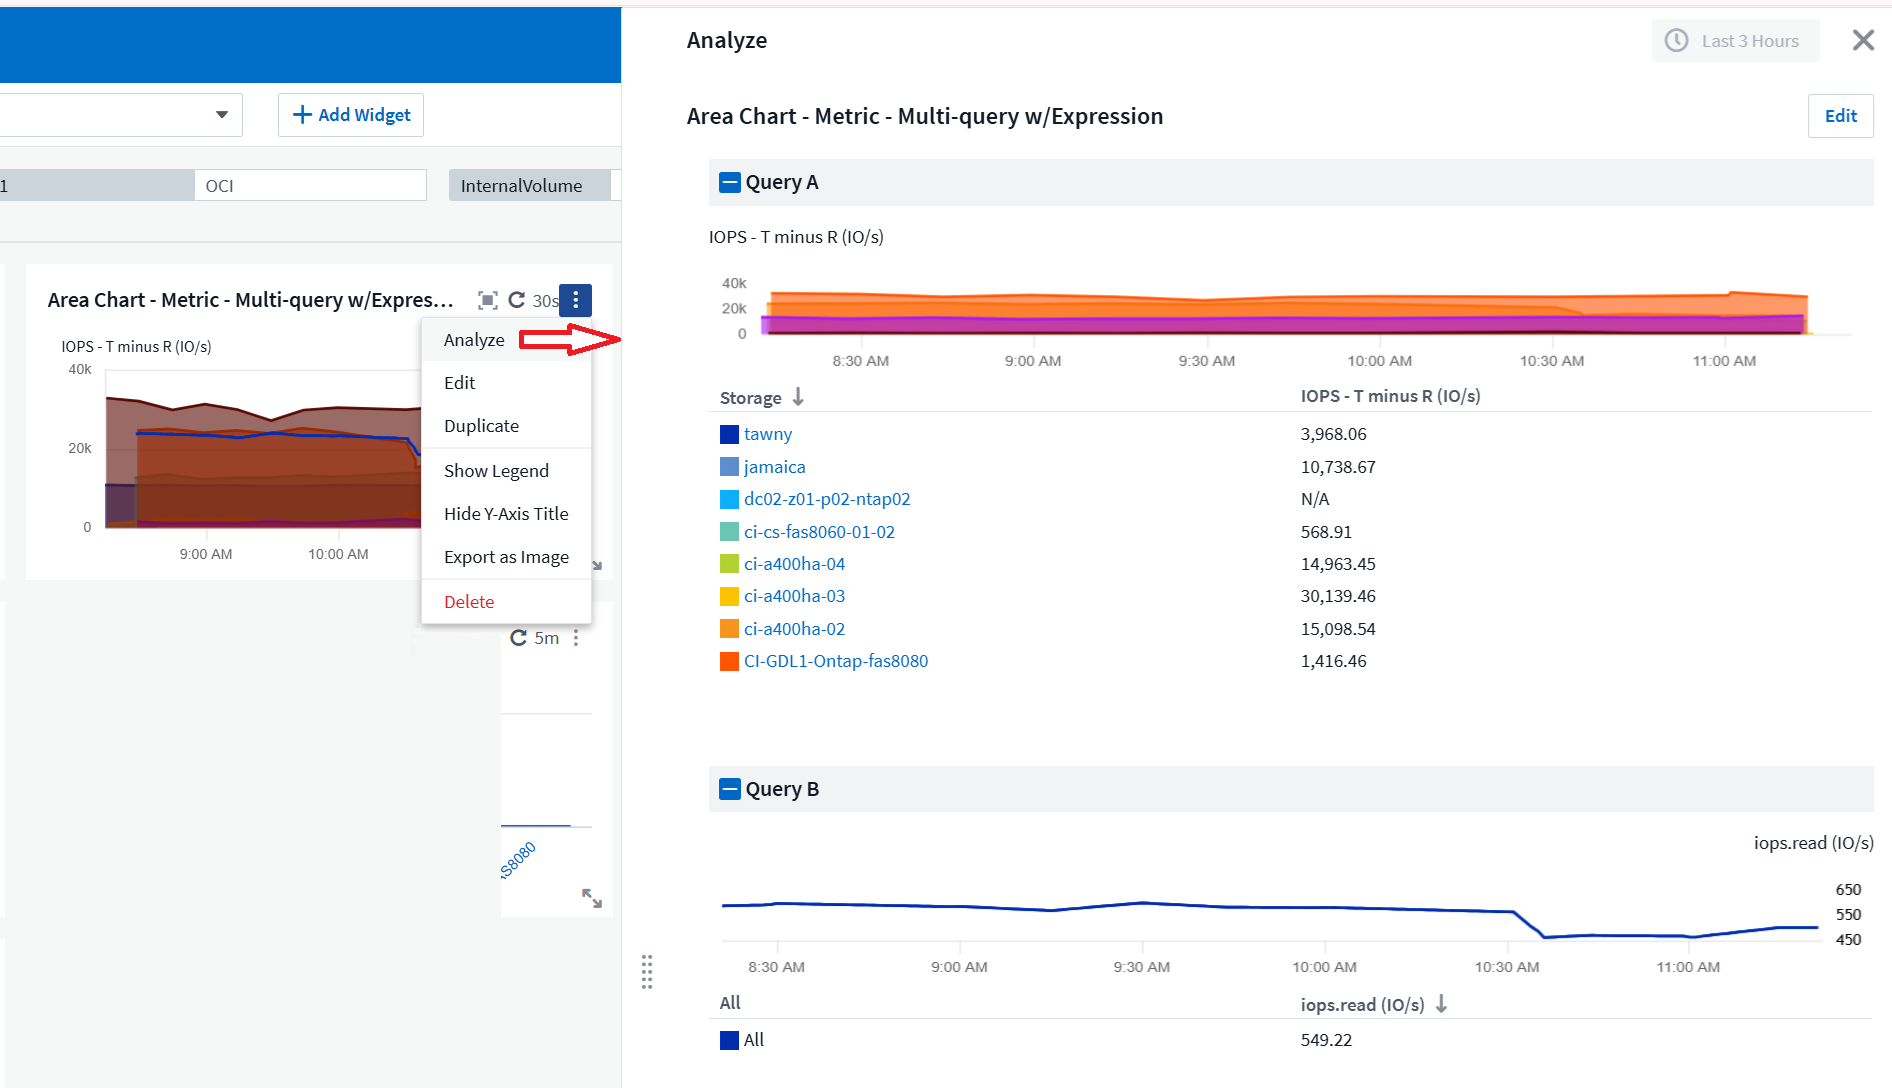
指先で操作できる集中ウィジェットデータ
ほとんどのウィジェットの新しい 分析 機能を使用すると、一度に 1 つのウィジェットのデータを詳しく調べることができます。ウィジェットの「分析」ボタンをクリックするだけで詳細ビューが開き、ダッシュボードのコンテキストを離れることなく、基礎となるデータをインタラクティブに探索し、ズームインしてより深い洞察を得ることができます。
ダッシュボードのエクスポートとインポート
複数のテナントを管理していて、便利なダッシュボードを開発している場合は、ダッシュボードをエクスポートして別のテナントにインポートできます。

強化されたクラウド統合: Google Cloud NetApp Volumes (GCNV) のサポート
-
Google Cloud NetApp Volumes* (GCNV) が DII のデータ コレクターとして完全にサポートされるようになり、ハイブリッド クラウド監視のエコシステムが完成しました。インフラストラクチャ全体の組織、プール、ボリュームなどの重要なストレージ オブジェクトを可視化します。オンプレミスでもクラウドでも、すべてのストレージ環境を単一のプラットフォームから追跡できるようになりました。
強化されたStorageGRID監視
StorageGRIDログ収集がデフォルトで有効になり、DII にイベント追跡データが提供されるようになりました。また、50 を超えるデフォルトのアラート、リアルタイム イベント追跡、および新しいダッシュボードによって StorageGrid 監視が拡張され、複雑なストレージ グリッド操作が簡素化されました。トラフィック ポリシーとバケットのパフォーマンスに関する詳細な情報を活用して、問題を事前に把握します。
オペレーティングシステムのサポート
Data Infrastructure Insights Acquisition Unitsでは、以下のオペレーティングシステムがサポートされるようになりました。"すでにサポートされています" :
-
AlmaLinux(64ビット)10
-
Red Hat (64ビット) 10
-
Rocky(64ビット)9.6
2025年6月
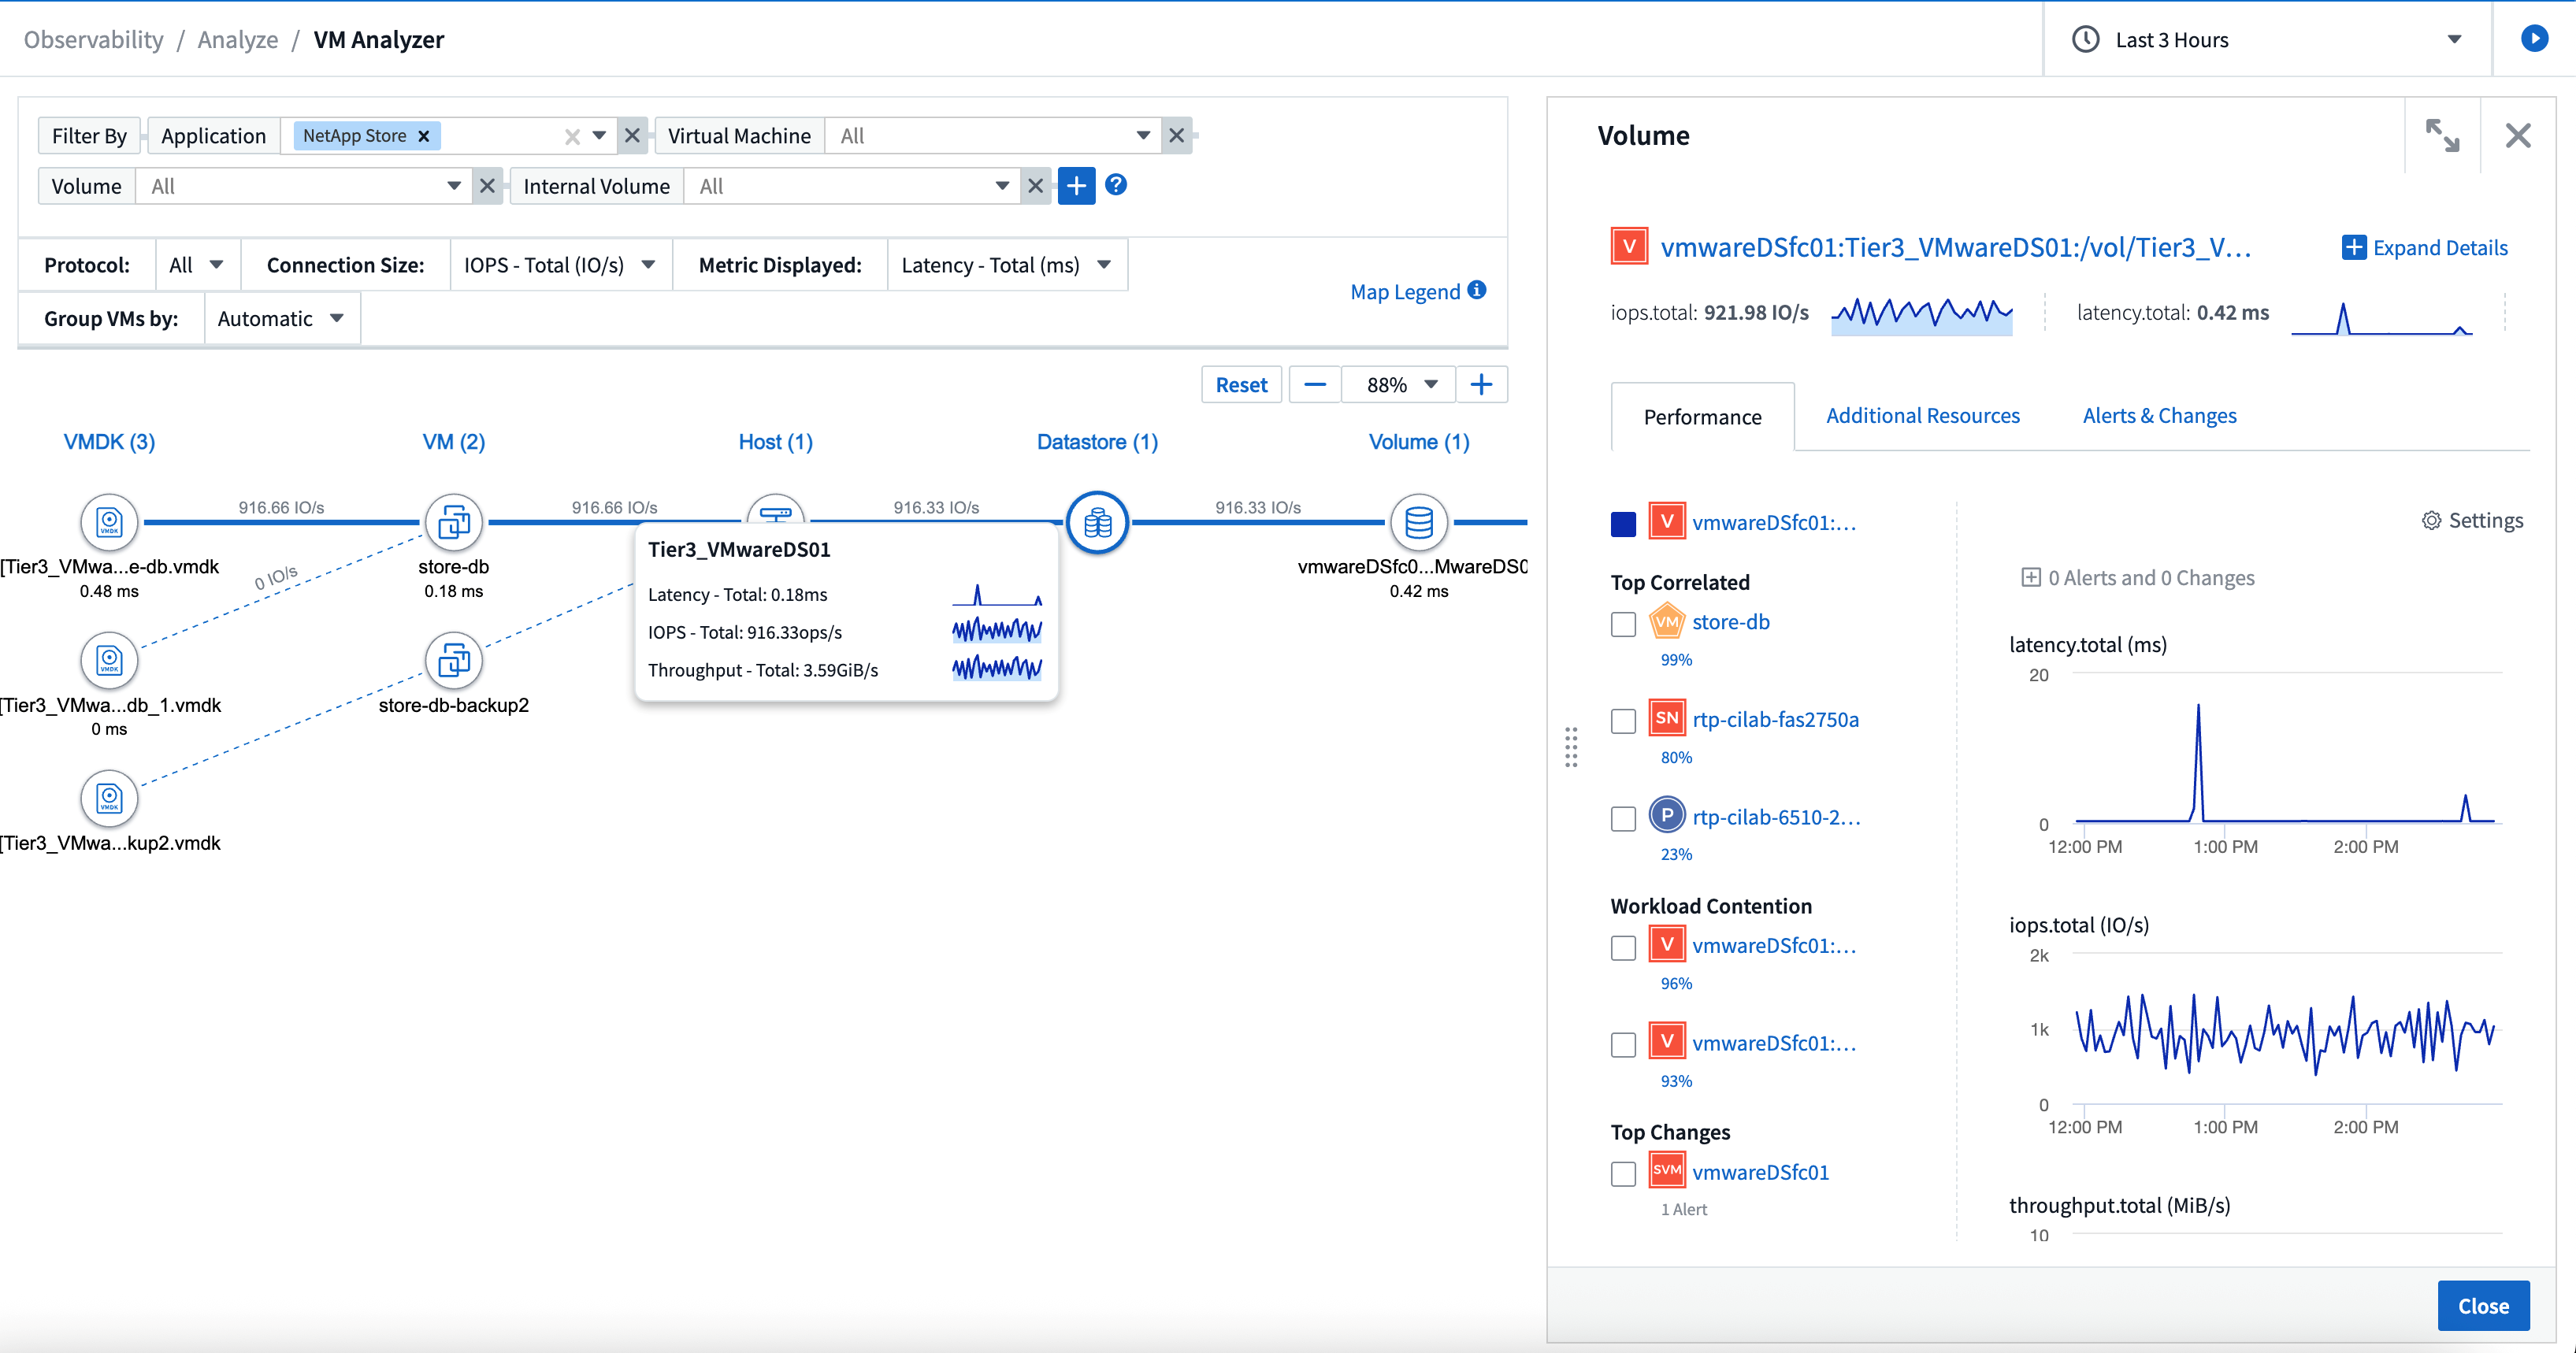
VM Analyzer: VMからストレージまでの包括的な可視性とトラブルシューティング
DII の VM Analyzer 機能は、仮想化環境の包括的なエンドツーエンドのビューを提供します。 VM Analyzer は、仮想マシンからストレージまでのパス全体をマッピングすることでトラブルシューティングを効率化し、仮想ディスク、VM、ホスト、データストア、ボリューム、ストレージ全体のパフォーマンスの問題をユーザーが迅速に特定できるようにします。直感的なトポロジ ビュー、フィルタリング、詳細なパフォーマンス メトリックにより、管理者はボトルネックを簡単に特定し、トラフィックの不均衡を分析し、全体的なストレージ パフォーマンスを最適化できます。
オペレーティングシステムのサポート
Data Infrastructure Insights Acquisition Unitsでは、以下のオペレーティングシステムがサポートされるようになりました。"すでにサポートされています" :
-
Debian (64ビット) 12
-
Oracle Enterprise Linux (64 ビット) 9.6
-
Red Hat (64ビット) 9.6
2025年5月
新しいランディングページで流れを維持
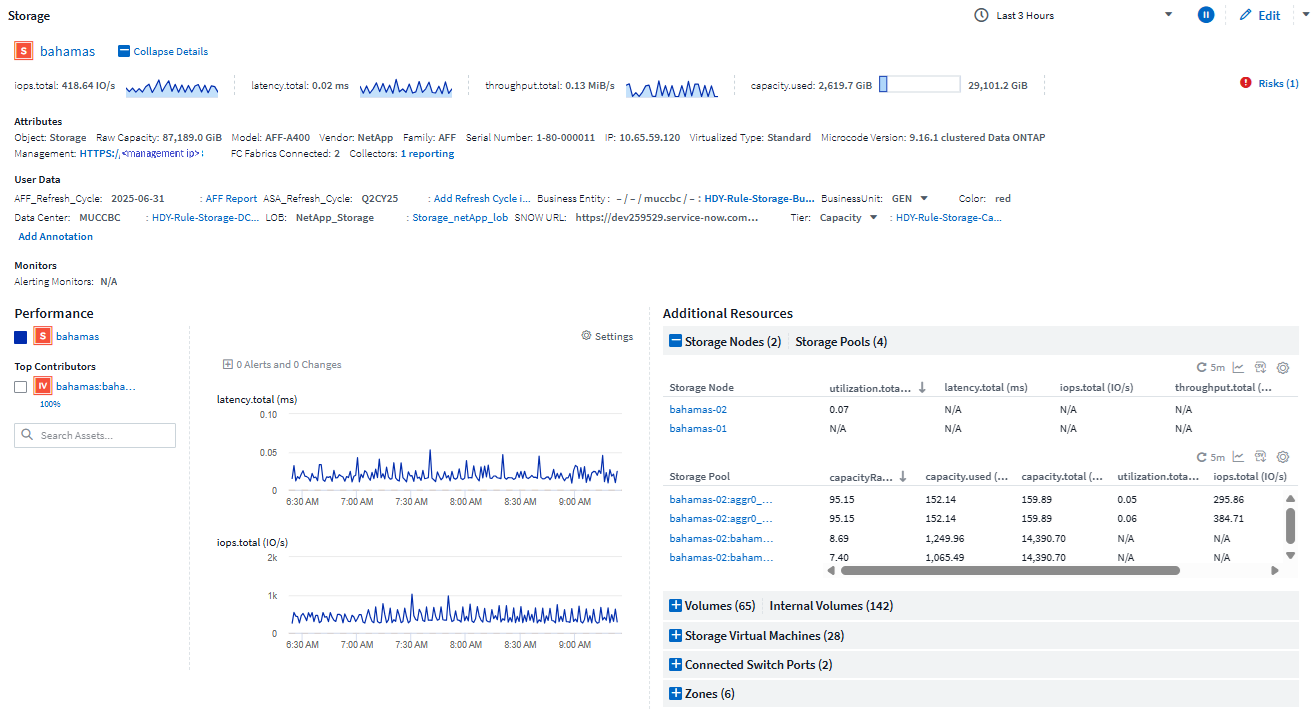
再設計されたランディング ページには、概要データ、パフォーマンス チャート、相関関係、アラートと変更、主要なリソースなど、必要なものがすべて 1 つのビューに表示されます。
タブ間を移動したり、コンテキストを失ったりすることなく、トラブルシューティングを高速化し、作業の流れを維持できるようになりました。
ワークロードセキュリティの改善
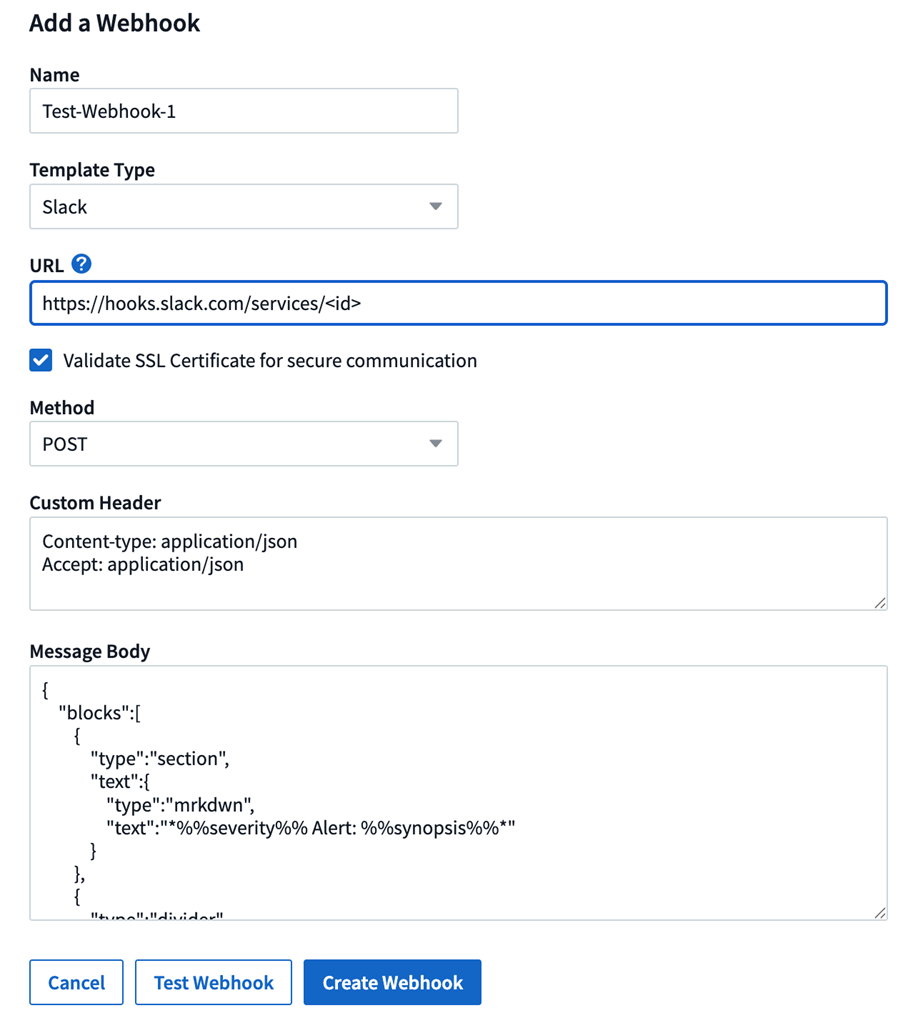
ワークロード セキュリティ アラートに Webhook が利用可能になりました
Workload Security では、Slack、PagerDuty、Teams などのツールへのすぐに使用できる Webhook 通知がサポートされるようになりました。さらに、メッセージをカスタマイズしたり、他の SIEM やサードパーティ アプリケーションと統合したりできるカスタマイズ可能なテンプレートも提供しています。重要なアラートを既存のセキュリティ ワークフローに直接ルーティングすることで、チームはより迅速に調査して対応できるようになります。
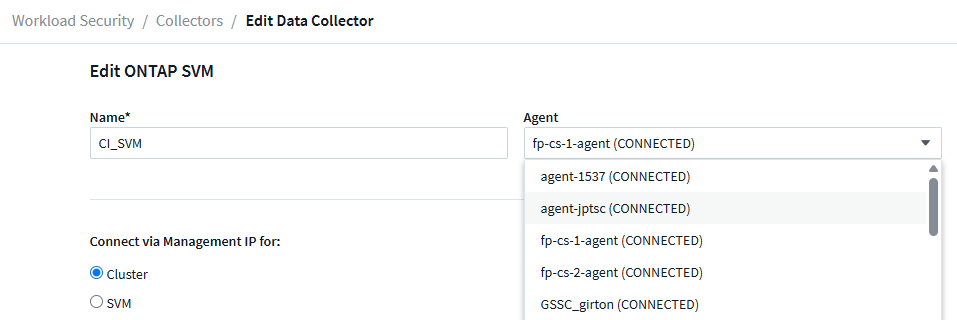
エージェント間でワークロード セキュリティ コレクターを移行する
Workload Security コレクターをあるエージェントから別のエージェントに簡単に移行できるため、エージェント間でコレクターの負荷を効率的に分散できます。移行は、コレクターを編集し、リストから宛先エージェントを選択するだけで簡単です。
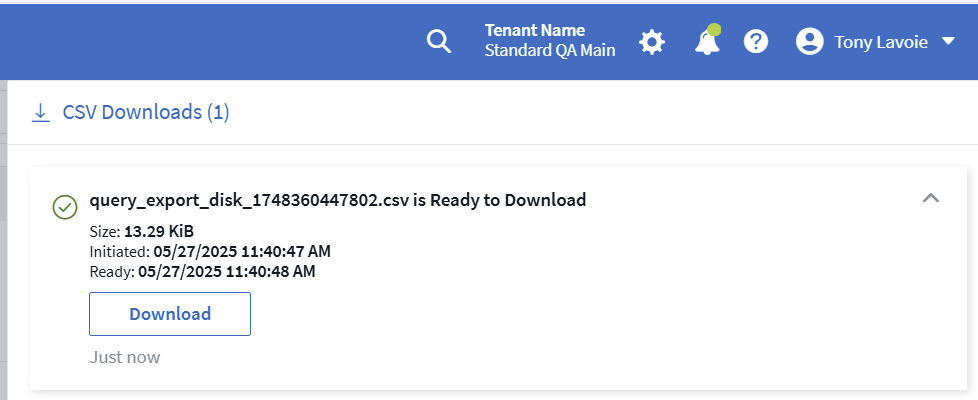
.CSV 非同期エクスポート
右上のツールバーの「ベル」アイコンを選択して、.CSV エクスポートを表示します。
2025年4月
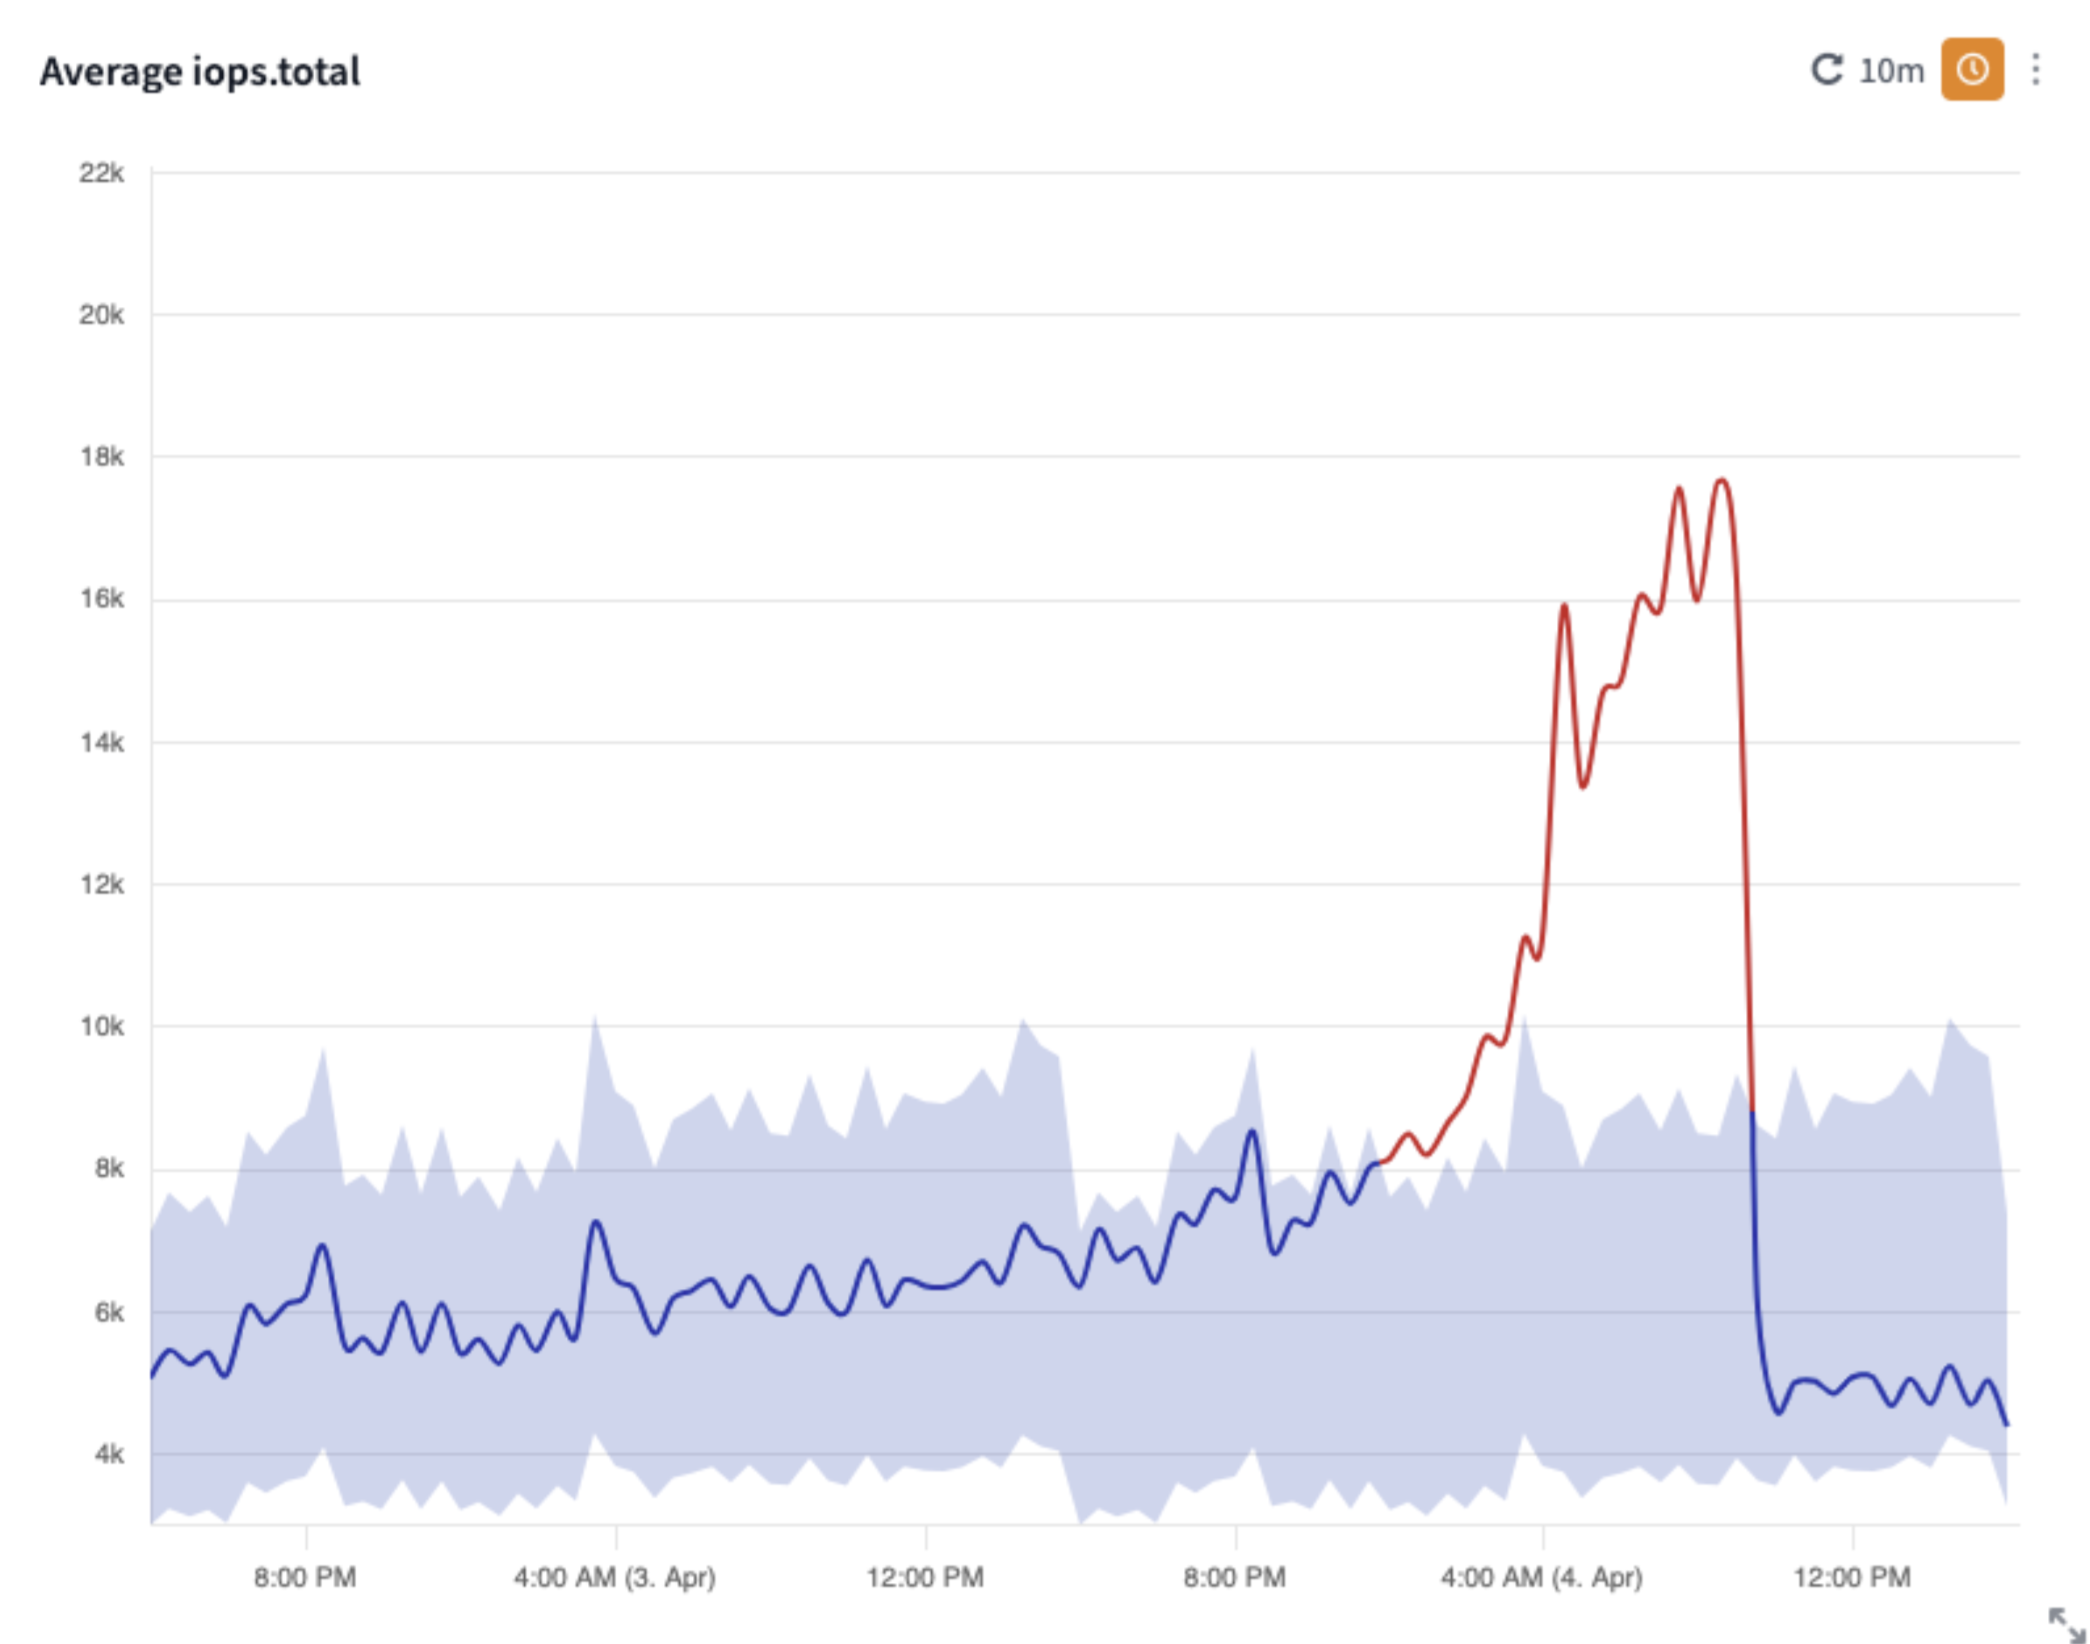
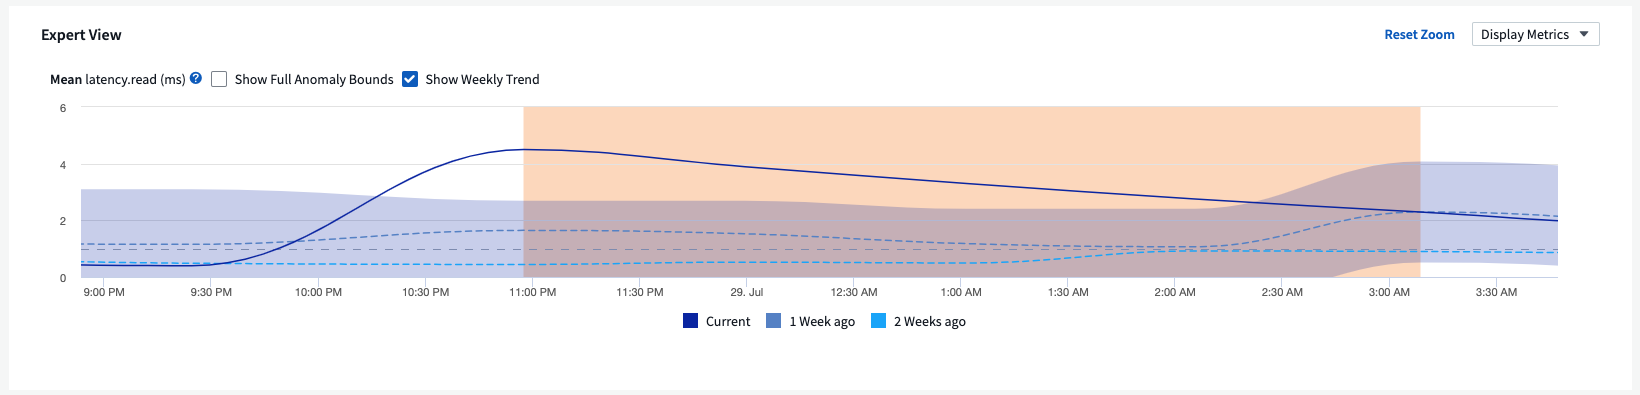
プロアクティブな問題解決のためのラインウィジェットにおける ML を活用した異常境界
折れ線グラフまたはスプライン グラフ ウィジェットのパフォーマンスの問題をトラブルシューティングするために、実際のメトリックとともに予想される動作の境界を表示できるようになりました。これにより、正常なメトリックの傾向と異常なメトリックの傾向を区別できます。
季節データ分析を備えた DII 機械学習は、履歴パターンに基づいてインテリジェントなしきい値を確立します。メトリクスが予想範囲から外れると、システムはそれを異常として強調表示し、問題を迅速に特定して平均解決時間を短縮し、問題が運用に影響する前に対処できるようにします。
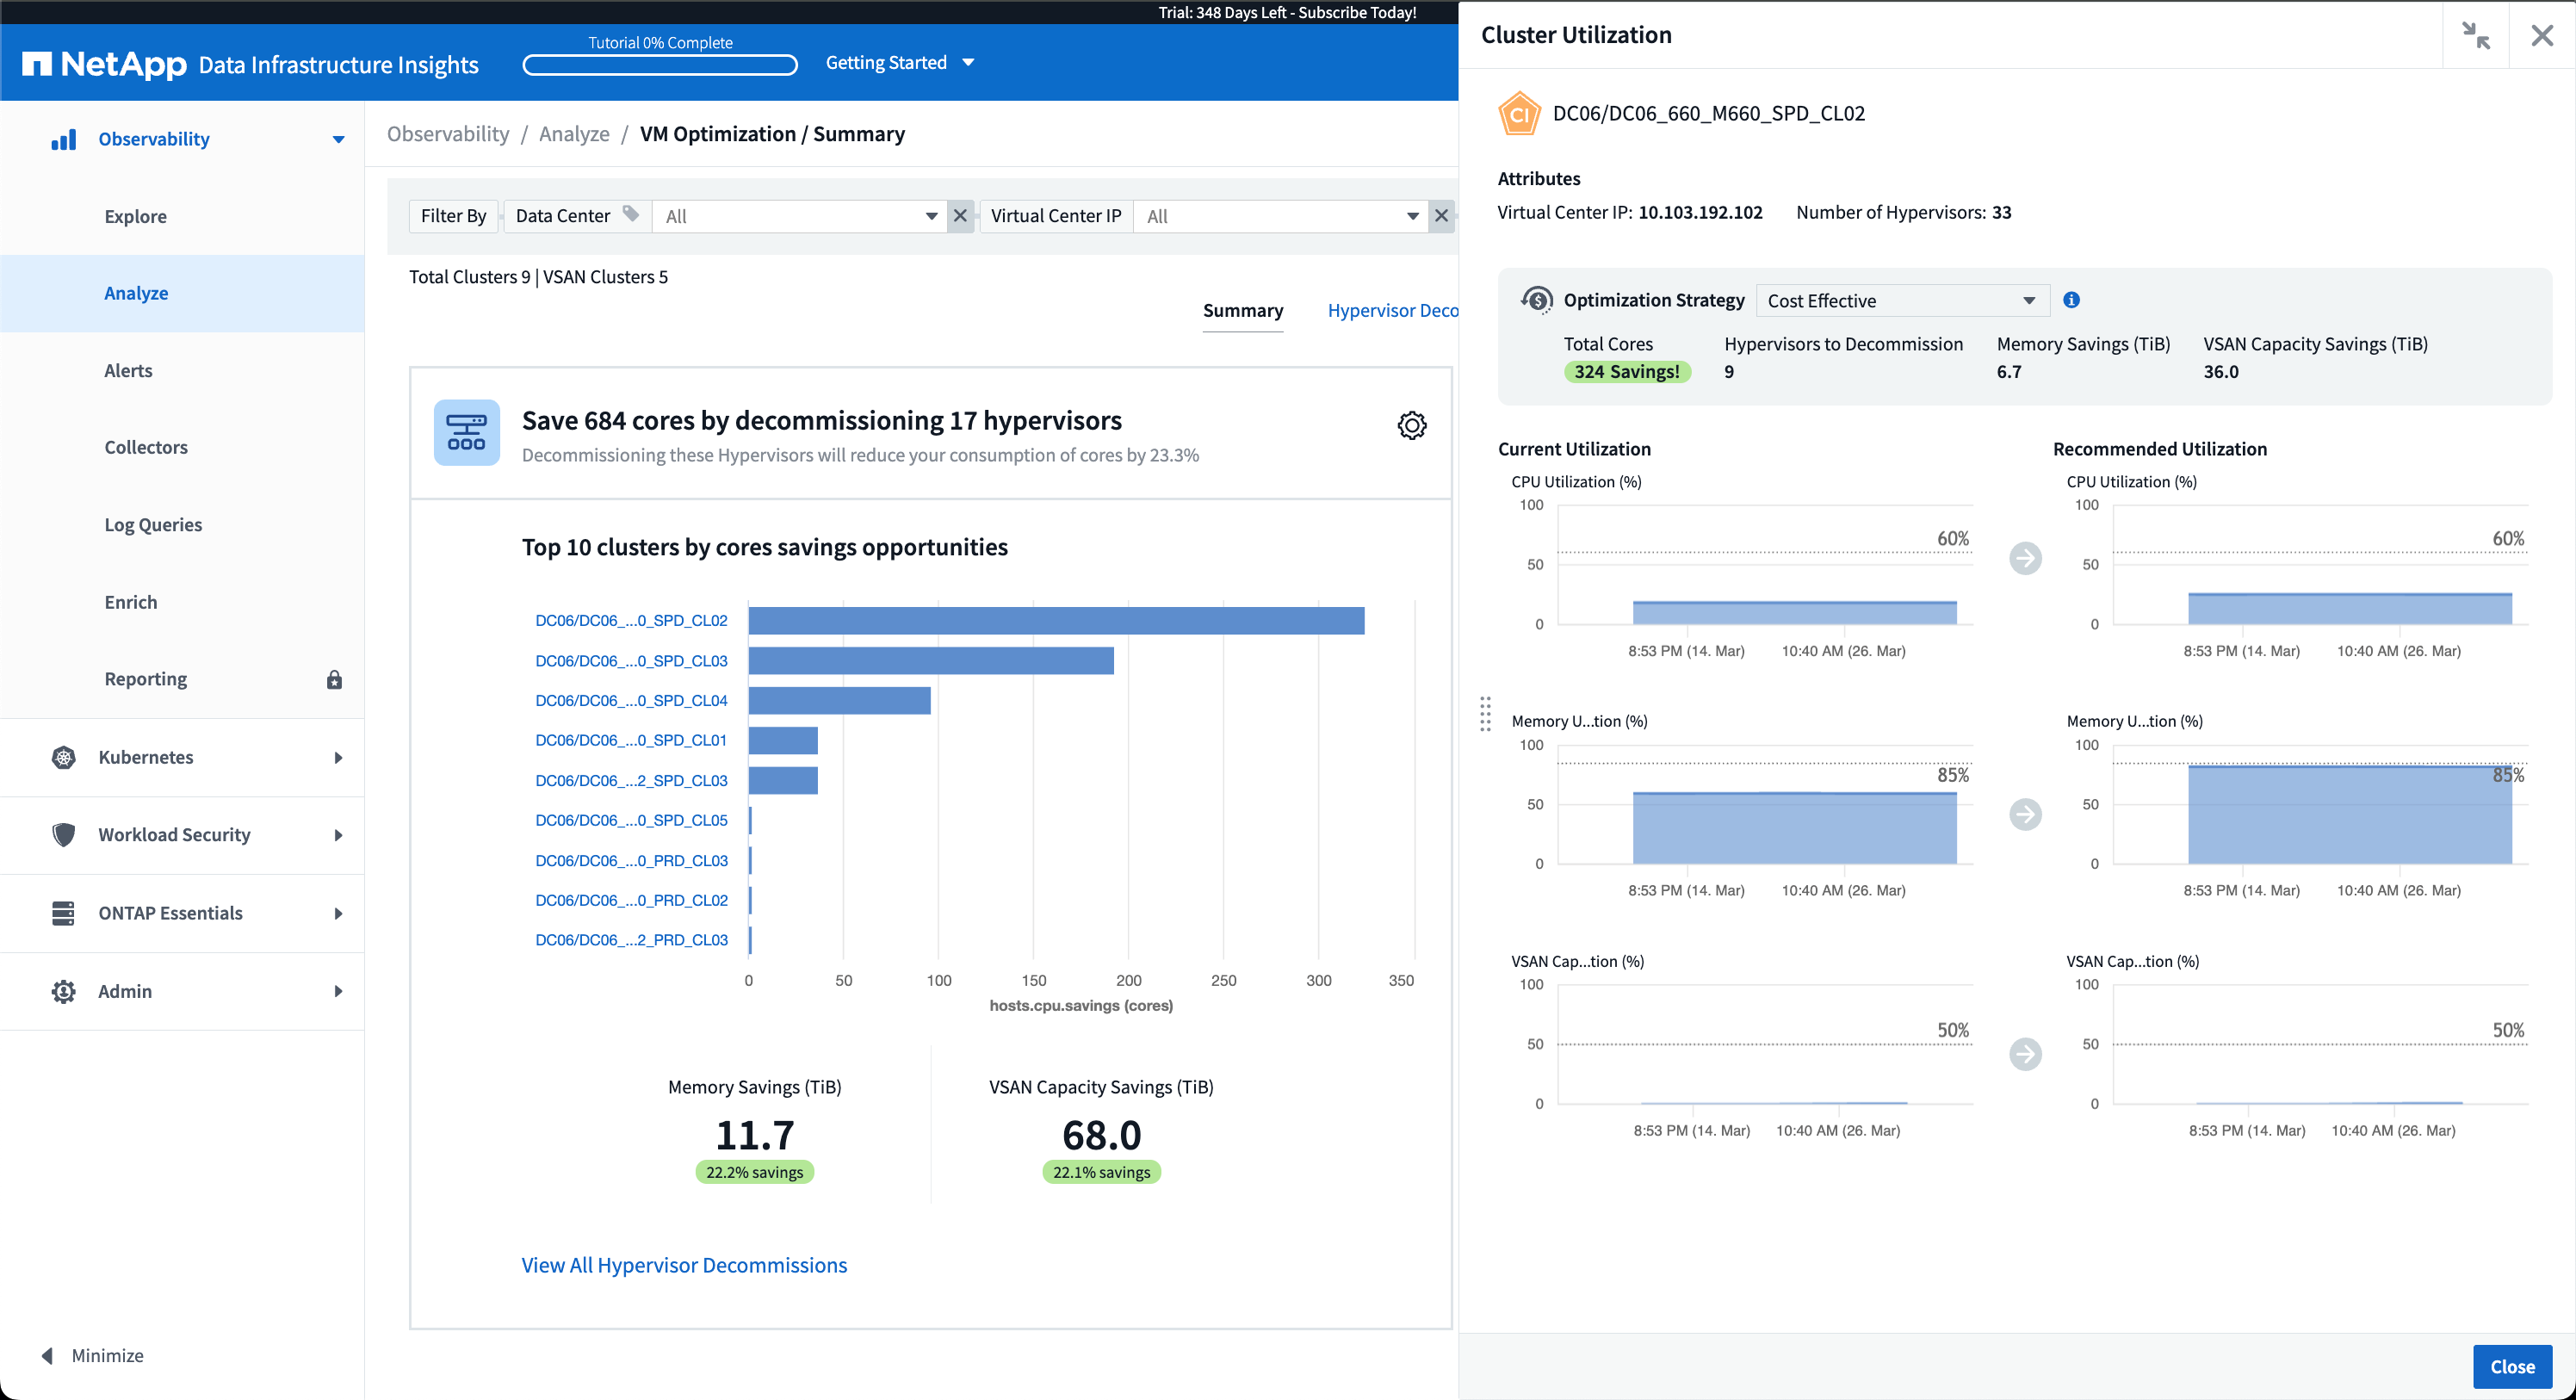
VSAN ストレージ サポートによる VMware コストの最適化
VM 最適化機能に、VSAN ストレージを備えた VMWare 環境のサポートが含まれるようになりました。 CPU とメモリの使用量に加えて、分析では再利用の推奨事項としてローカル VSAN ストレージが考慮されるようになったため、ライセンス コストをさらに削減できます。
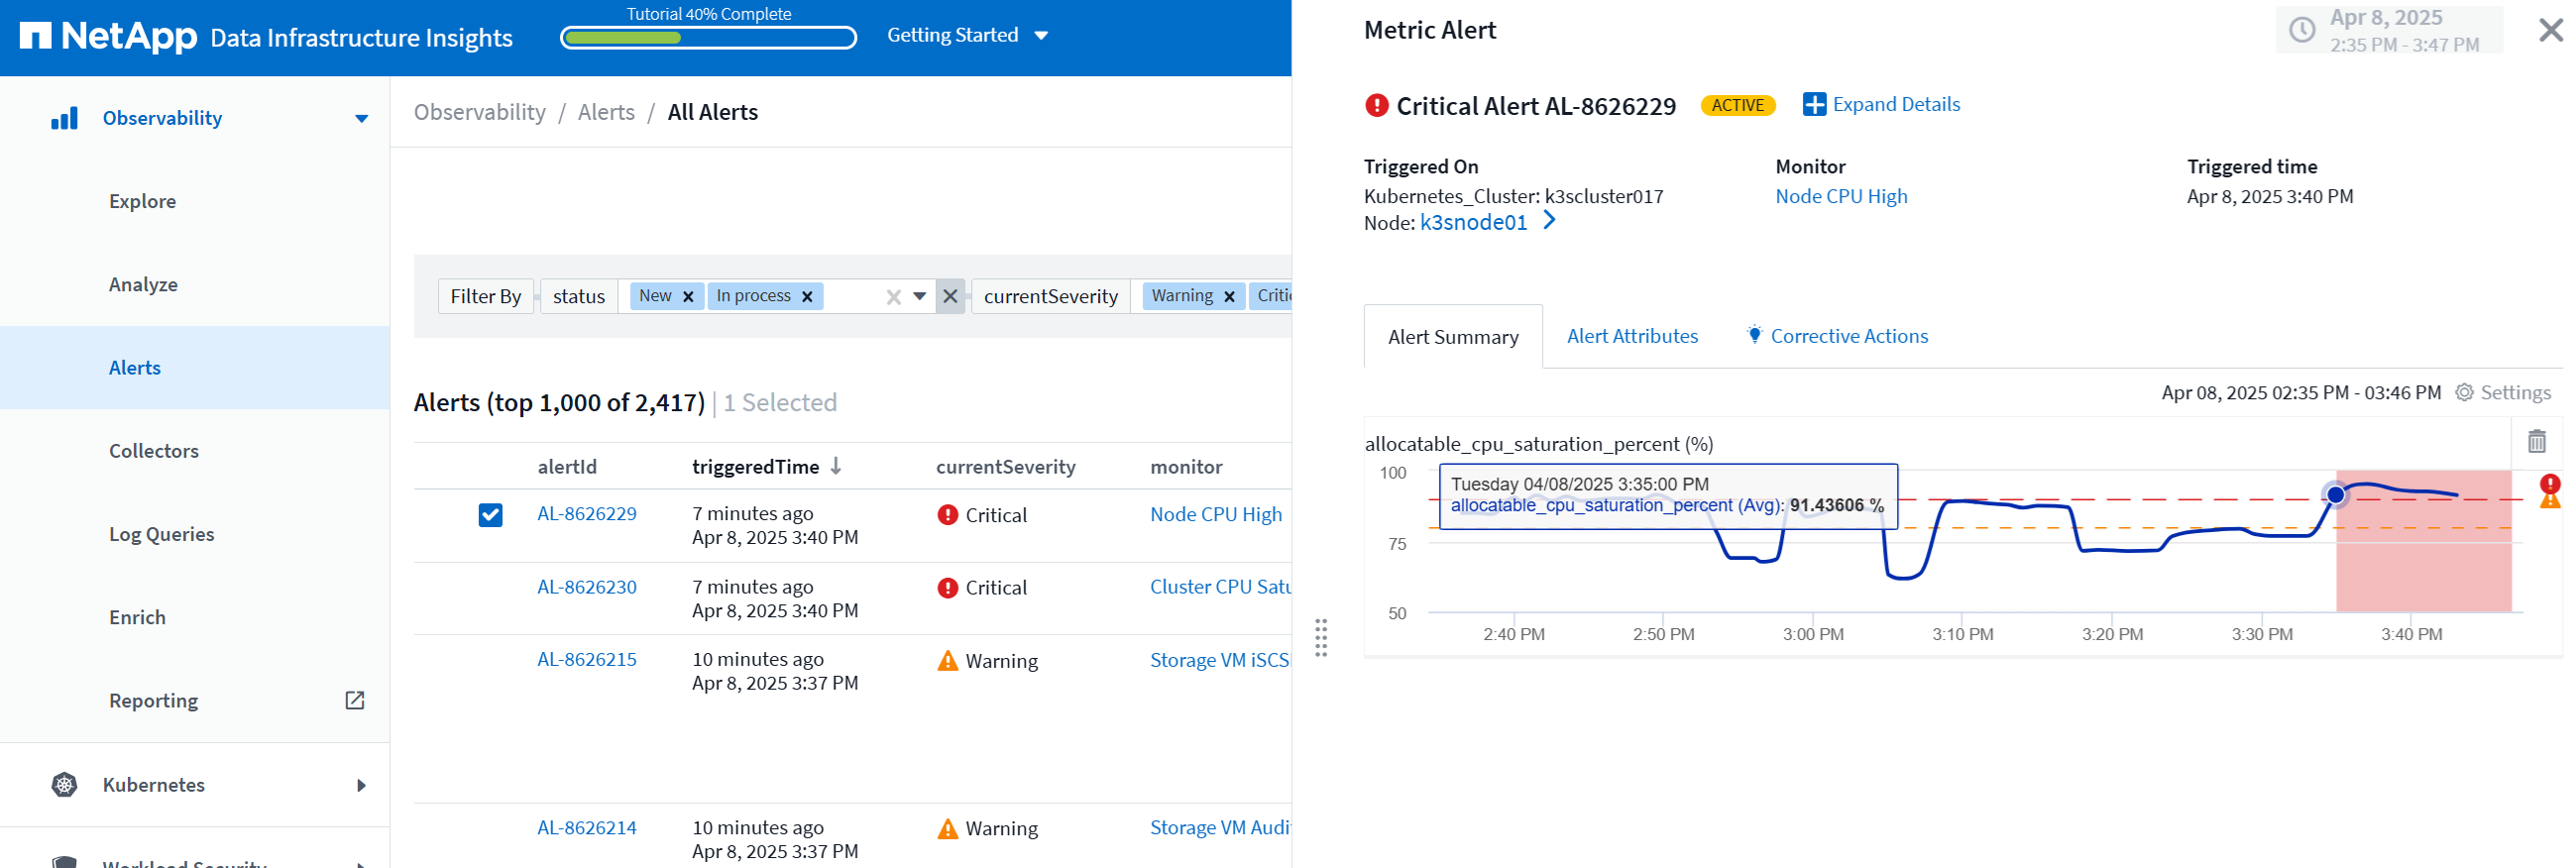
アラートの詳細をすぐに確認
新しいスライドアウト パネルにより、アラートの調査がこれまで以上に簡単になりました。アラートを選択すると、そのアラートの詳細が表示され、問題を調査しているときに場所を失うことなくアラートを簡単に切り替えることができます。
ワークロードセキュリティフォレンジック非同期エクスポート
フォレンジック データのエクスポートには、エクスポートするデータの量に応じて、数秒から数時間かかる場合があります。 Workload Security はデータを非同期的にエクスポートするため、.CSV のコンパイル中でも作業を続行できます。
ルールにグループ化されたデータコレクター通知
データ コレクターで通知を構成している場合、4 月 15 日以降、それらの通知は通知ルールで処理され、受信者が同一のコレクターに対しては単一のルールが適用されます。受取人が異なるコレクターには、別のルールが適用されます。既存のコレクター通知は通知ルールに移行されます。
2025年3月
効率的なインフラストラクチャ管理のための強化されたコンテキストナビゲーション
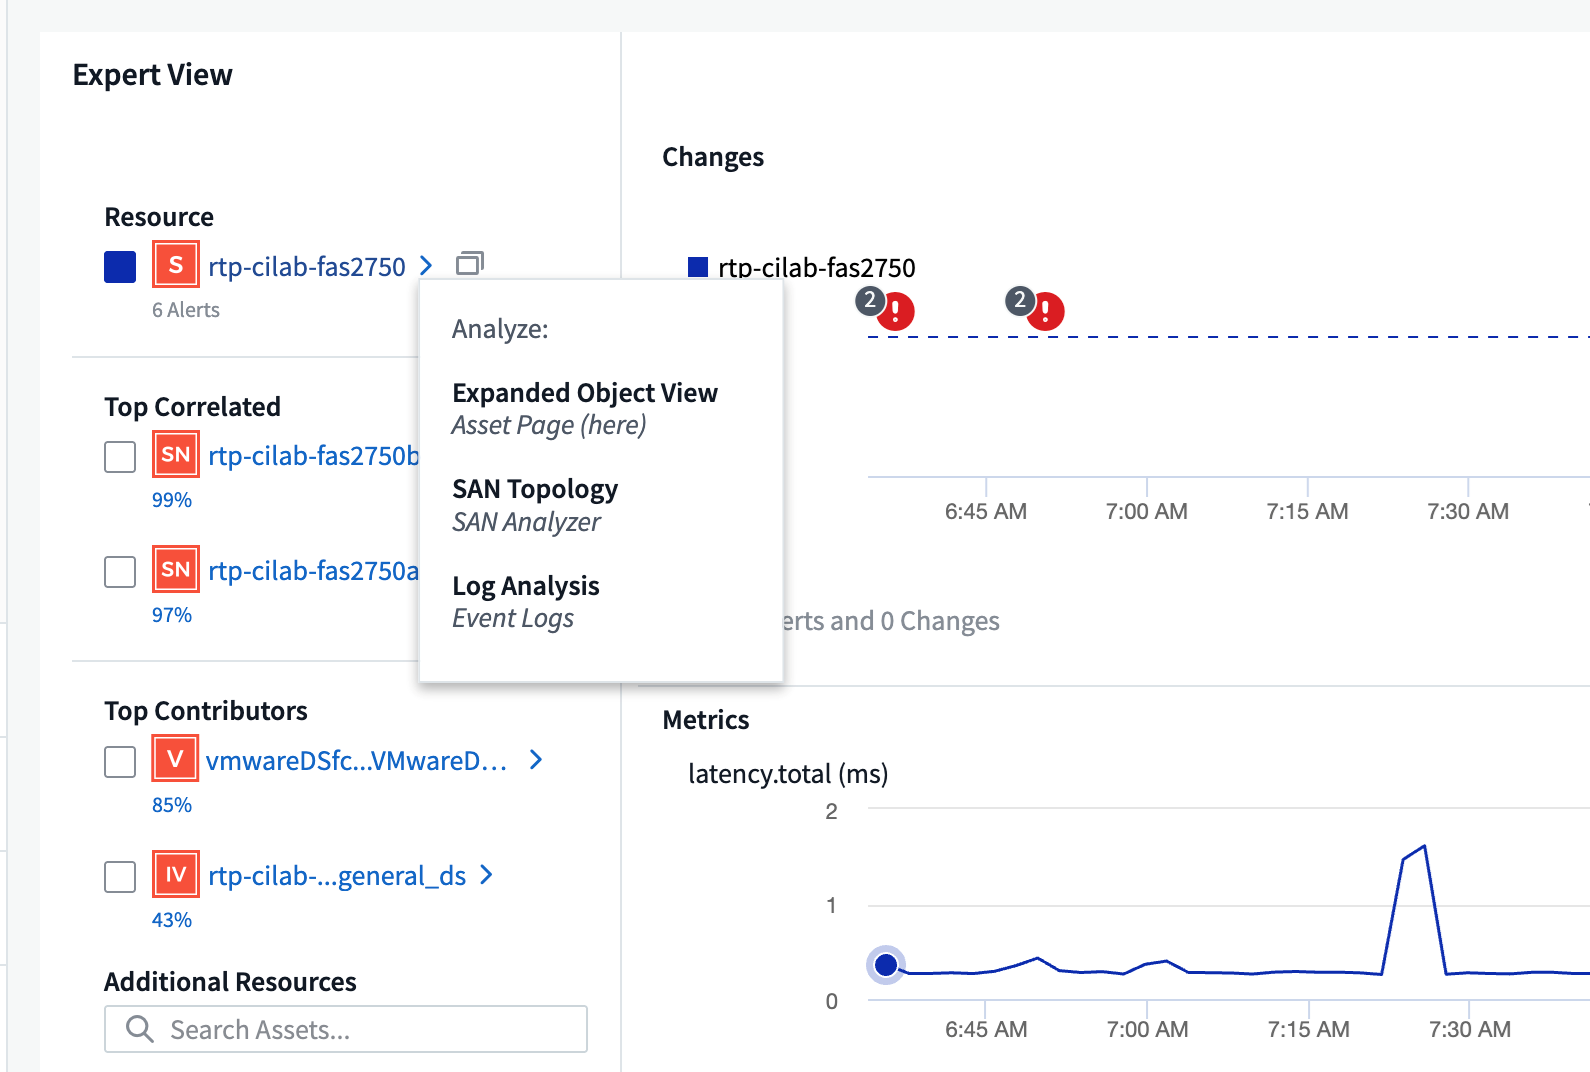
Data Infrastructure Insightsを活用して運用効率を高め、時間を節約します。現在、コンテキスト メニュー リンクが追加されており、任意のオブジェクトから、デバイス パフォーマンス分析情報の資産ランディング ページ、ネットワーク トポロジの視覚化のための SAN Analyzer、運用認識のログ、構成管理のための Change Analyzer に直接ジャンプできるようになりました。
複数のビューにわたる重要なデータに即座にアクセスできるため、オブジェクトの関係をより迅速かつ明確に把握できます。この合理化されたワークフローにより、意思決定と問題解決が加速され、最終的には時間が節約され、全体的な分析機能が向上します。
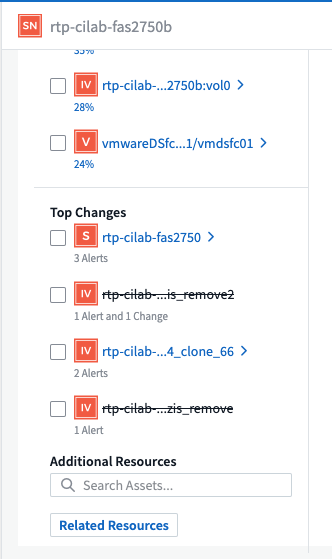
削除された資産の履歴を保存する
強化されたインフラ変更機能により、移動されて利用できなくなった qtree やボリュームなどの削除された資産の履歴が保存されるようになりました。
トラブルシューティングのパズルで何かが欠けていますか? もうない!取り消し線が引かれた削除済みオブジェクトも含め、すべてが表示されるため、アセットが削除された後でも完全なコンテキストが得られ、エンドツーエンドのパス全体で過去の変更やアラートの重要な要素を見逃すことがなくなります。
結果?問題の資産が存在しなくなった場合でも、解決時間が短縮され、インフラストラクチャの決定をより自信を持って行うことができます。
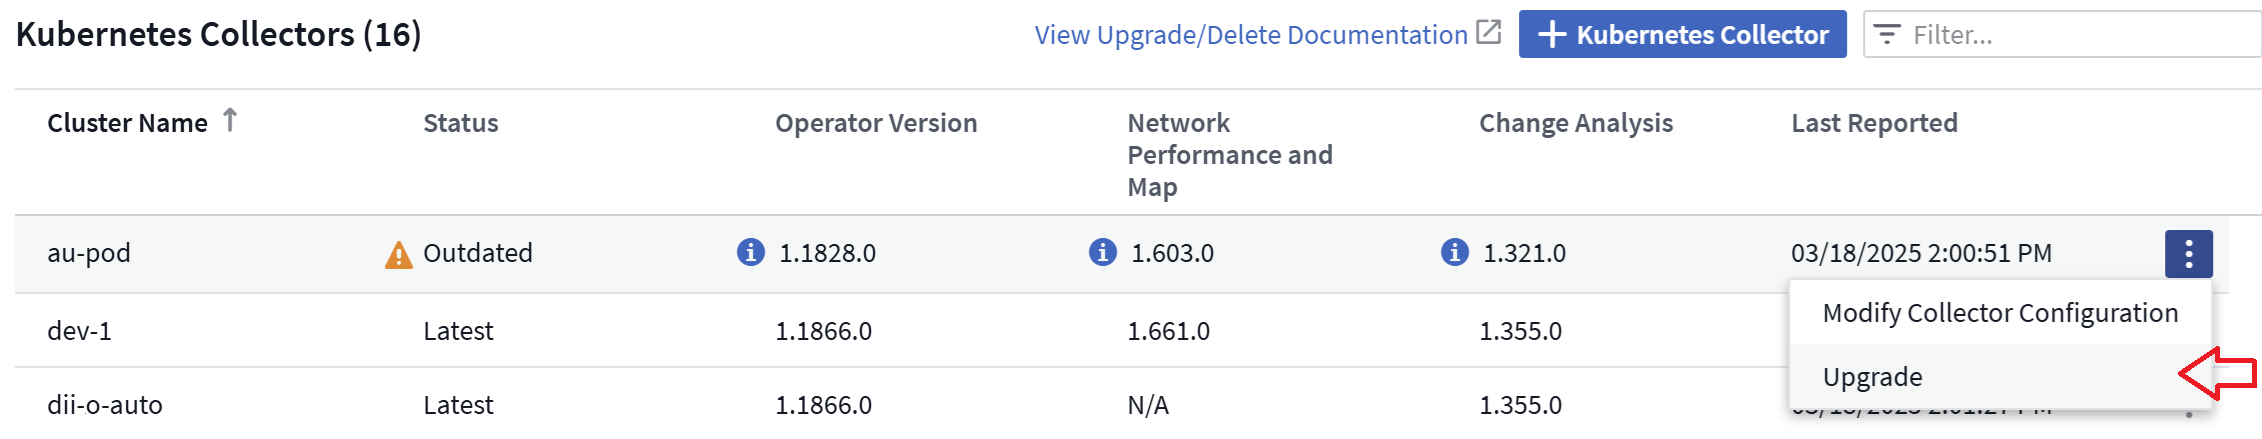
Kubernetes オペレーターのプッシュボタンアップグレード
Kubernetes Operator が最新であることを確認したいですか? DII Kubernetes Collectors クラスター メニューからオンデマンドでオペレーターをアップグレードします。メニューから「アップグレード」を選択するだけで、オペレーターがイメージ署名を検証し、現在のインストールのスナップショットをキャプチャして、アップグレードを実行します。
プッシュボタン アップグレードはオプションの機能であり、そのアクティベーションはクラスターごとに管理できます。
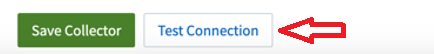
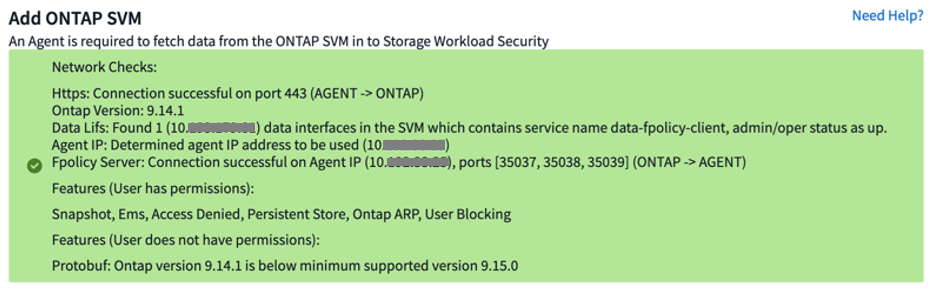
ストレージ ワークロード セキュリティ データ コレクターの接続テスト
テスト接続機能は、Data Infrastructure Insights (DII) ワークロード セキュリティでデータ コレクターを設定するときに、エンド ユーザーが障害の具体的な原因を特定できるようにすることを目的としています。これにより、ユーザーはネットワーク通信や役割の不足に関連する問題を自己修正できるようになります。
オペレーティングシステムのサポート
Data Infrastructure Insights Acquisition Unitsでは、以下のオペレーティングシステムがサポートされるようになりました。"すでにサポートされています" :
-
アルマリナックス 9.5
-
Debian (64ビット) 11
-
OpenSUSE リープ 15.6
-
Oracle Enterprise Linux (64 ビット) 8.9、8.10、9.5
-
Red Hat (64 ビット) 8.9、8.10、9.5
-
ロッキー 9.5
-
SUSE Linux Enterprise Server 15 SP6
-
Ubuntu サーバー 24.04 LTS
2025年2月
ONTAP Essentialsには、最新世代の"ASA"デバイス。これには、 ONTAP上で実行されているワークロードの VM-LUN トポロジ用の SAN Analyzer が含まれており、現在はData Infrastructure Insights Basic Edition の一部としてNetAppサポートでも利用できます。
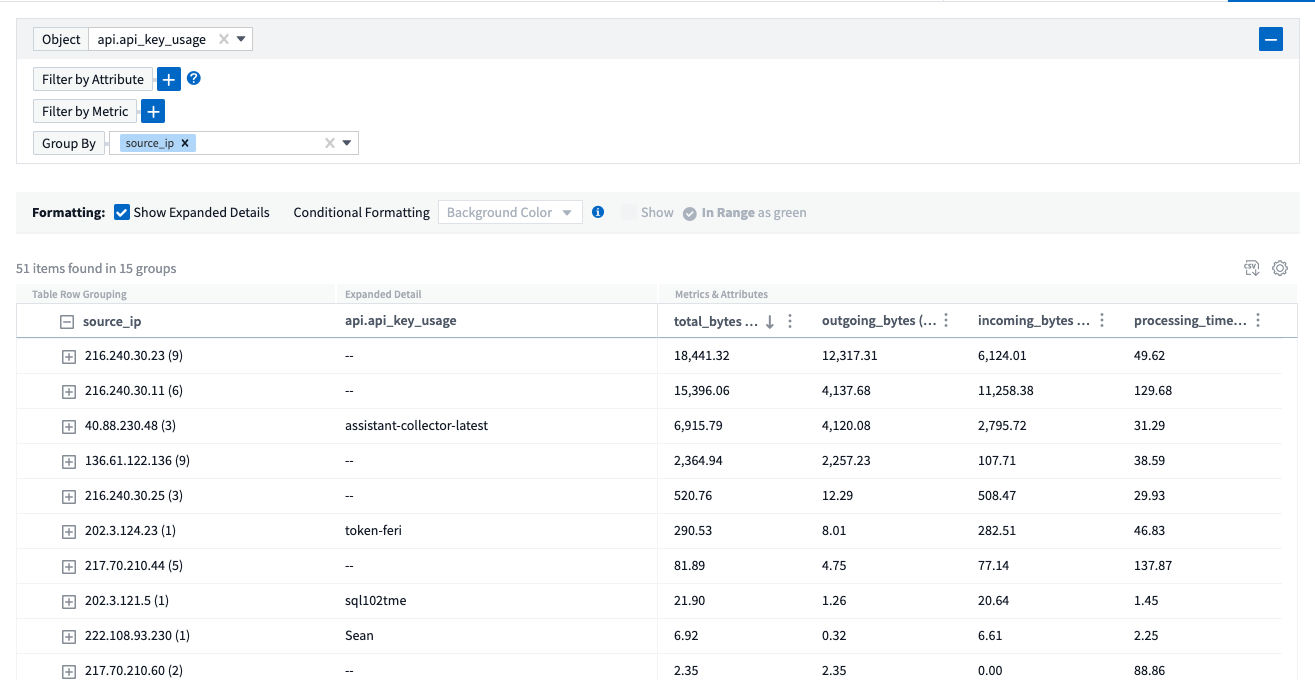
DII API使用状況追跡:セキュリティと効率性の向上
管理者ユーザーが利用できる強化された REST API 使用状況追跡により、セキュリティ体制を強化し、リソース管理を合理化します。 API 使用状況の追跡を使用すると、どの API トークンが使用されているか、どの IP アドレスから使用されているか、およびそれらが生成するトラフィックの量を確認できます。トークンを特定の IP アドレスと使用レベルにリンクすることで、システム アクセスと使用傾向に関する強力な分析情報が得られ、安全で効率的な環境を維持し、運用を円滑に進めるために必要な制御が可能になります。
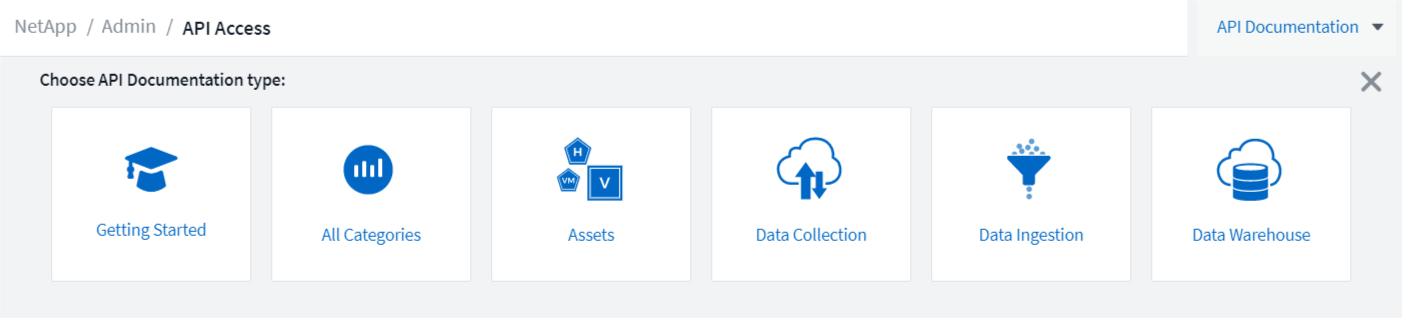
API 使用状況を表示するには、Observability > Admin > API Access に移動し、View API Usage を選択します。この API は DII Observability API でのみ使用可能であり、Workload Security には適用されないことに注意してください。
ユーザーを制限するワークロードセキュリティAPI
Workload Security でユーザー制限を管理するための新しい API が追加されました。 API を使用すると、ユーザーをブロックまたはブロック解除したり、アクセス制限の期間を変更したりできます。 cloudsecure_actions.block API については、「管理 > API アクセス > API ドキュメント」ページを参照してください。
2025年1月
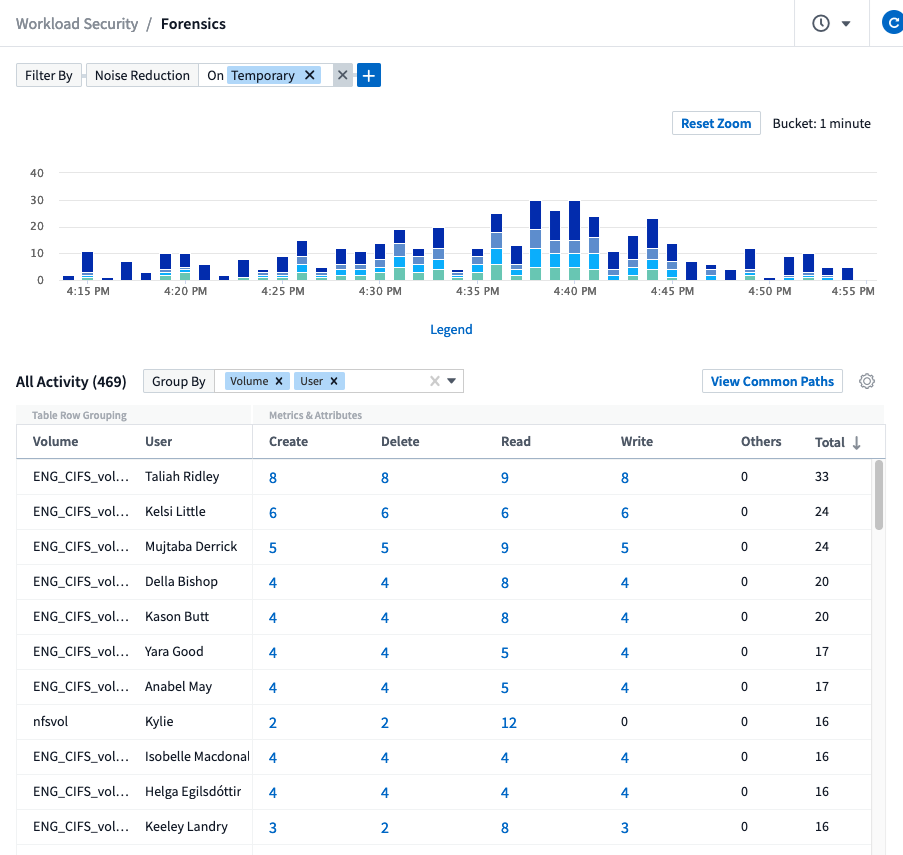
フォレンジックグループでリスクを積極的に管理
セキュリティとリソース管理機能を強化するために設計された最新機能をご紹介します。高度なグループ化機能と階層的な複数のグループ化のサポートにより、特定のフォルダーにアクセスしたユーザーを簡単に識別し、最もアクティブなユーザーと共有を判断し、アクティブなクライアント IP アドレスを追跡してリスクをプロアクティブに管理できるようになりました。最もアクセスの多いファイルとフォルダーを特定することでストレージと帯域幅の使用を最適化し、ユーザーを識別することでシステム アクセスの制御を強化します。
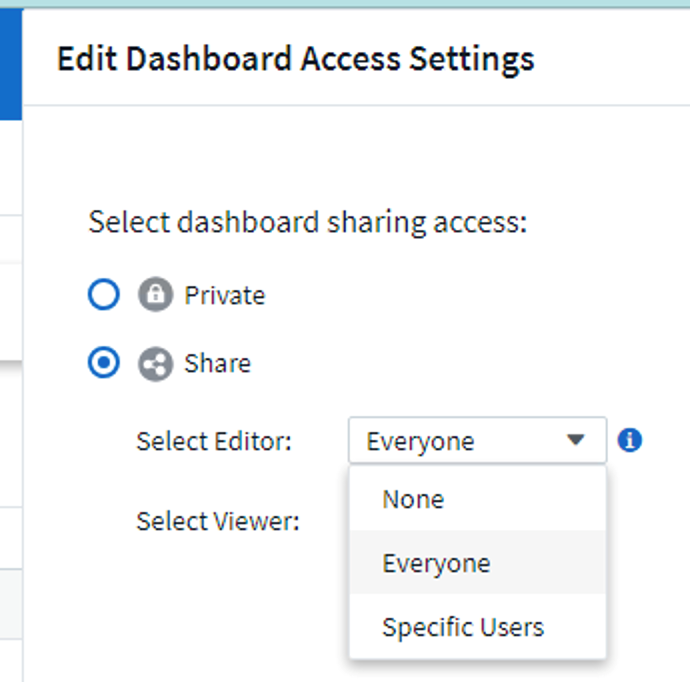
ダッシュボードのアクセス制御
Data Infrastructure Insightsでは、作成したダッシュボードへのアクセスをより細かく制御できるようになりました。グラフを変更できるユーザーを選択します。潜在的に機密性の高い情報への公開を制御できます。一般公開の準備ができていないダッシュボードをまだ作成中ですか? 共有する準備ができるまで非公開にしておくこともできます。
2024年12月
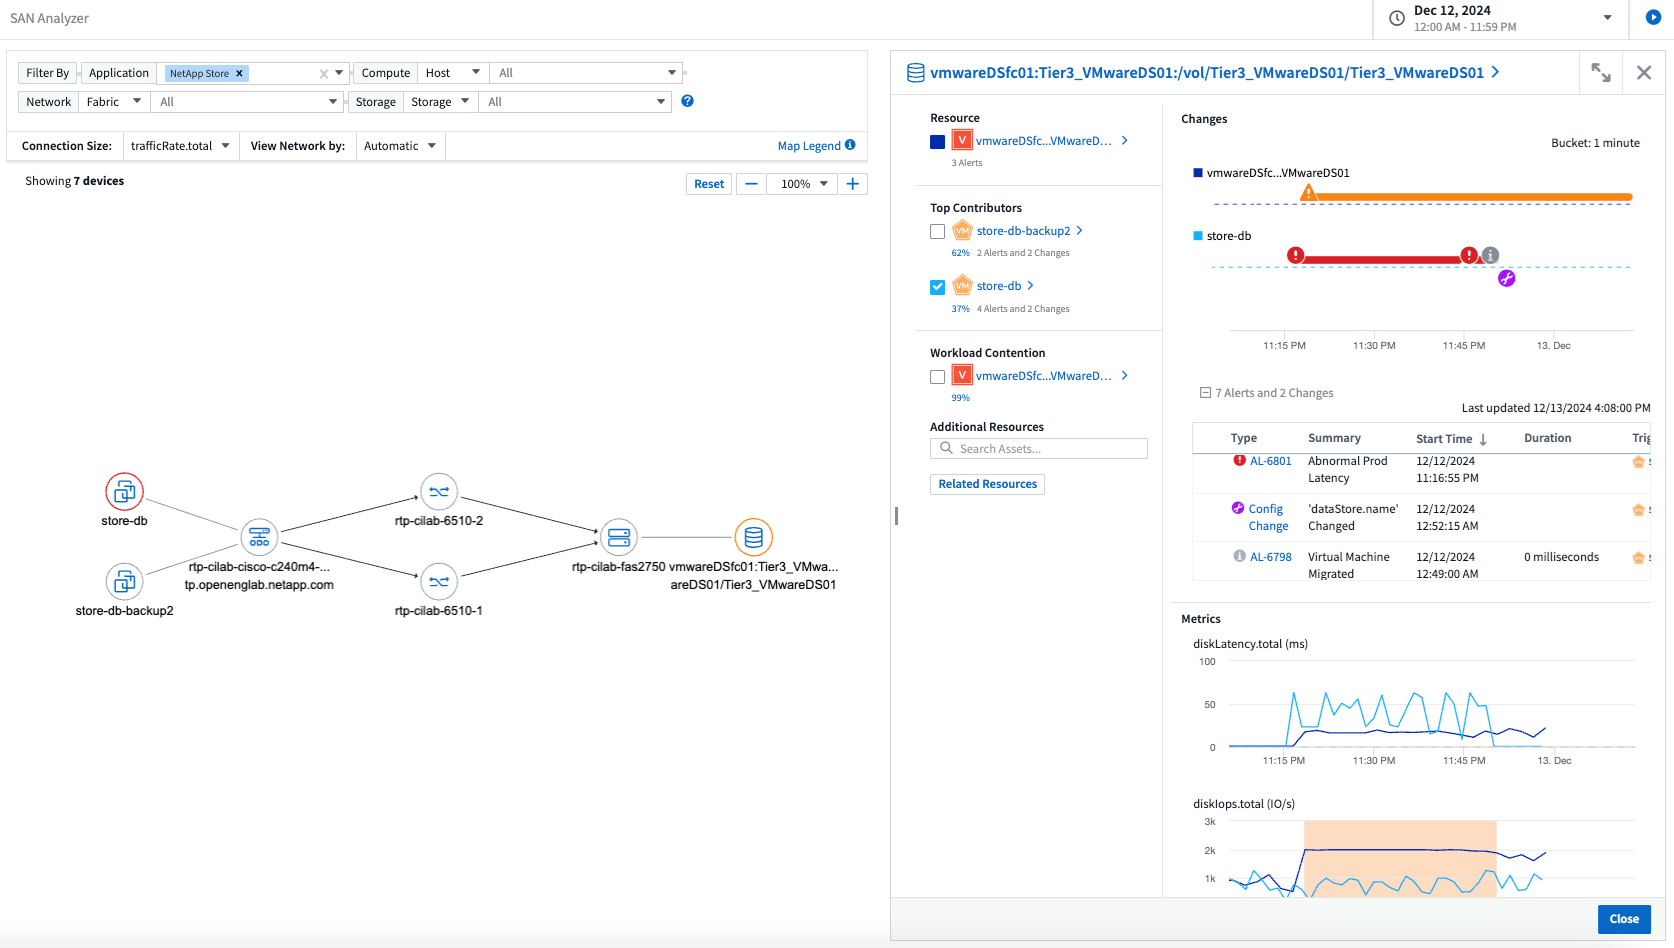
SAN Analyzer のご紹介: ブロック ワークロードの可視性強化
SAN は重要なワークロードの処理において重要な役割を果たしますが、その複雑さにより重大な停止や顧客の混乱が生じる可能性があります。 DII の SAN Analyzer を使用すると、SAN の管理がよりシンプルかつ効率的になります。この強力なツールは、エンドツーエンドの可視性を提供し、VM/ホストからネットワーク、LUN、ストレージへの依存関係をマッピングします。 SAN Analyzer は、インタラクティブなトポロジ マップを提供することで、問題を正確に特定し、変更を理解し、データ フローの理解を深めることを可能にします。 SAN Analyzer を使用して複雑な IT 環境での SAN 管理を合理化し、ブロック ワークロードの可視性を向上させます。
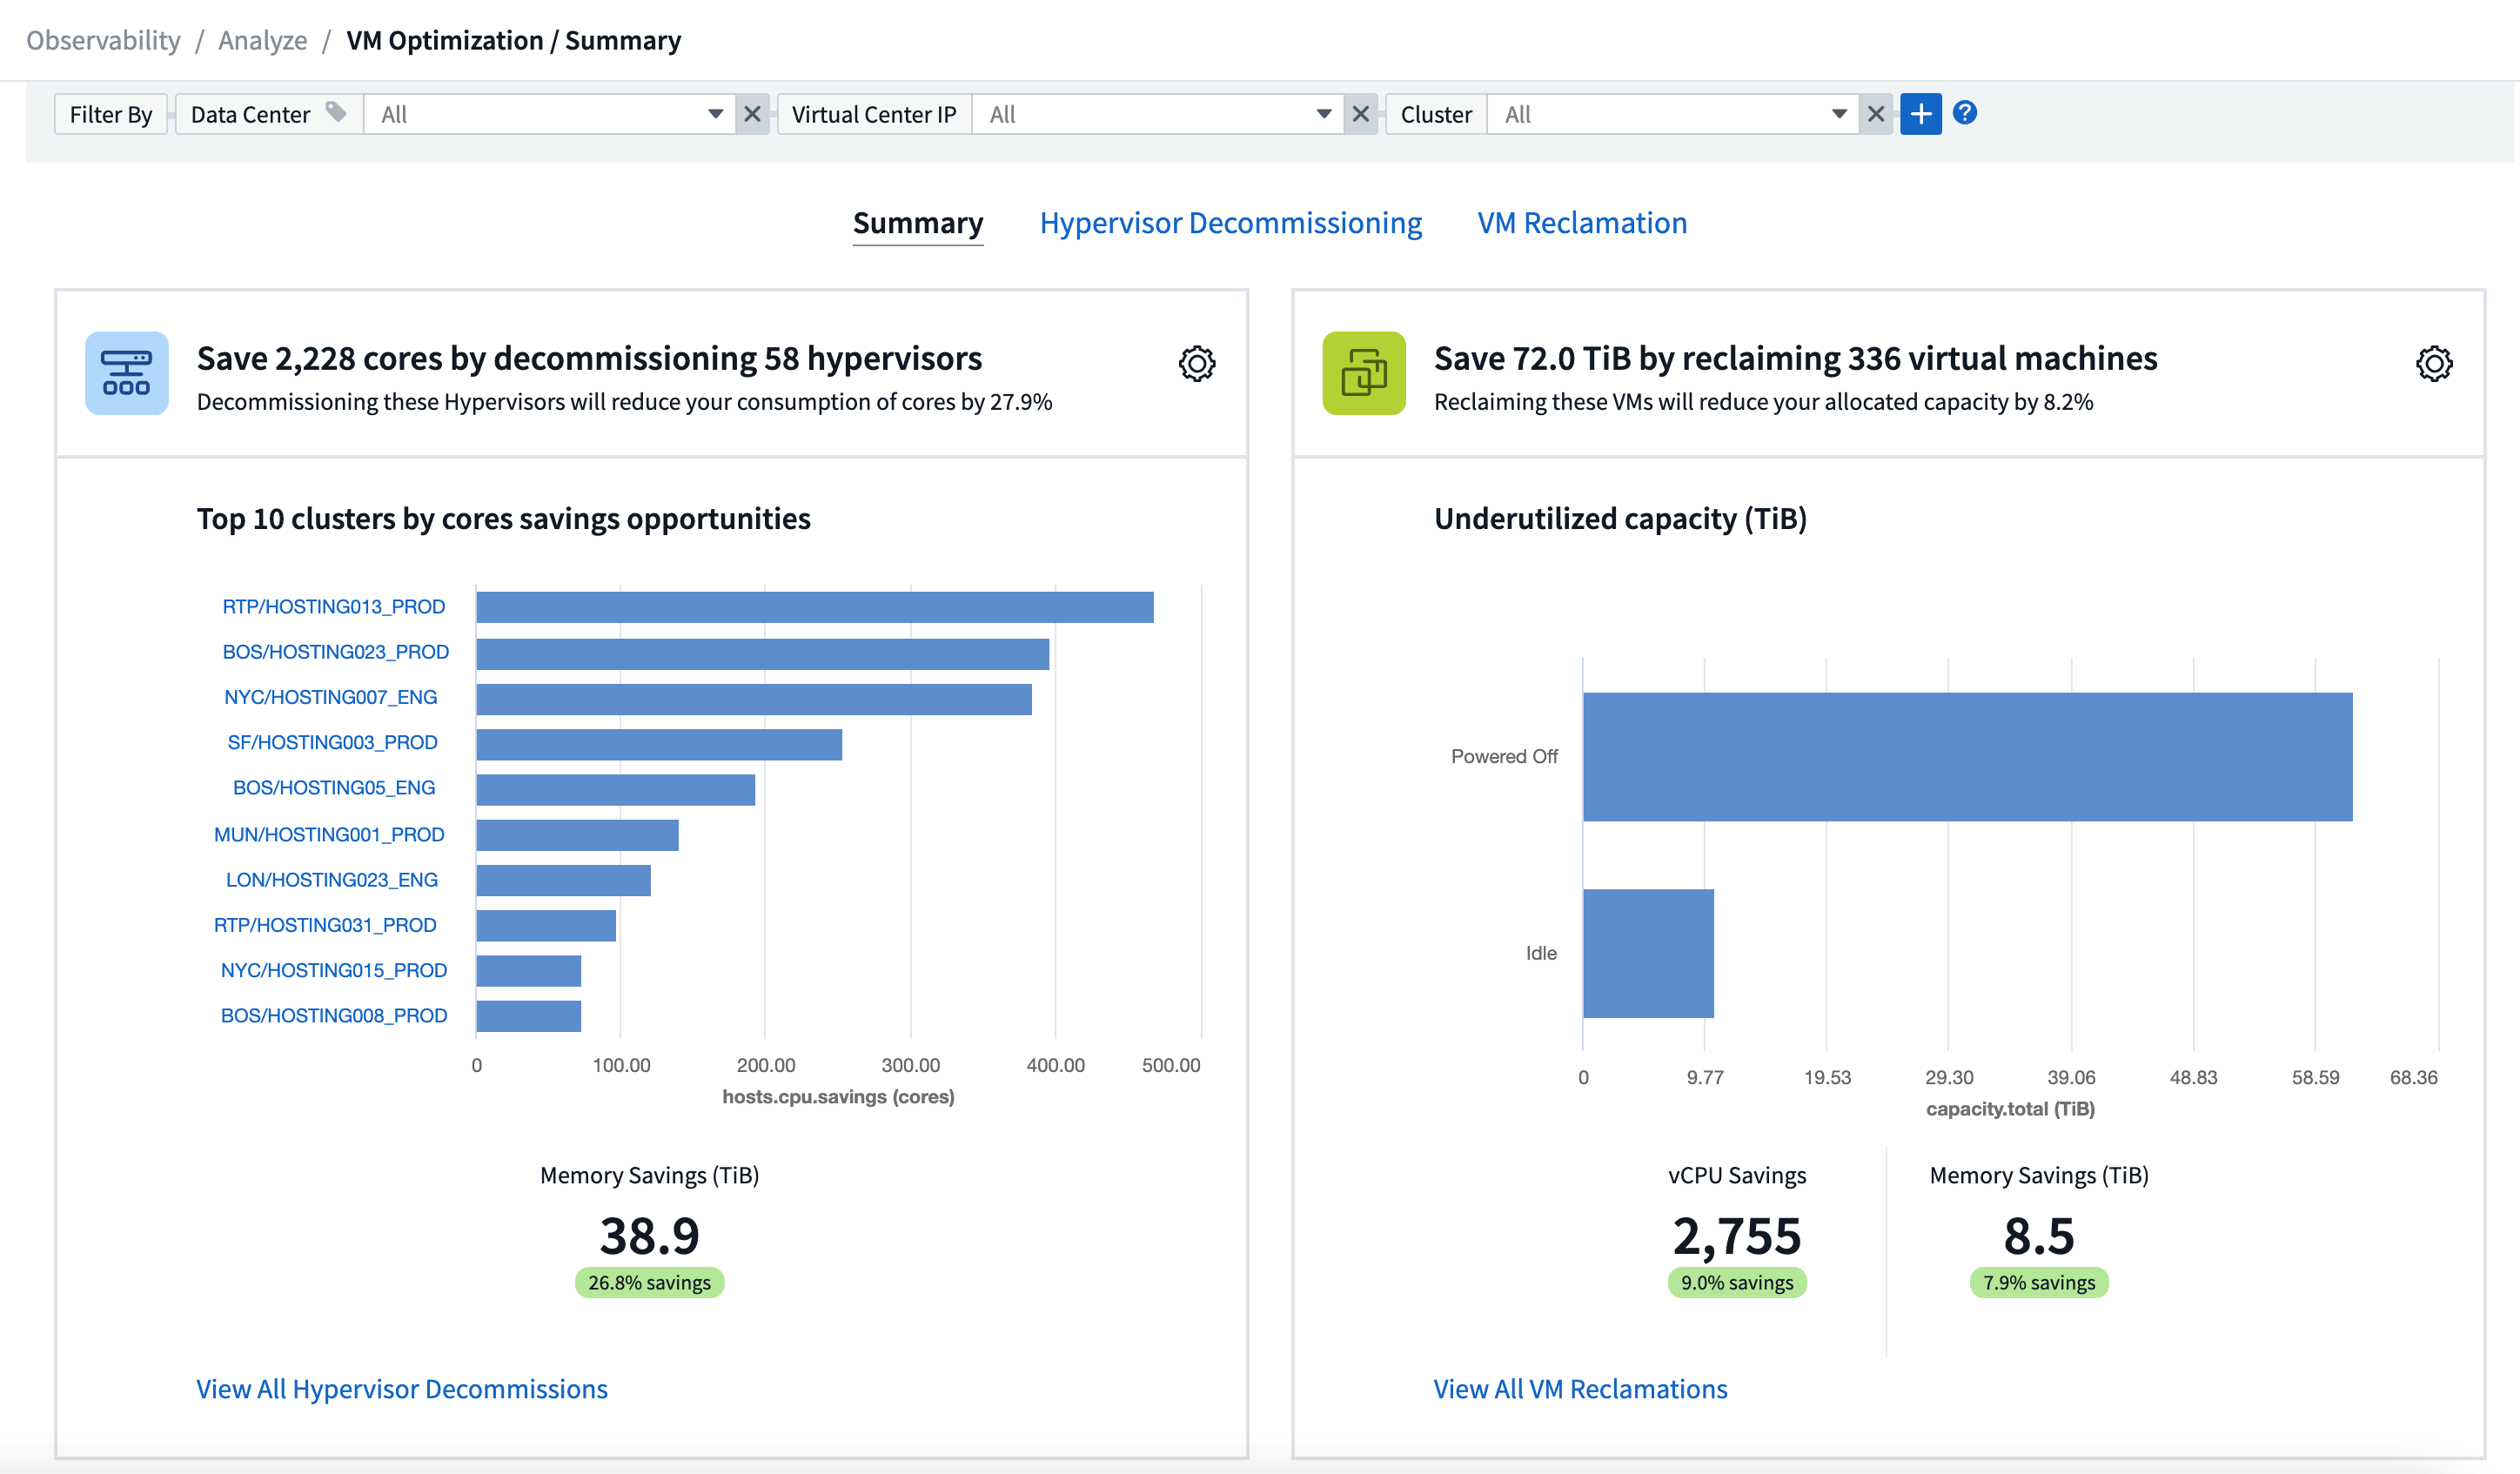
インテリジェントなホスト廃止と VM 再利用による VM コストの最適化
Data Infrastructure Insights は、環境の過去の動作を分析し、短期および長期の予測を確立し、ホストの廃止と、電源がオフになっているアイドル状態の VM の再利用に関する詳細な推奨事項を生成することで、インフラストラクチャとライセンスのコスト管理に役立ちます。これらの推奨事項は、パフォーマンスの安定性を確保し、未使用の容量を解放し、メモリと CPU の割り当てを削減するのに役立ちます。
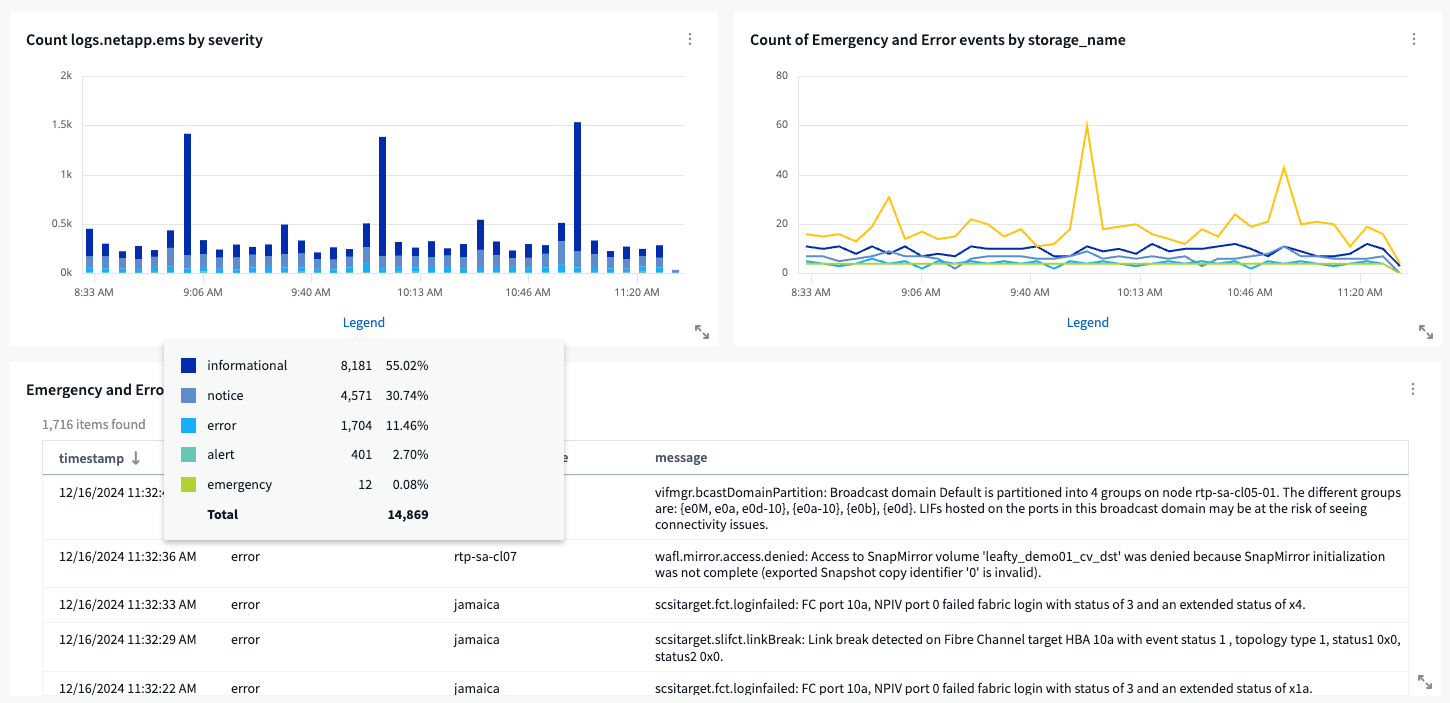
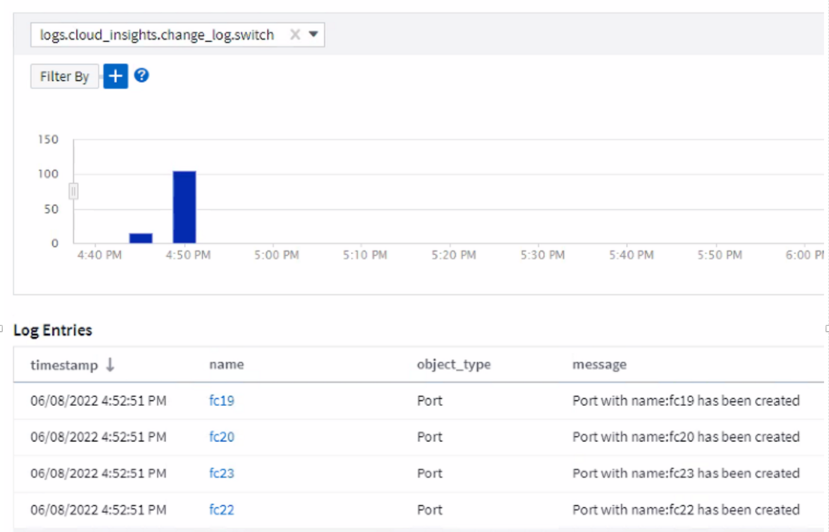
時間チャートとテーブルウィジェットのサポートによりログの洞察を明らかに
時間グラフ (棒グラフ、折れ線グラフ、面グラフ) を活用して、繰り返し発生するエラーやアクティビティの急増などのログ データの傾向やパターンを特定し、時間の経過に伴うシステムの動作に関する貴重な分析情報を得ることができます。さらに、テーブルを使用すると、ダッシュボードにログ メッセージを直接含めることができるため、ログの詳細をより包括的に表示できます。
2024年11月

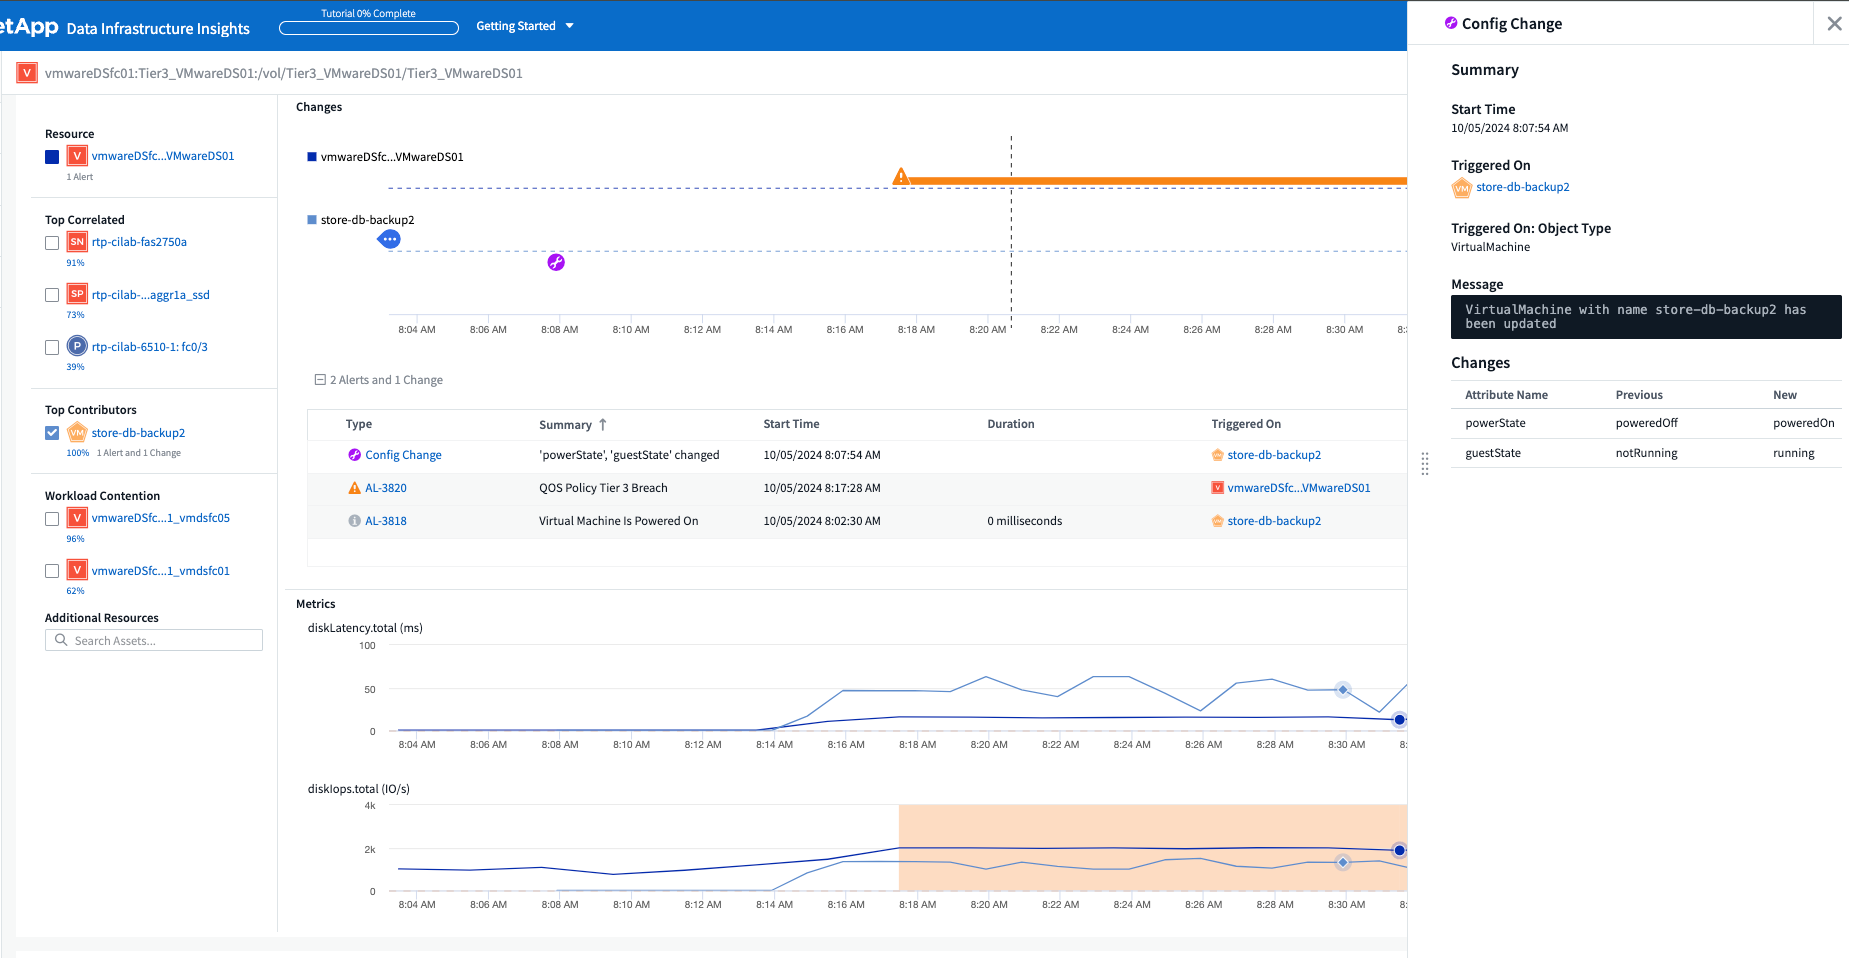
環境内の構成変更を分析する
構成の変更は、現代の IT における問題の最も一般的な原因の 1 つです。Data Infrastructure Insights(DII)の新しい"変更分析"機能により、環境で問題を引き起こす変更を明確に把握できます。問題の原因となった可能性のあるデバイスおよび関連インフラストラクチャ コンポーネントのすべての変更を表示することで、トラブルシューティングの時間を短縮します。さらに、あなたやあなたのチームが計画された変更を実行する場合、サービス レベルに影響が出る前にそれらの変更を迅速に検証し、予期しない影響がないことを確認できます。
KubeVirt サポート: Kubernetes クラスター内で実行されている仮想マシンのワークロードを監視します
DII は現在、OpenShift Virtualization や Harvester などのプラットフォームで使用される Kubernetes ネイティブ仮想化ソリューションである KubeVirt を完全にサポートしています。 Kubernetes クラスター内の仮想マシンとコンテナ ワークロードの両方のメトリック、イベント、構成の変更、ネットワーク トラフィックを完全に可視化します。
2024年10月
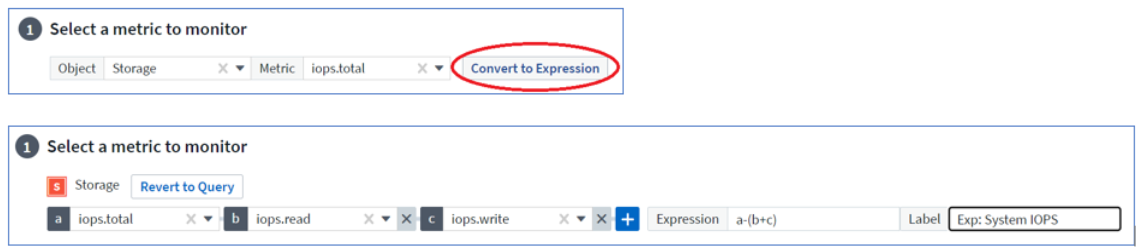
モニターのカスタム式で新たな洞察を獲得
式を使用すると、メトリックおよび異常検出モニターで算術演算を実行できます。以下に例をいくつか挙げます。
-
比率: クラウド ストレージ プロバイダーでサービス レベルの制限に達している場所を検出するための IOPS/TB。
-
パーセンテージ: 使用率を計算するために使用済み/使用可能
-
集約: 複数の種類の物理ポートエラーを 1 つのモニターにまとめる
-
比較: 現在のリソース ヘッドルーム使用率を最適なヘッドルーム ポイントと比較して、フル稼働していないリソースを特定します。
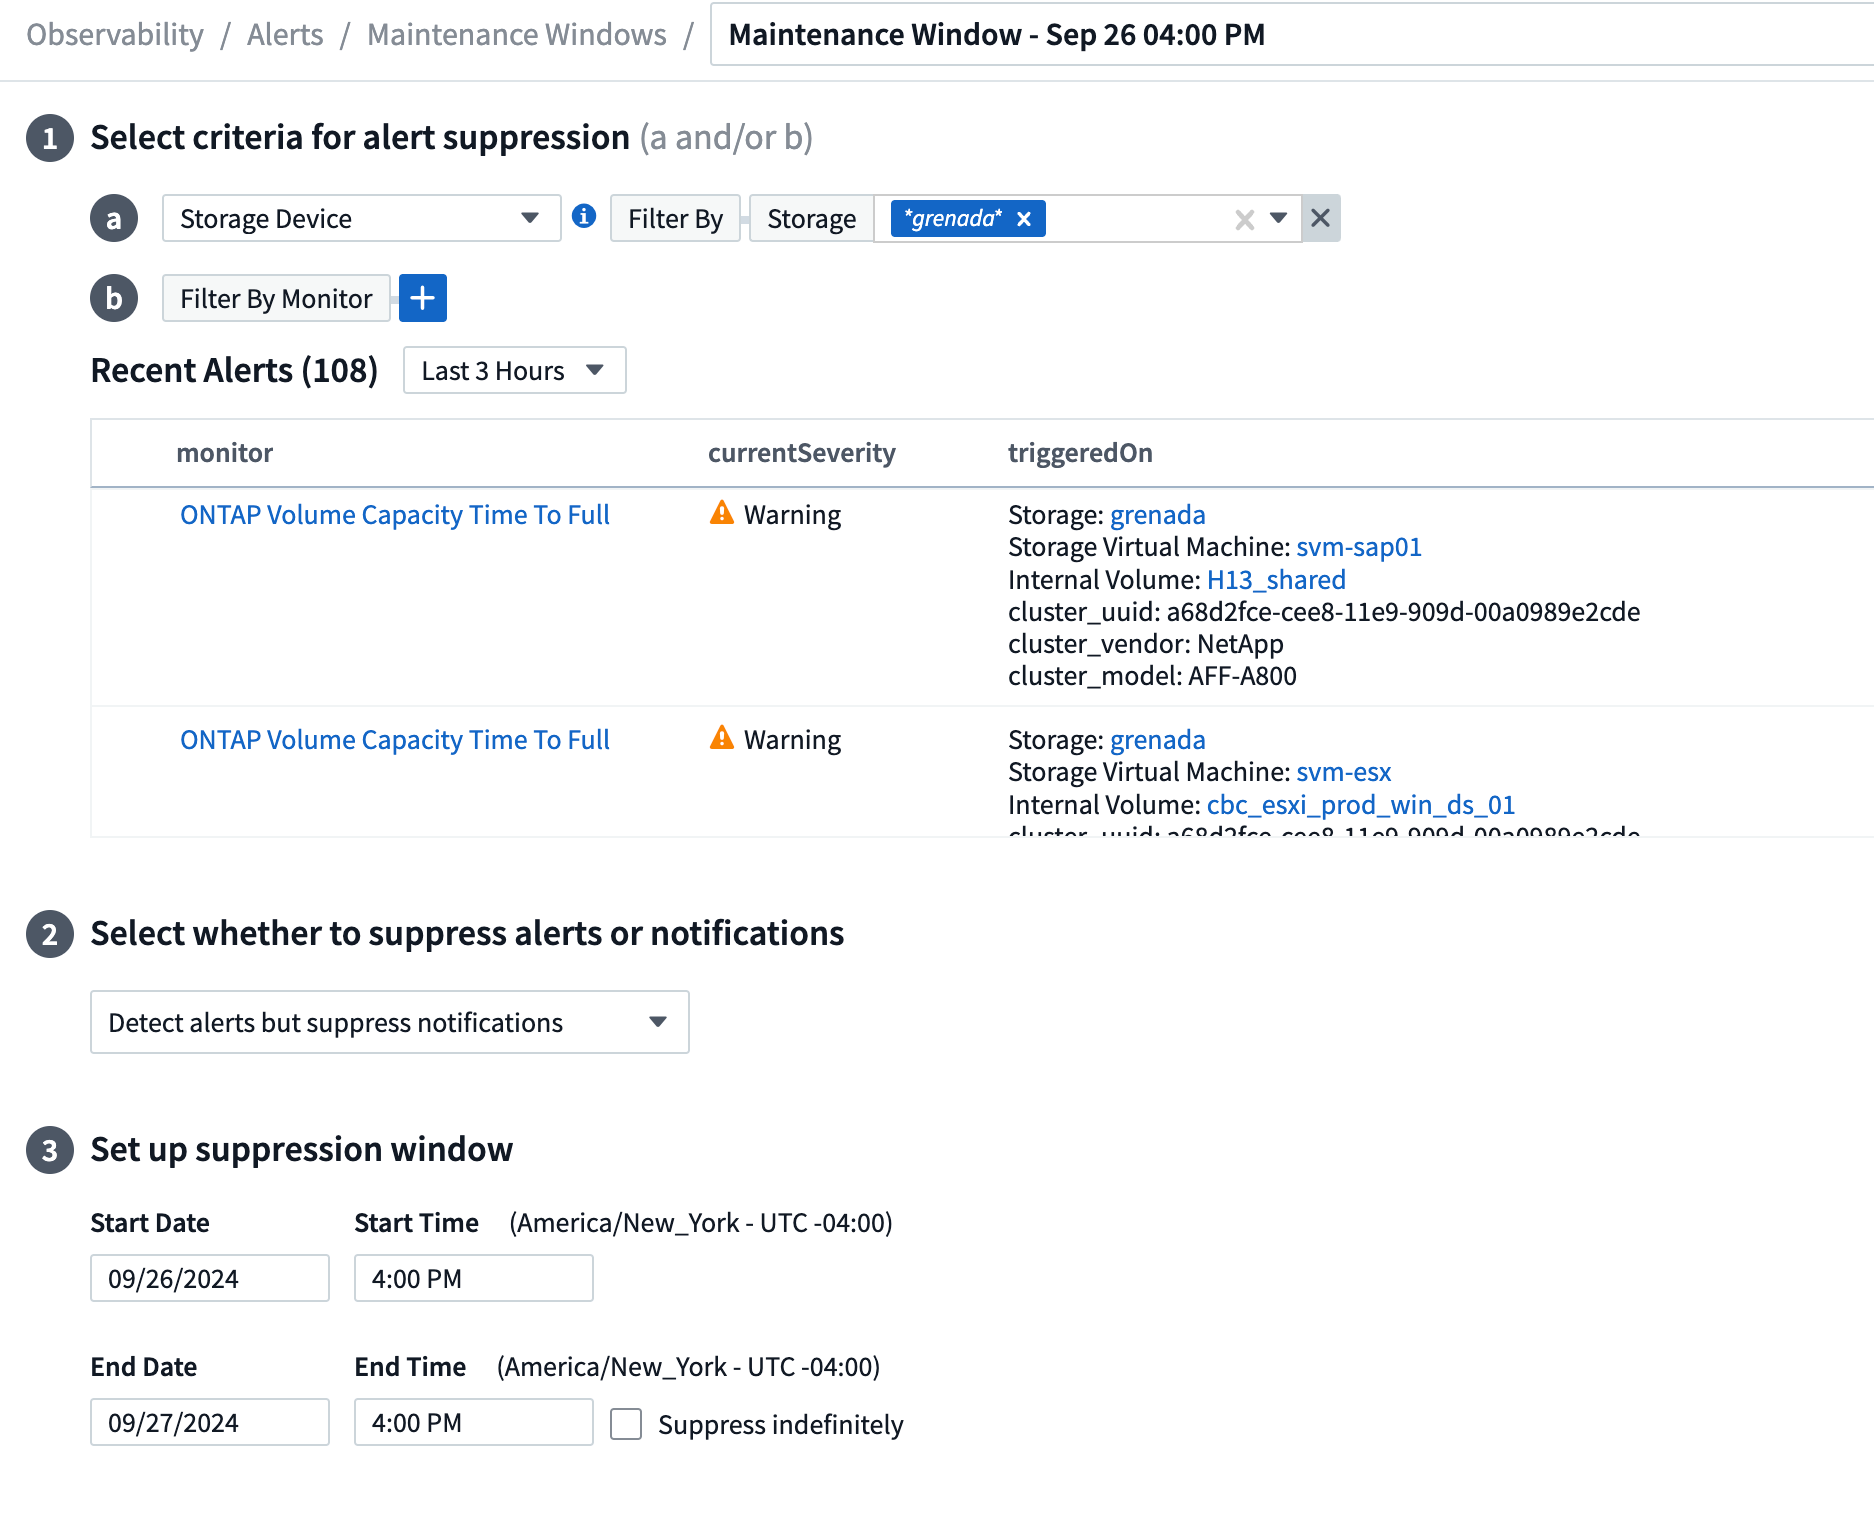
メンテナンス期間中のアラートの中断を最小限に抑える
メンテナンス ウィンドウを使用すると、スケジュールされたメンテナンス期間中にアラート通知を抑制できるため、不要な中断を回避できます。
メンテナンス ウィンドウを使用すると、選択したオブジェクトとメトリックに対して、アラート通知を抑制する特定のメンテナンス期間をスケジュールできます。たとえば、特定のストレージ システムが計画されたアップグレード期間内にある場合、それらのストレージ システムによってトリガーされるアラート通知を抑制できます。
抑制されるのはアラート通知 (電子メール、Webhook) のみであることに注意してください。アラート自体は、Observability > Alerts > All Alerts ページに引き続き表示されます。
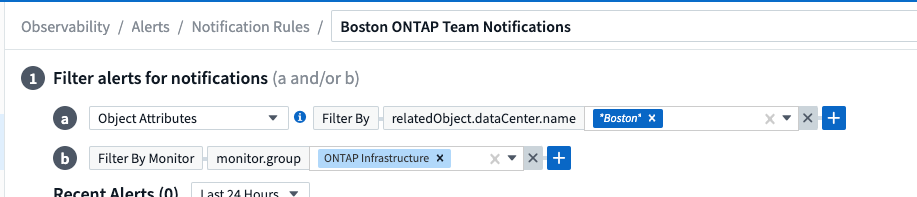
新しいアラート通知ルールでアラート管理を効率化
アラート通知ルールにより、モニターとチーム間の通知管理が簡素化されます。
組織のチャネル全体でアラートの配信を制御し、適切な情報が適切なチームに届くようにします。異なるチームごとに個別のモニターを管理する必要はありません。関連するオブジェクト属性 (ストレージ名、データセンター、アプリケーション名) またはモニター属性 (グループ、重大度) に基づいてアラートをルーティングします。
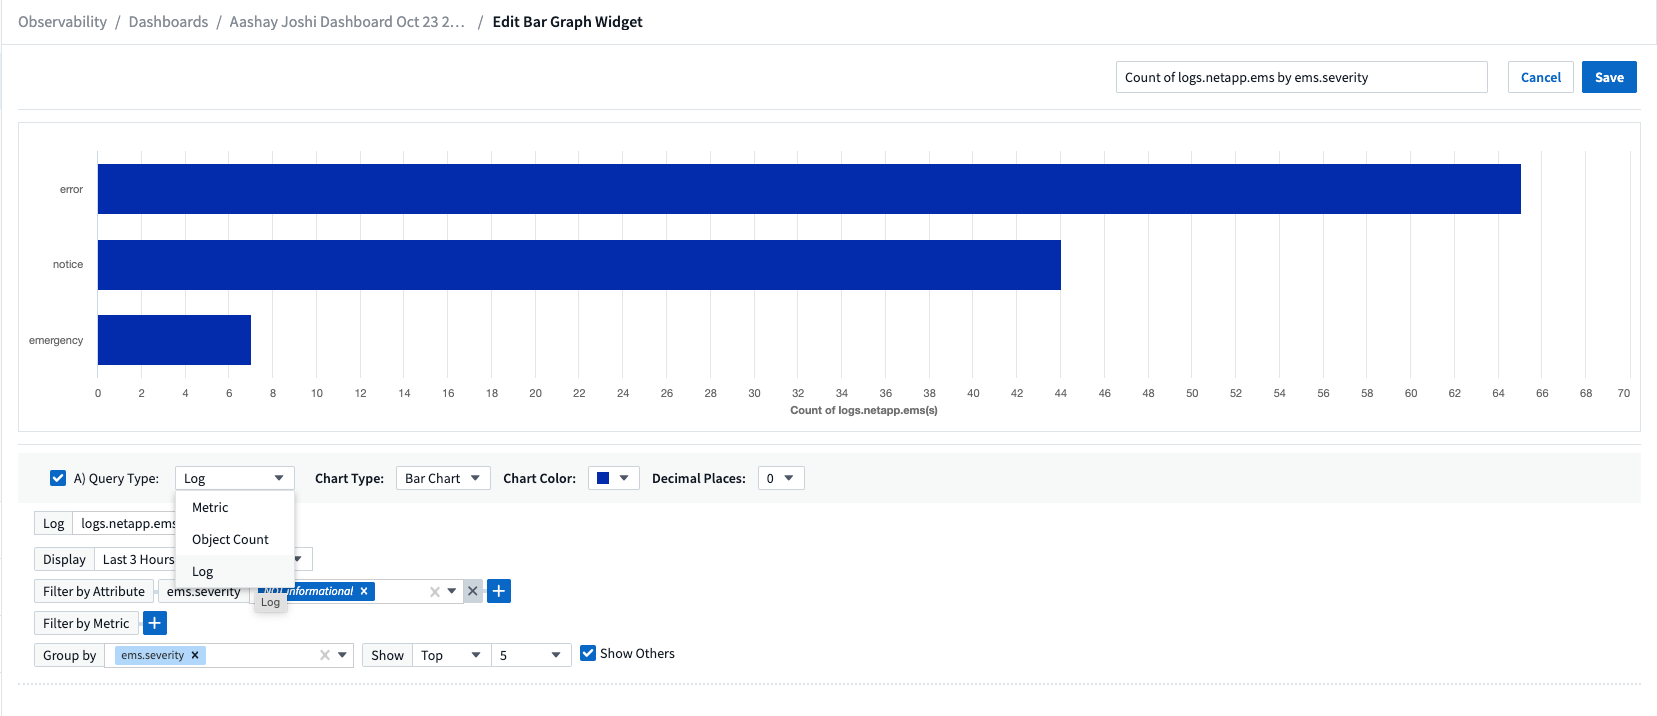
ダッシュボードのログ分析
ダッシュボードにログ イベントを含めることができるようになり、イベント データを視覚化して、環境をより包括的かつ状況に応じて把握できるようになりました。ダッシュボードを離れずにログを調査し、関連するメトリックを表示します。
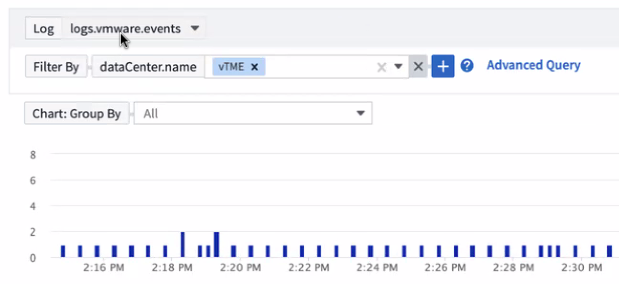
VMware イベントによる VMware の可観測性の向上
リアルタイム イベントを使用して VMware 環境をプロアクティブに管理およびトラブルシューティングします。 VMware イベントは、VM の移行、リソースの割り当て、ホストの健全性に関する分析情報を提供します。クエリ、ダッシュボード、モニターで使用できるようになりました。 VMware バージョン 8 以上が必要です。 logs.vmware.events ソースを選択するだけです。
VMware イベントは、前述の DII の新しい構成変更分析にも使用されます。
データコレクターの更新:
-
Pure FlashBlade: このコレクターは、REST API バージョン 2 を公開する FlashBlade クラスターからインベントリとパフォーマンス データを収集します。
2024年9月
Data Infrastructure Insights(旧Cloud Insights)のご紹介
2024 年 9 月 24 日火曜日、 NetApp はCloud Insightsの名称を * Data Infrastructure Insights* (DII) に正式に変更しました。これは、Insight ユーザー カンファレンスのメイン ステージ基調講演および Insight カンファレンス製品プレス リリースにおいて、Haiyan Song 氏によって発表されました。
DII サービスは同じままです。機能の変更や修正はありません。これは、すべての IT インフラストラクチャに対するサービス名とその機能をより適切に一致させるための名前変更です。
2024年8月
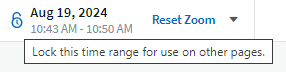
時間範囲に固有のデータを表示する
アラートを調査していますか? チャートを拡大しましたか? これらのアクションにより、それらのページの時間範囲が変更されます。これで、その時間範囲をロックし、他のCloud Insightsページに移動して、ロックされた時間範囲に固有のデータを表示できるようになります。調査とトラブルシューティングがずっと簡単になりました。
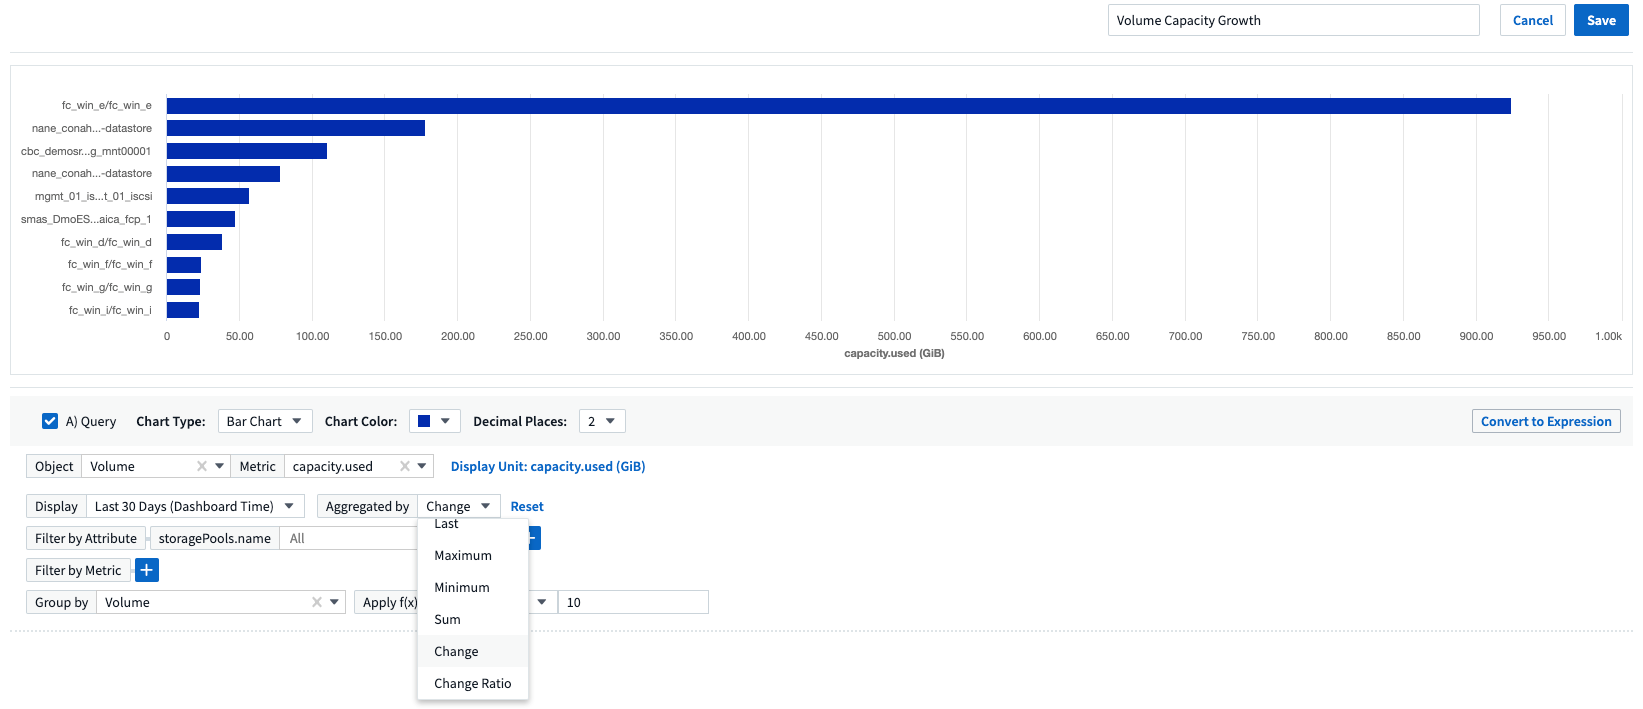
変化と変化率(%)分析
変化率の時間集計は、時間の経過に伴うメトリック値の重要な変化と傾向を識別するのに役立ちます。これらの洞察は、特定の時間における大幅な容量増加や単一ポートのパフォーマンスの変化など、何が変化したかを理解するための鍵となります。
-
変更 - 選択した期間内の 2 つのポイント間のメトリックの変化を観察します。
-
変化率 - 選択した期間内の初期ポイントに対する 2 つのポイント間のメトリックの比例変化を観察します。
ログクエリ結果を .CSV にエクスポートする
ログ クエリの結果を表示するときに、新しい [エクスポート] ボタンをクリックすると、最大 10,000 行を .CSV に簡単にエクスポートできます。これにより、データのアクセス性が向上し、データ分析とレポート作成が容易になり、他のデータ処理ツールとのシームレスな統合が可能になります。

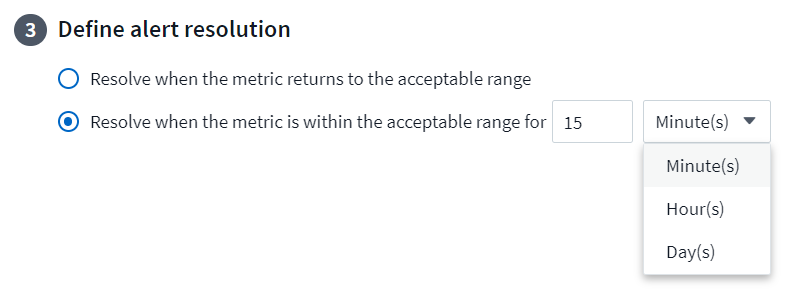
時間でアラートを解決する
Cloud Insightsでは、監視対象のメトリックが指定された期間にわたって許容範囲内に留まった場合にアラートを解決するオプションが提供されるようになりました。これにより、複数のアラートを 1 つに統合することで、定義されたしきい値を繰り返し超えるメトリックに関連するノイズを削減し、真の問題に集中できるようになります。
2024年7月
AIOps: 異常検出
Cloud Insights は機械学習を使用して、環境内のデータ パターンの予期しない変化を検出し、問題を早期に特定できるようにプロアクティブなアラートを提供します。
データ センターは、時間帯や曜日によって動作が異なります。 Cloud Insights は、週ごとの季節性を使用して、各曜日と時間ごとの過去の行動を比較します。
異常検出モニタリングは、「正常」の定義が不明確な場合、時間の経過と共に動作が変化する、しきい値を手動で定義することが不可能な大量のデータを扱う場合などの状況に対してアラートを提供できます。
新しい"異常検出モニター"選択したオブジェクト メトリックでこのような異常が発生した場合に警告します。
ワークロードセキュリティの改善
NFS 4.1 サポート
SVM データ コレクターは、 ONTAP 9.15.1 以降で、NFS 4.1 までの NFS バージョンをサポートするようになりました。
新しいフォレンジックアクティビティAPI
法医学活動"API"新しいバージョンがあります。フォレンジック アクティビティの API を呼び出す場合は、cloudsecure_forensics.activities.v2 API を使用します。
この API を複数回呼び出す場合、最良の結果を得るには、呼び出しが並列ではなく順番に行われるようにしてください。複数の並列呼び出しにより、API がタイムアウトする可能性があります。
ダッシュボードのナビゲーションが簡単になりました
この機能は、運用ワークフローを合理化し、チーム間のコラボレーションを容易にすることを目的としています。
ダッシュボードをグループ化すると、必要な可視性をすばやく簡単に取得できるようになります。また、新しいナビゲーション メニューを使用すると、場所を失うことなくさまざまなダッシュボード間を移動できるため、インフラストラクチャの探索と管理が簡単になります。ダッシュボード グループを運用ランブックに合わせて、エクスペリエンスをさらに向上させます。
2024年6月
オペレーティングシステムのサポート
Cloud Insights Acquisition Unitsでは、以下のオペレーティングシステムがサポートされています。"すでにサポートされています" :
-
Red Hat Enterprise Linux 8.9、8.10、9.4
-
ロッキー 9.4
-
AlmaLinux 9.3 および 9.4
2024年5月
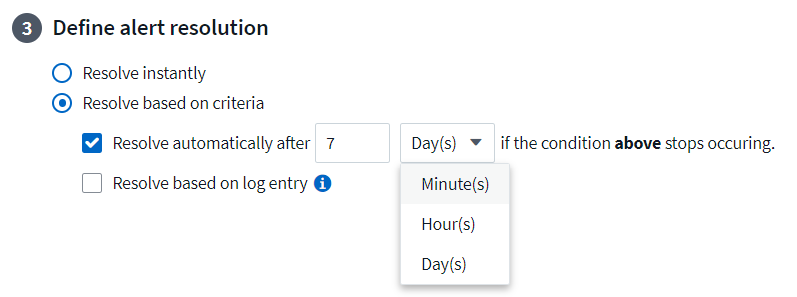
時間に基づいてアラートを自動的に解決する
ログ アラートは時間に基づいて解決できるようになりました。アラート条件が発生しなくなった場合、指定された時間が経過すると、 Cloud Insights はアラートを自動的に解決できます。アラートを数分、数時間、または数日で解決することを選択できます。
2024年4月
Kubernetes の iSCSI サポート
Cloud Insightsでは、Kubernetes に関連付けられた iSCSI ストレージのマッピングがサポートされるようになり、Kubernetes ネットワーク マップを使用してトラブルシューティングを高速化できるほか、レポート経由でチャージバック レポートやショーバック レポートを提供できるようになります。
オペレーティングシステムのサポート
Cloud Insights Acquisition Unitsでは、以下のオペレーティングシステムがサポートされています。"すでにサポートされています" :
-
Oracle エンタープライズ Linux 8.8
-
Red Hat Enterprise Linux 8.8
-
ロッキー 9.3
-
OpenSUSE Leap 15.1 から 15.5
-
SUSE Enterprise Linux Server 15、15 SP2 から 15 SP5
2024年3月
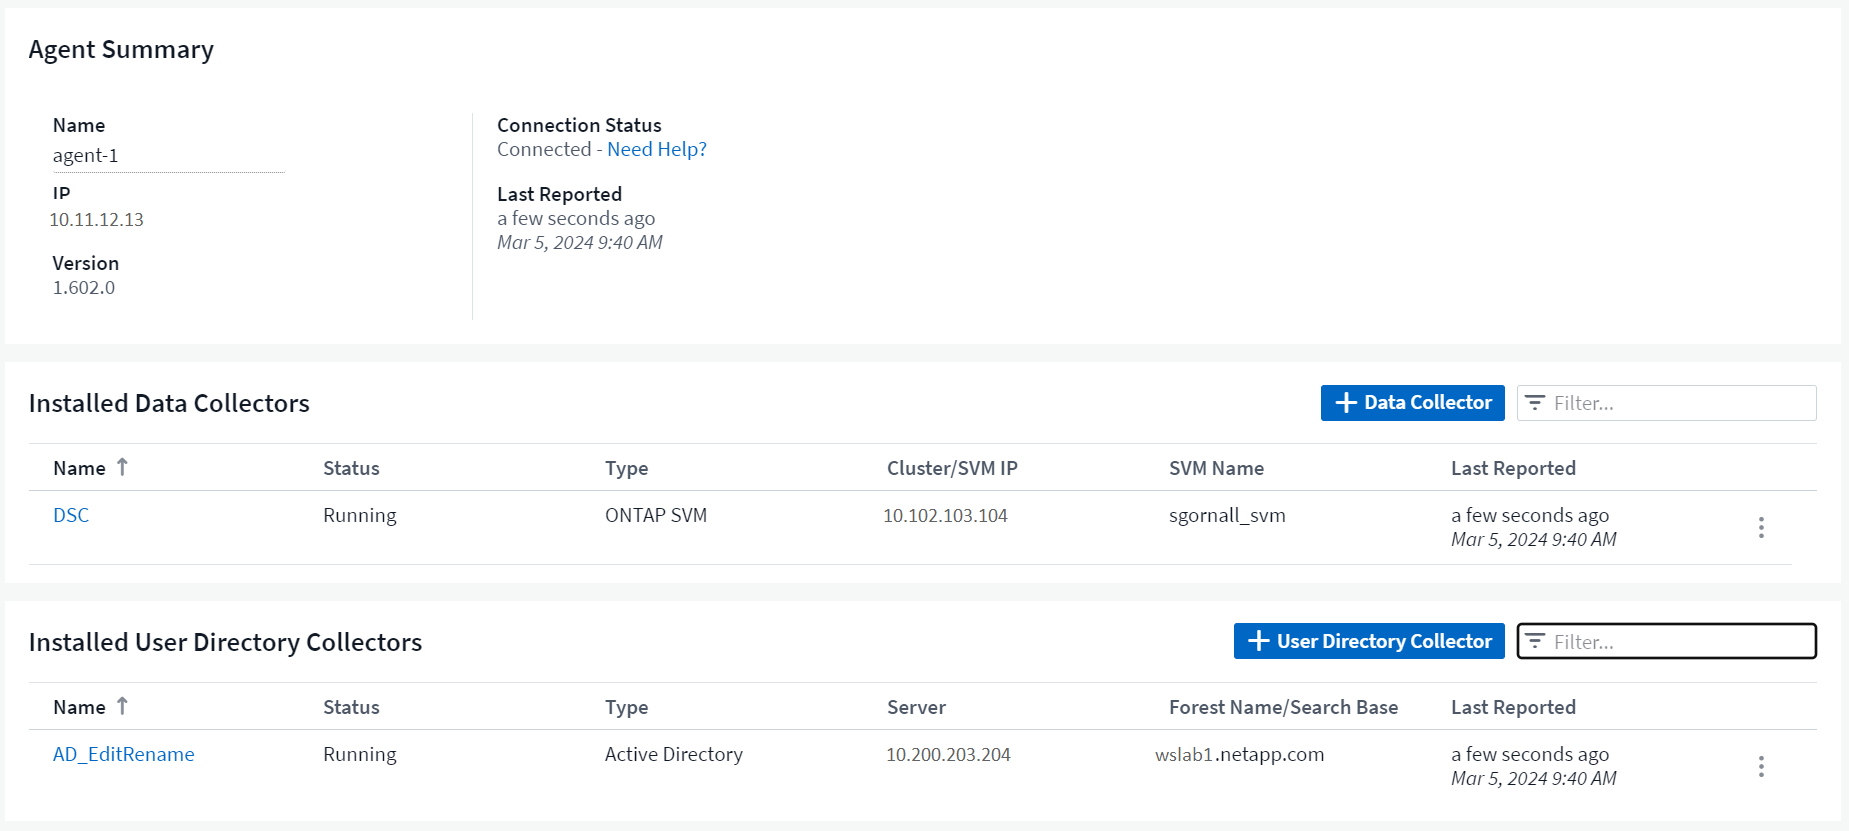
ワークロードセキュリティエージェントの詳細
各 Workload Security エージェントには独自のランディング ページがあり、そこではエージェントに関する概要情報や、そのエージェントに関連付けられているインストール済みのデータ コレクターとユーザー ディレクトリ コレクターを簡単に確認できます。
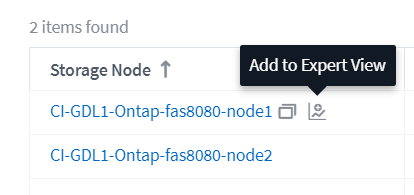
より多くのデータをより速くグラフ化
アセットのランディング ページでデータを分析する場合、エキスパート ビュー チャートに追加データを追加するのは簡単です。ランディング ページの各テーブルで、オブジェクト タイプに関連データがある場合は、そのオブジェクトの上にマウス カーソルを合わせると、「エキスパート ビューに追加」アイコンが表示されます。このアイコンを選択すると、そのオブジェクトが追加リソースに追加され、エキスパート ビュー チャートに表示されます。
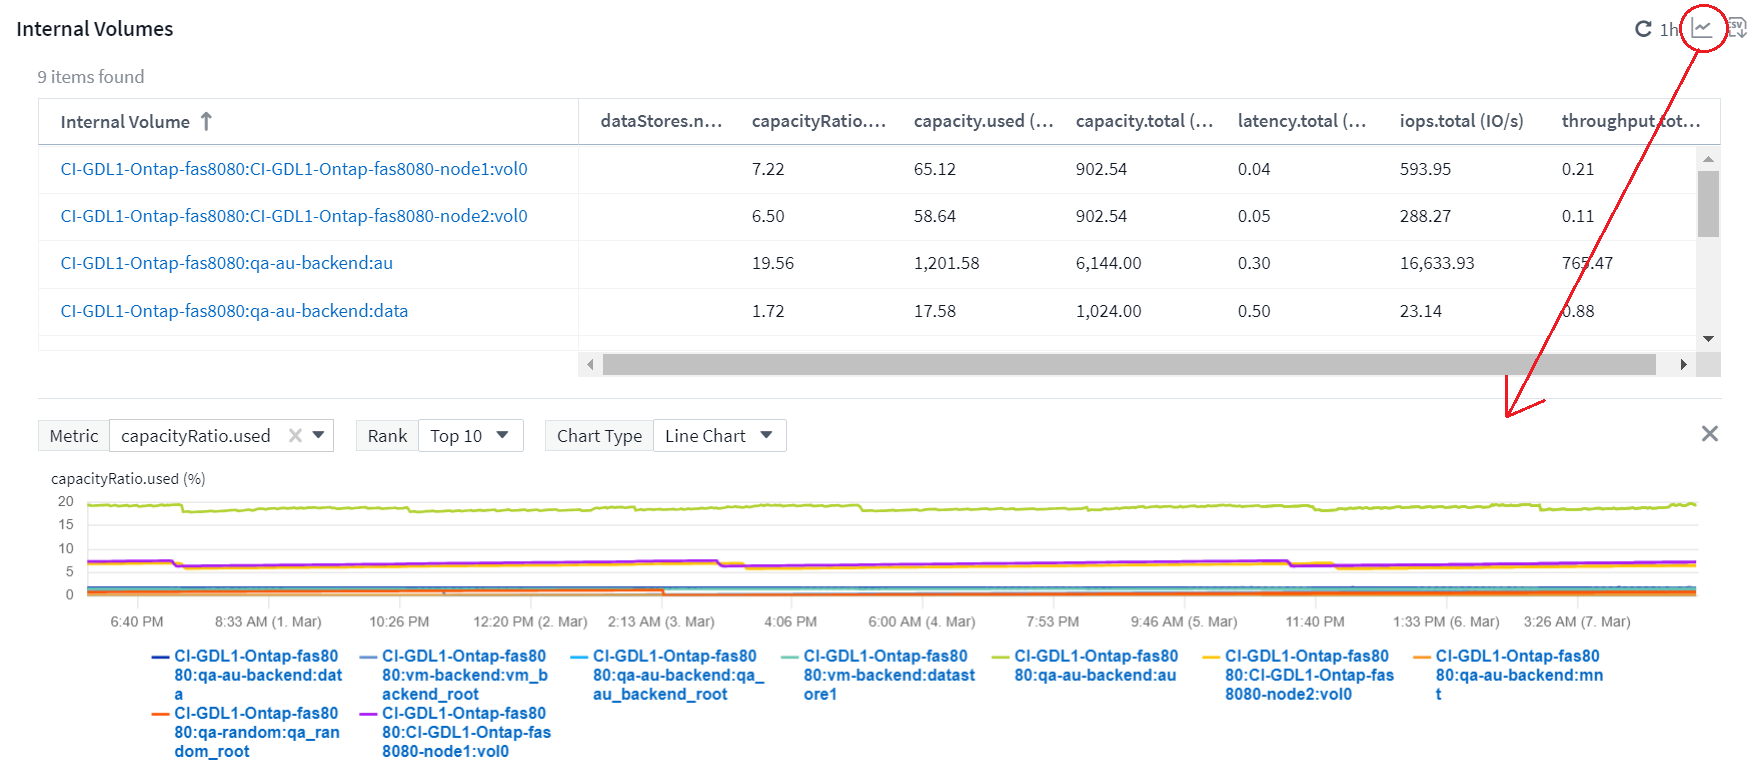
あるいは、ランディング ページ テーブルのデータを独自のグラフで表示したい場合もあります。 _チャートを表示_アイコンを選択するだけで、表の下のチャートが開きます。
2024年2月
ユーザビリティの改善
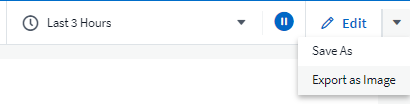
右隅のドロップダウンから [画像としてエクスポート] を選択して、現在のダッシュボードの スナップショット を保存します。 Cloud Insights は、現在のウィジェットの状態の .PNG を作成します。
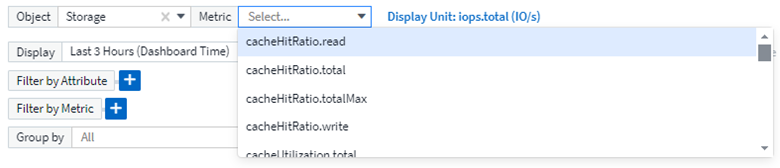
ウィジェットやモニターなどの*オブジェクトとメトリックの選択*がこれまで以上に簡単になりました。必要なオブジェクト タイプを選択し、別のドロップダウンでそのオブジェクトに関連するメトリックを選択します。
データ コレクターと取得ユニットのエクスポート リストを、ページ上部にあるアイコンを選択して .CSV にエクスポートします。

[ヘルプ > サポート] ページが再構成され、探している情報を見つけやすくなりました。また、ご要望にお応えして、このページに API Swagger とユーザー ドキュメントへの直接リンクを追加しました。
アラート リスト ページの「triggeredOn」列の リンク は、そのオブジェクトにランディング ページがある場合、適切なランディング ページに移動します。

名前空間内のすべての変更を表示する
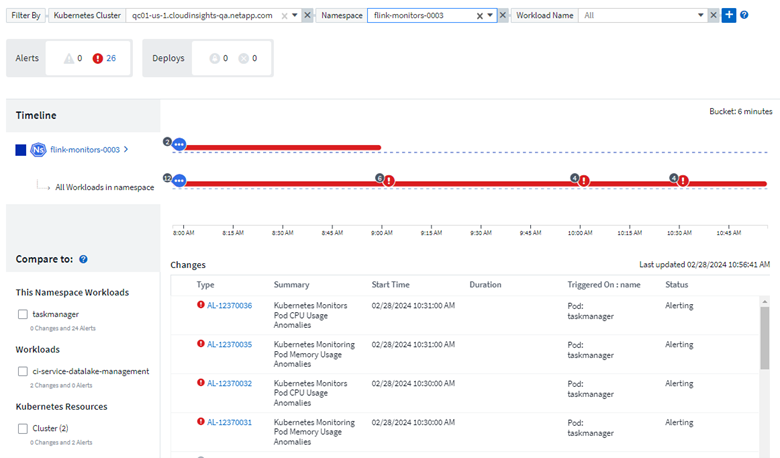
Kubernetes 変更分析では、クラスターと名前空間を選択したときに変更のタイムラインを表示できるようになりました。事前にワークロードも選択しておく必要があります。クラスターと名前空間でフィルタリングすると、その名前空間内のすべてのワークロード変更のタイムラインが 1 行に表示されます。
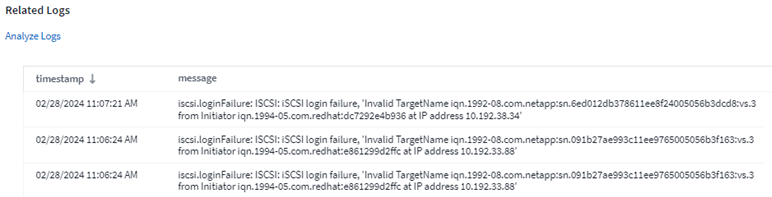
アラートの関連ログ
ログ アラートを表示すると、関連するログ エントリが新しいテーブルに表示されます。ログ エントリは、アラートと同じソースおよび期間内に発生し、同じ条件に該当する場合、関連しているとみなされます。さらに詳しく調べるには、「ログの分析」を選択します。
ONTAPスイッチデータの収集
ワークロードセキュリティデータコレクターAPI
大規模な環境では、新しいデータ コレクター API を使用して Workload Security コレクターの作成を自動化できます。詳細については、「管理 > API アクセス > API ドキュメント」に移動し、「Workload Security」API タイプを選択してください。
2024年1月
まだ使っていないCloud Insights の機能を試す
Cloud Insightsの初期トライアルに加えて、以下の機能もご利用いただけます。"モジュール評価" 。たとえば、 Cloud Insightsに加入していて、ストレージと仮想マシンを監視している場合、Kubernetes を環境に追加すると、Kubernetes Observability の 30 日間の試用期間が自動的に開始されます。 Kubernetes Observability 管理対象ユニットの使用量は、試用期間が終了するまで、サブスクライブした権利にはカウントされません。
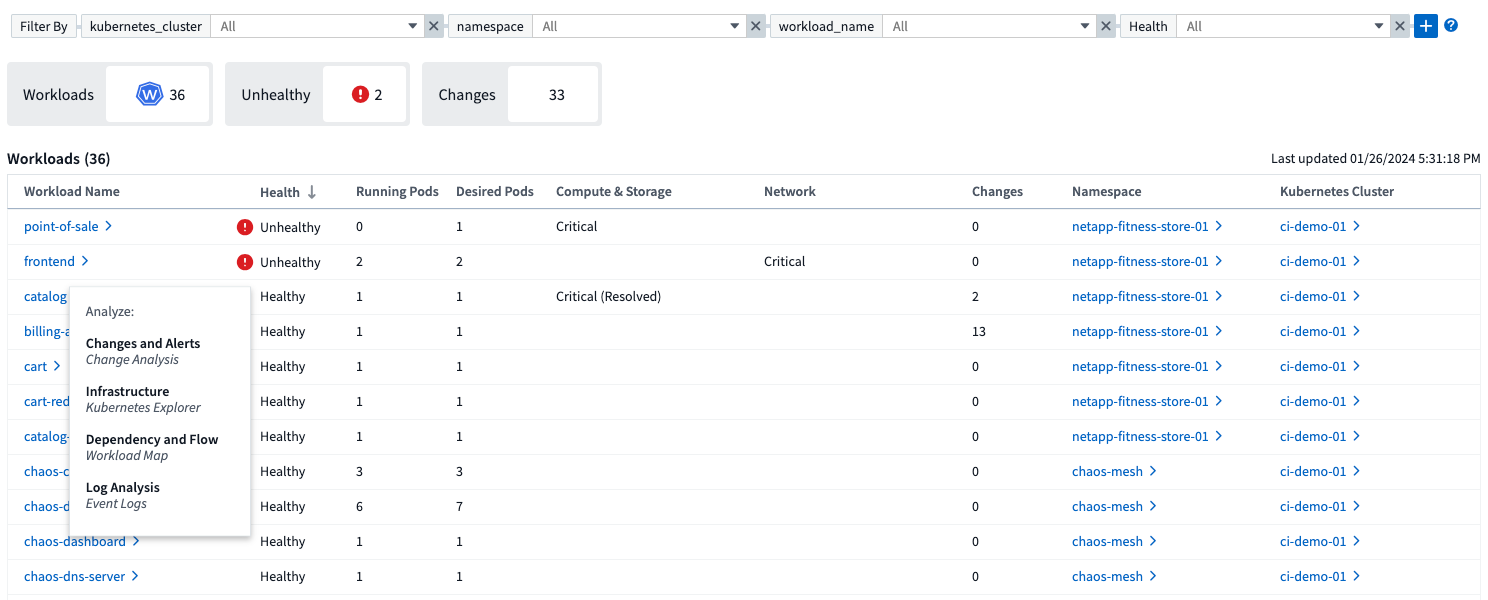
私のワークロードはどの程度健全でしょうか?
ワークロードの健全性は、Kubernetes > Explore > Workloads ページで一目で確認できるため、どのワークロードのパフォーマンスが良好で、どのワークロードに支援が必要かをすぐに確認できます。ヘルスの問題がインフラストラクチャ、ネットワーク、または構成の変更に関連しているかどうかを簡単に識別し、ドリルダウンして根本原因を分析します。
データコレクターの更新
データドメイン識別
Data Domain コレクターは、フェイルオーバー イベント全体にわたって耐久性を確保するために HA システムをより適切に識別できるように改善されました。この変更により、HA システム内の Data Domain アプライアンスが 1 回だけ 再識別され、その後、それらの資産のすべての注釈が削除されます (これらのアレイが再識別されるため)。 Data Domain オブジェクトに注釈を再度添付する必要があります。
強化されたランサムウェア検出MLアルゴリズム
Workload Security には、最も高度な攻撃をより迅速かつ正確に検出するための新しい第 2 世代のランサムウェア検出 ML アルゴリズムが含まれています。
行動の「季節性」: 週末の行動は平日とは異なるパターンに従う場合があり、また朝の行動は午後とは異なる場合もあります。 Workload Security アルゴリズムでは、この季節性を考慮します。
非推奨の機能
機能が進化するにつれて、機能が廃止されることがあります。 Cloud Insightsで廃止された機能の一部を以下に示します。
Workload Secure REST cloudsecure_forensics.activities.v1 API は非推奨になりました
cloudsecure_forensics.activities.v1 API は非推奨になりました。この API は、Storage Workload Security 環境内のエンティティに関連付けられたアクティビティに関する情報を返します。この API は cloudsecure_forensics.activities.*v2*_ に置き換えられました。
この API の GET は以前は次の結果を返していました。
{
  "count": 24594,
  "limit": 1000,
  "offset": 0,
  "results": [
    {
      "accessLocation":
この API は次を返します:
{
  "limit": 1000,
  "meta": {
    "page": {
      "after": "lvlvk3pp.4cpzcg4kpybl",
      "before": "lvlxy3dz.4cq5ajdnl9fk",
      "size": 1000
    }
  },
  "results": [
    {
      "accessLocation": "10.249.6.220",
詳細については、「管理 > API アクセス > API ドキュメント > ワークロード セキュリティ」にある Swagger ドキュメントを参照してください。
2023年12月
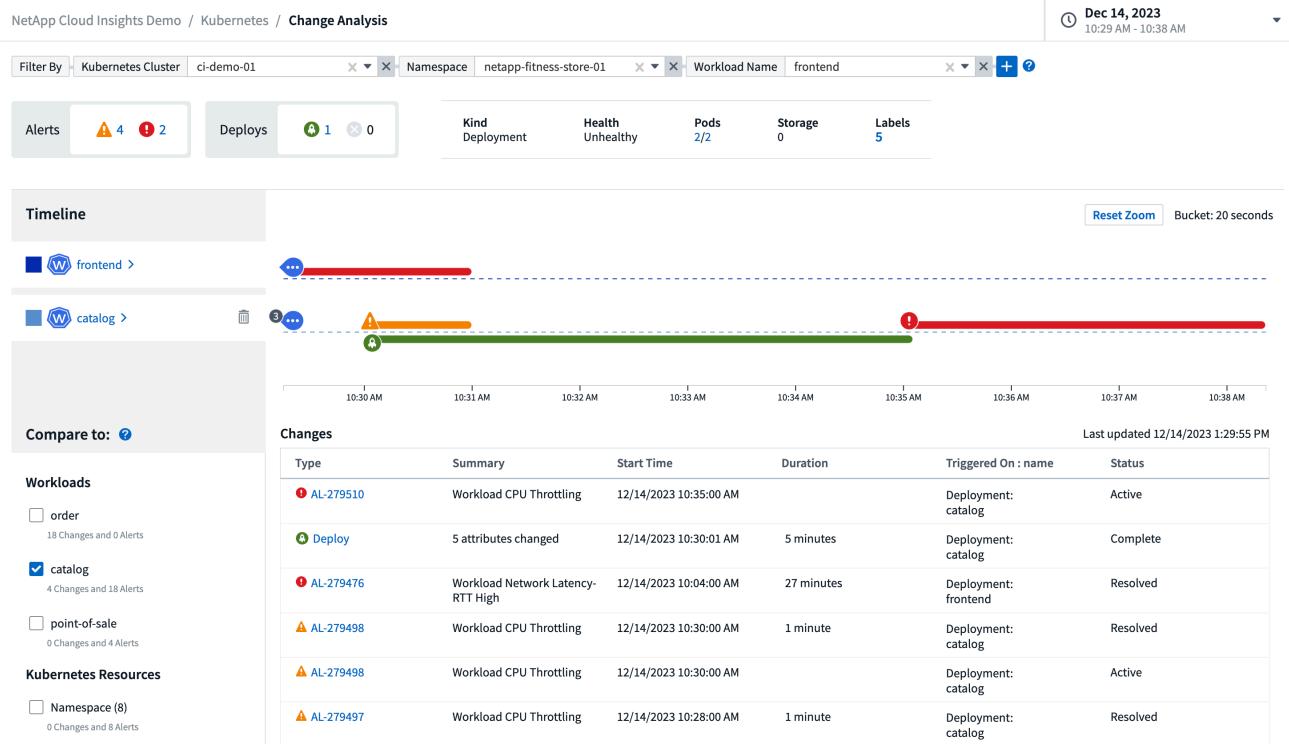
変更分析の概要
Kubernetes"変更分析" Kubernetes 環境の最近の変更を一括して表示します。アラートと展開ステータスを簡単に確認できます。 Change Analytics を使用すると、すべてのデプロイメントと構成の変更を追跡し、それを K8s サービス、インフラストラクチャ、クラスターの健全性およびパフォーマンスと相関させることができます。
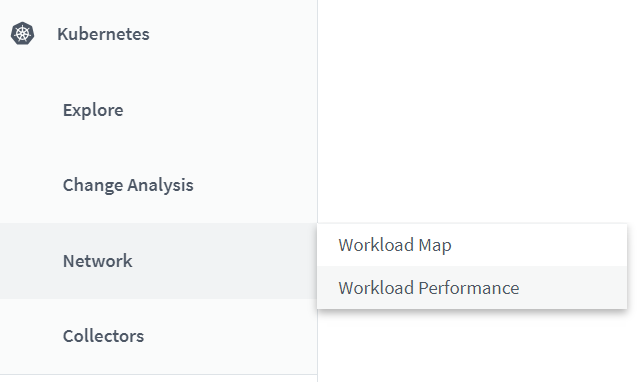
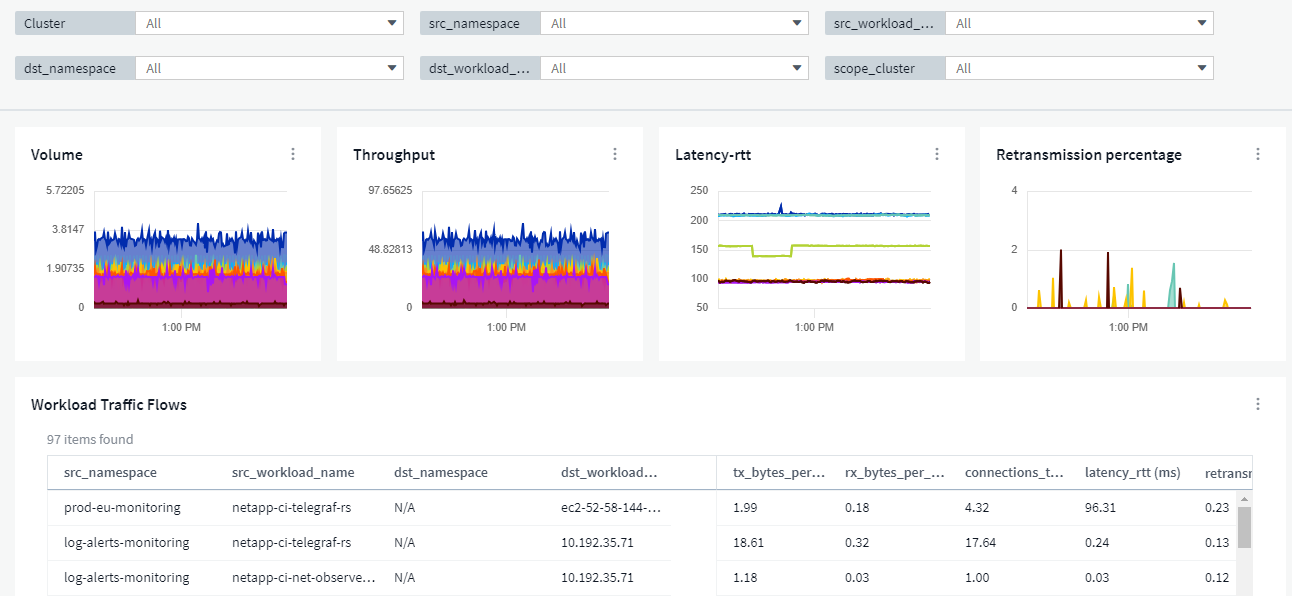
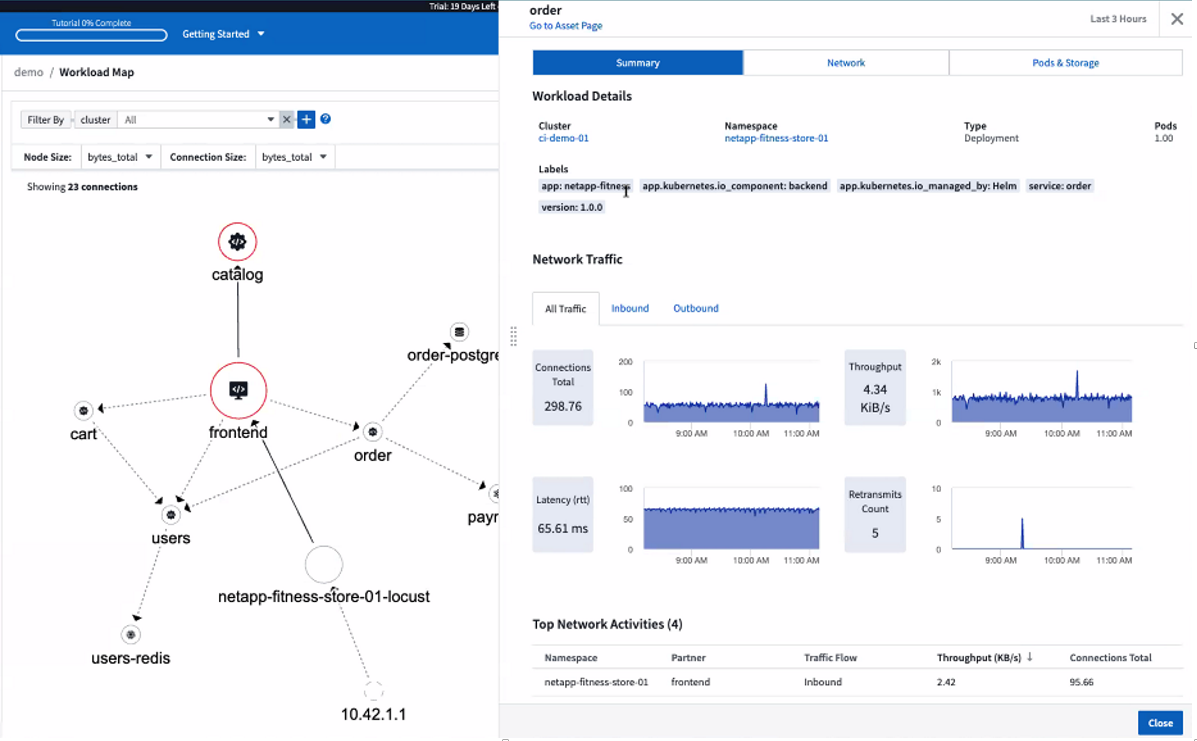
Kubernetes ワークロード パフォーマンス ダッシュボード
包括的な Kubernetes ワークロード パフォーマンス ダッシュボードでは、ワークロードのパフォーマンスを一目で確認できます。ボリューム、スループット、レイテンシ、再送信の傾向のグラフと、環境内の各名前空間のワークロード トラフィックの表をすばやく表示します。フィルターを使用すると、関心のある領域に簡単に焦点を合わせることができます。
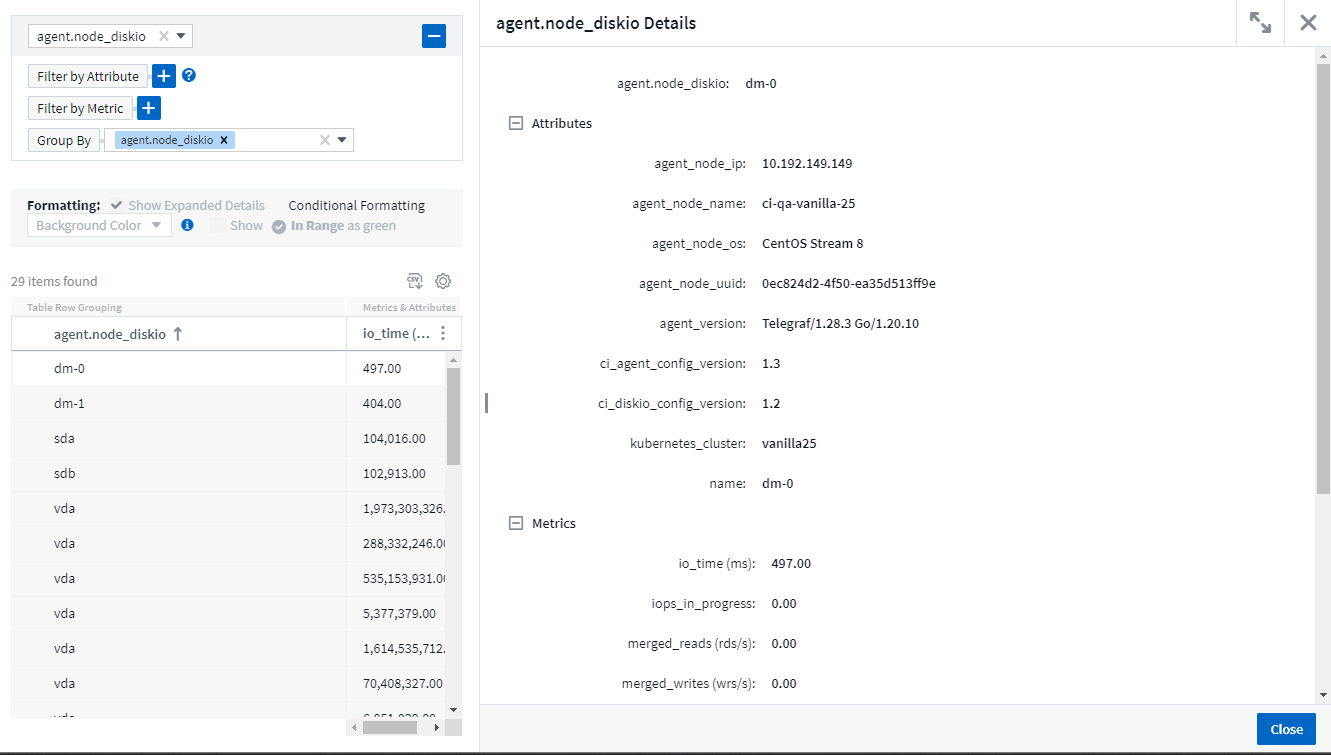
クエリの詳細を1つの画面で表示
クエリで行を選択すると、選択した行の属性、注釈、メトリックの詳細を示すサイド パネルが開き、オブジェクトのランディング ページにドリルダウンすることなく役立つ情報が提供されます。行またはサイド パネル内のリンクを使用すると、簡単にナビゲートできます。
データコレクターの更新:
-
* Brocade FOS REST*: このコレクターは「プレビュー」から移行され、一般利用可能になりました。注意すべき点:
-
FOS は FOS 8.2 で REST API を導入しました。ただし、ルーティングなどの一部の機能は、9.0 でのみ REST API 機能を受け取ります。
-
8.2 以降の FOS アセットと 8.2 未満の FOS アセットが混在するファブリックがある場合、 Cloud Insights FOS REST コレクターはそれらの古いアセットを検出できません。 FOS REST コレクターを編集し、そのコレクターから除外するデバイスの IPv4 アドレスのコンマ区切りリストを作成できます。
-
-
SELinux: Cloud Insightsには、SELinux 強制が有効になっている Linux 環境内での操作の堅牢性を確保するための Linux Acquisition Unit の初期インストールの機能強化が含まれています。これらの機能強化は、新しい AU 展開にのみ影響します。AU のアップグレードに関連する SELinux の問題がある場合は、 NetAppサポートに連絡して SELinux 構成を修正してください。
2023年11月
ワークロード セキュリティ: コレクターの一時停止/再開
Workload Security では、データ コレクターが 実行中 状態の場合、データ コレクターを一時停止できます。コレクターの「3 つのドット」メニューを開き、[一時停止] を選択します。コレクターが一時停止している間は、 ONTAPからデータは収集されず、コレクターからONTAPにデータは送信されません。収集を再開するには、「再開」を選択します。
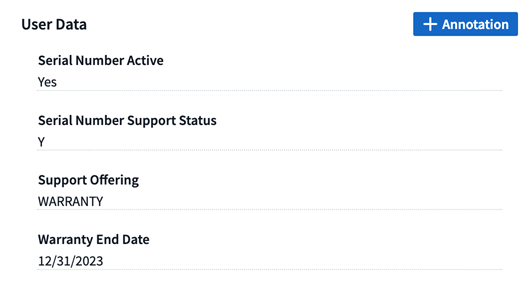
ストレージノードのサポート情報
ストレージ ノードのランディング ページの [ユーザー データ] セクションでは、サポート オファリング、現在のステータス、サポート ステータス、保証終了日に関する情報が一目でわかります。 Cloud Insights は現在、 NetAppデバイスに関してのみこの情報を自動公開することに注意してください。また、これらのサポート フィールドは注釈であるため、クエリやダッシュボードで使用できることにも注意してください。
VMWare タグをCloud Insights のアノテーションにマッピングする
その"VMware"データ コレクターを使用すると、VMWare で構成されている同じ名前のタグを使用して、 Cloud Insights のテキスト注釈を入力できます。
Brocade CLI コレクターの信頼性強化 (FOS 9.1.1c 以降のファームウェア)
9.1.1c ファームウェアを実行している一部のBrocade Fibre Channel スイッチでは、特定の CLI コマンドの出力の先頭に「motd」ログイン バナー テキスト、またはユーザーにデフォルトのパスワードを変更するように求める警告が追加される場合があります。 Brocade CLI コレクターは、これら 2 種類の不要なテキストを無視するように強化されました。
この機能強化の前は、仮想ファブリックが存在しない FOS 9.1.1c スイッチのみがこのコレクター タイプで検出可能でした。
2023年10月
強化されたワークロードセキュリティ
Workload Security は次のように改善されました。
-
アクセス拒否: ワークロードセキュリティはONTAPと統合して"「アクセス拒否」イベント"追加の分析および自動応答レイヤーを提供します。
-
許可されたファイルの種類: 既知のファイル拡張子でランサムウェア攻撃が検出された場合、そのファイル拡張子を"許可されるファイルの種類"不要なアラートを防ぐためのリスト。
モジュールトライアル
Cloud Insightsの初期トライアルに加えて、以下の機能もご利用いただけます。"モジュール評価" 。たとえば、すでに Infrastructure Observability に加入しているが、環境に Kubernetes を追加する場合は、Kubernetes Observability の 30 日間のトライアルが自動的に開始されます。評価期間の終了時に、Kubernetes Observability 管理対象ユニットの使用量に対してのみ課金されます。
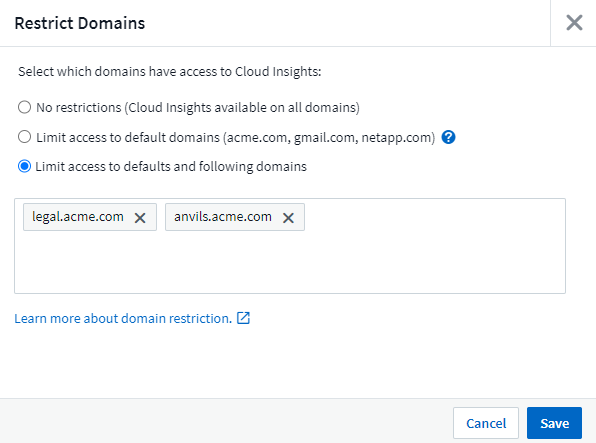
指定されたドメインへのアクセスを制限する
管理者とアカウント所有者は、"Cloud Insightsへのアクセスを制限する"指定したドメインにメールを送信します。 管理 > ユーザー管理 に移動し、ドメインの制限 ボタンを選択します。
データコレクターの更新
次のデータ コレクター/取得ユニットの変更が行われます。
-
Isilon / PowerScale REST: emc_isilon.node_pool.* の名前で、 Cloud Insights の拡張分析機能にさまざまな新しい属性とメトリックが追加されました。これらのカウンターと属性により、ユーザーは node_pool 容量消費のダッシュボードとモニターを構築できるようになります。異なるハードウェア ノード モデルから構築された Isilon クラスターを持つユーザーには複数のノード プールがあり、ノード プール レベルで HDD/SSD/合計容量消費を把握することは、監視と計画の両方に役立ちます。
-
Rubrik「サービス アカウント」認証のサポート: Cloud Insightsの Rubrik コレクターは、従来の HTTP 基本認証 (ユーザー名とパスワード) と、ユーザー名 + シークレット + 組織 ID を必要とする Rubrik のサービス アカウント アプローチの両方をサポートするようになりました。
2023年9月
ログから必要なものを簡単に見つける
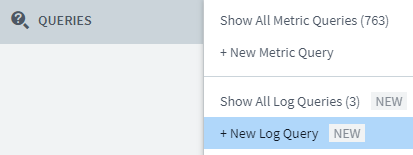
ログクエリ(オブザーバビリティ > ログクエリ > +新しいログクエリ)には、"機能強化"ログの探索をより簡単に、より有益なものにします。
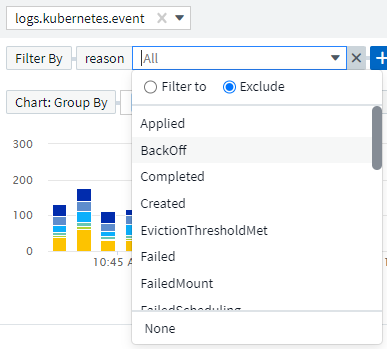
含める/除外する
値をフィルタリングする場合、フィルタに一致する結果を*含める*か*除外する*かを簡単に選択できます。 「除外」を選択すると、「NOT <値>」フィルターが作成されます。含める値と除外値を 1 つのフィルターで組み合わせることができます。
高度なクエリ
*高度なクエリ*を使用すると、AND、NOT、OR、ワイルドカードなどを使用して値を組み合わせたり除外したりする「自由形式」のフィルターを作成できます。
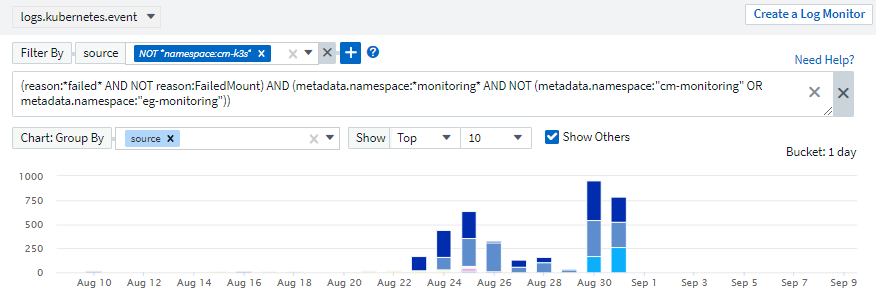
「フィルター条件」と高度なクエリは「AND」結合されて 1 つのクエリを形成します。結果は結果リストとグラフに表示されます。
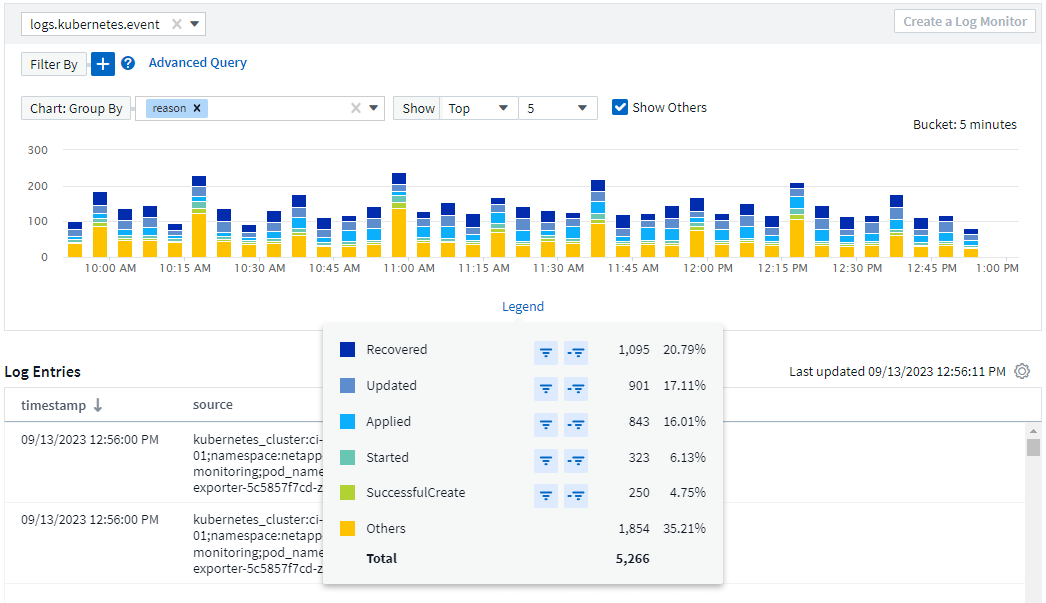
チャートのグループ化
ログ属性を選択して「グループ化」すると、リストとグラフに現在のフィルターの結果が表示されます。グラフでは、列が色別にグループ化されています。グラフ内の列にマウスを移動すると、グラフの凡例を展開したときに表示される全体的な情報と同様に、特定のエントリに関する詳細が表示されます。凡例では、特定のグループに対して含めるフィルターまたは除外フィルターを設定することもできます。
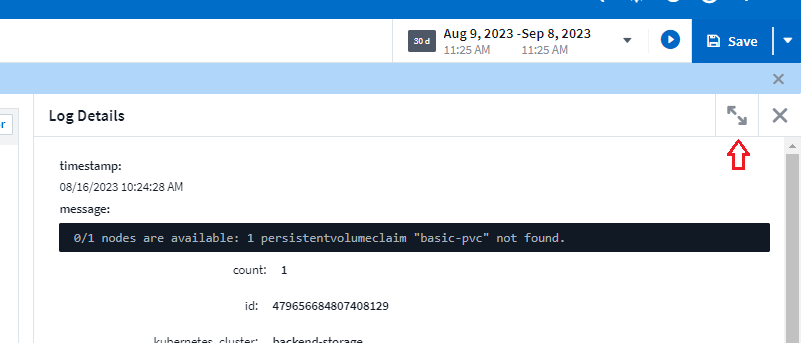
「フローティング」ログ詳細パネル
ログ クエリを使用してログを探索する場合、リスト内のエントリを選択すると、そのエントリの詳細パネルが開きます。スライドアウト パネルを「フローティング」(画面の残りの部分の上に表示) するか、「ページ内」(ページ内の独自のフレームとして表示) で表示するかを選択できるようになりました。これらのビューを切り替えるには、パネルの右上隅にある「ページ内 / フローティング」ボタンを選択します。
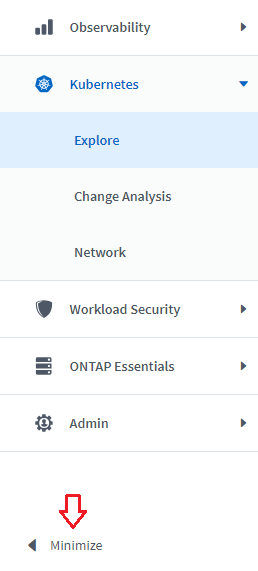
メニューを折りたたむ
メニューの下にある「最小化」ボタンを選択すると、左側のCloud Insightsナビゲーション メニューを折りたたむことができます。メニューが最小化されているときにアイコンの上にマウスを置くと、どのセクションが開くかを確認できます。アイコンを選択するとメニューが開き、そのセクションに直接移動します。
データコレクターの改善
Cloud Insightsにより、データ コレクター情報の表示と検索が簡単になりました。
-
データ コレクター リストの処理 がより効率的になり、リストの表示や移動にかかる時間が大幅に短縮されます。多数のデータ コレクターが存在する大規模な環境の場合は、データ コレクターの一覧を表示するときに大幅な改善が見られます。
-
データ コレクター サポート マトリックス は .PDF ファイルから .HTML ベースのページに移動され、ナビゲートが高速化され、保守が容易になりました。新しいマトリックスをここでチェックしてください: https://docs.netapp.com/us-en/cloudinsights/reference_data_collector_support_matrix.html
2023年8月
Isilon/PowerScale ログと高度な分析データの収集
Isilon REST および PowerScale REST コレクターには、次の改善が含まれています。
-
Isilon ログイベントはクエリやアラートで使用できます
-
Isilon Advanced Analytic 属性は、クエリ、ダッシュボード、アラートで使用できます。
-
emc_isilon.cluster
-
emc_isilon.ノード
-
emc_isilon.node_disk
-
emc_isilon.net_iface
-
これらは、Isilon REST および/または PowerScale REST コレクターのユーザーに対してデフォルトで有効になっています。 NetApp は、Isilon CLI ベースのコレクターのユーザーに対し、上記のような機能強化を受けるために、新しい REST API ベースのコレクターに移行することを強く推奨しています。
改善されたワークロードマップ
ワークロード マップは、より使いやすく、ノイズが少なくなっています。同じワークロードと通信するすべての類似した外部サービスを 1 つのノードにグループ化することで、グラフの複雑さが軽減され、サービスがどのように相互接続されているかを理解しやすくなります。
グループ化されたノードを選択すると、そのノードに関連する各外部サービスのネットワーク トラフィック メトリックを含む詳細なテーブルが表示されます。
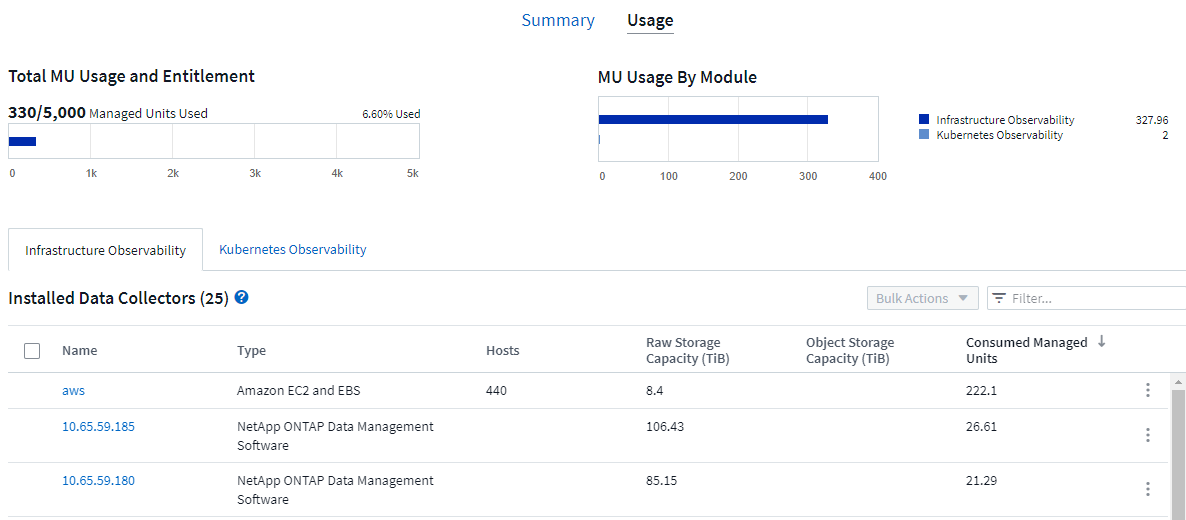
Kubernetes 管理ユニットの使用量の調整
Kubernetes クラスタ環境内のコンピューティング リソースがNetApp Kubernetes Monitoring Operator と基盤となるインフラストラクチャ データ コレクター (VMware など) の両方によってカウントされる場合、これらのリソースの使用量は、管理対象ユニットが最も効率的にカウントされるように調整されます。 Kubernetes MU の調整は、[管理] > [サブスクリプション] ページの [概要] タブと [使用状況] タブの両方で確認できます。
概要タブ: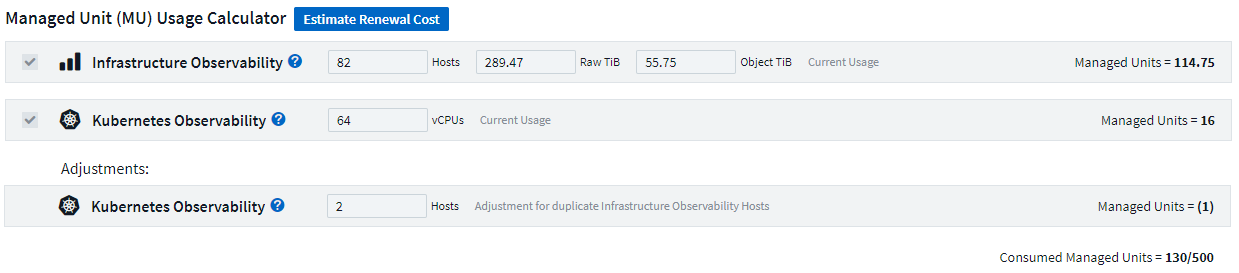
使用状況タブ: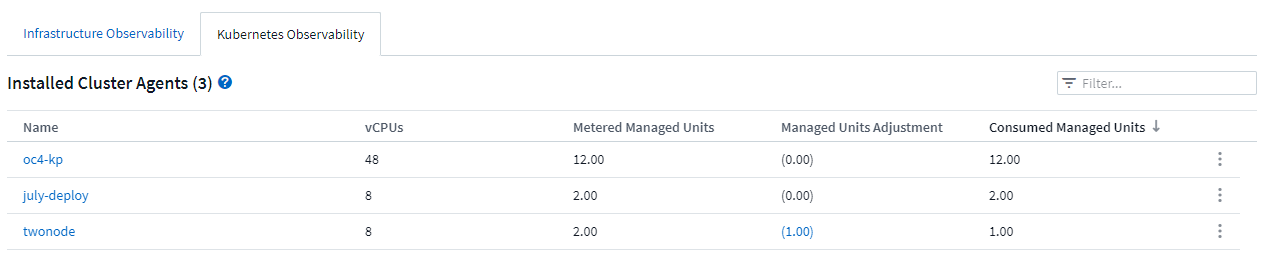
コレクター/取得の変更:
次のデータ コレクター/取得ユニットの変更が行われます。
-
取得ユニットは RHEL 8.7 をサポートするようになりました。
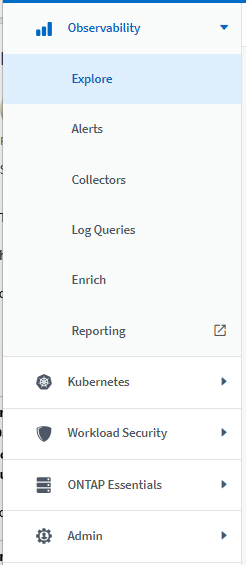
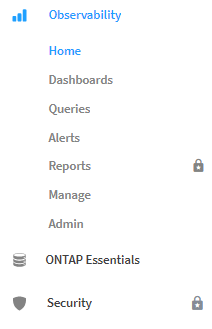
改善されたメニュー
お客様のワークフローをより適切にサポートするために、左側のナビゲーション メニューを更新しました。 Kubernetes などの新しいトップレベル項目により、顧客のニーズへの高速アクセスが提供され、統合された管理者コンソールがテナント所有者の役割をサポートします。
変更点の追加例をいくつか示します。
-
最上位の_Observability_メニューには、データ検出、アラート、ログクエリが表示されます。
-
オブザーバビリティとワークロードセキュリティの「APIアクセス」機能が1つのメニューにまとめられました
-
オブザーバビリティとワークロードセキュリティの「通知」機能も同様に、1つのメニューにまとめられました。
各メニューで見つけることができる機能の簡単なリストは次のとおりです。
可観測性:
-
探索(ダッシュボード、メトリッククエリ、インフラストラクチャインサイト)
-
アラート(モニターとアラート)
-
コレクター(データ収集装置および取得ユニット)
-
ログクエリ
-
エンリッチメント(注釈と注釈ルール、アプリケーション、デバイスの解像度)
-
レポート
Kubernetes:
-
クラスター探索とネットワークマップ
ワークロードセキュリティ:
-
アラート
-
法医学
-
コレクター
-
ポリシー
ONTAP の基本:
-
データ保護
-
セキュリティ
-
アラート
-
インフラ
-
ネットワーク
-
ワークロード *VMware
管理者:
-
API アクセス
-
監査
-
通知
-
購読情報
-
ユーザー管理
2023年7月
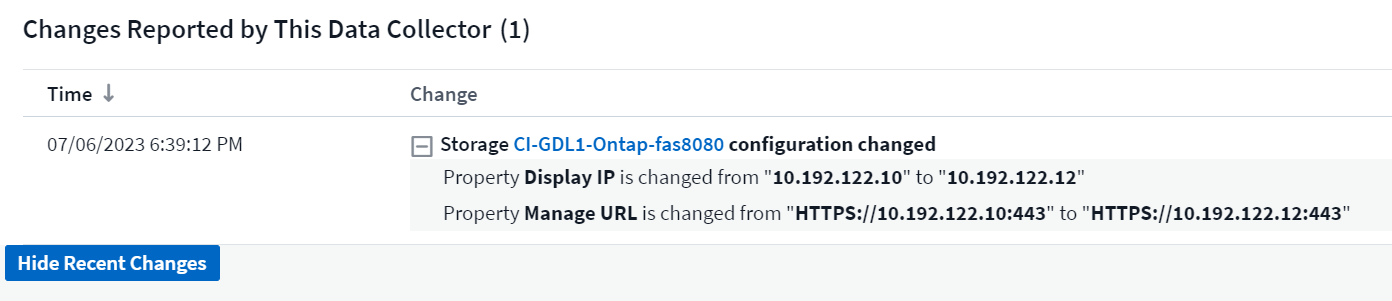
最近の変更を表示
データ コレクターのランディング ページに最近の変更のリストが含まれるようになりました。データ コレクターのランディング ページの下部にある [最近の変更] ボタンをクリックするだけで、データ コレクターの最近の変更が表示されます。
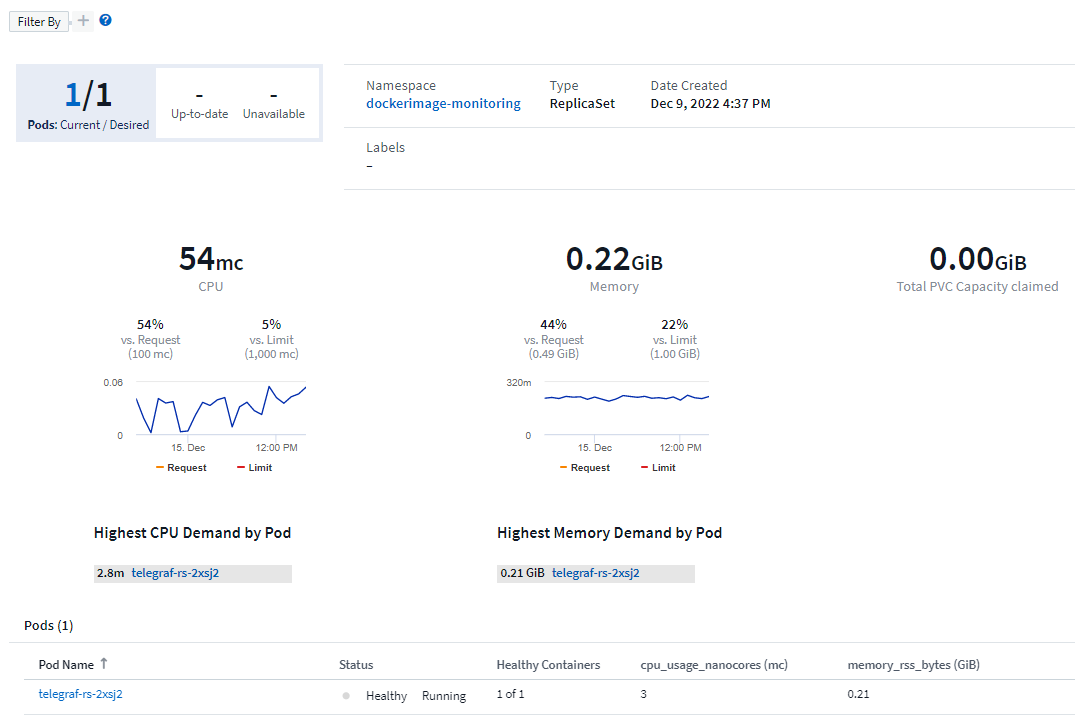
オペレーターの改善
以下の改善が行われました"Kubernetesオペレーター"展開:
-
Docker メトリック収集をバイパスするオプション
-
Telegraf Daemonsets および Replicasets に許容範囲を追加およびカスタマイズする機能
洞察:冷蔵倉庫の再利用
その"ONTAP Cold Storage Insight の再利用"FlexGroups をサポートするようになり、すべてのお客様にご利用いただけるようになりました。
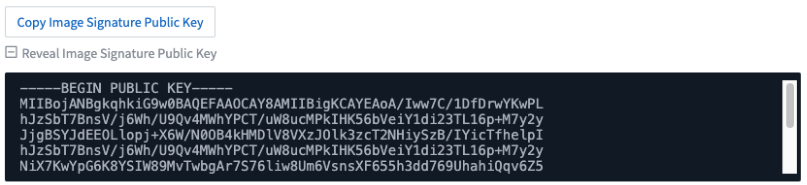
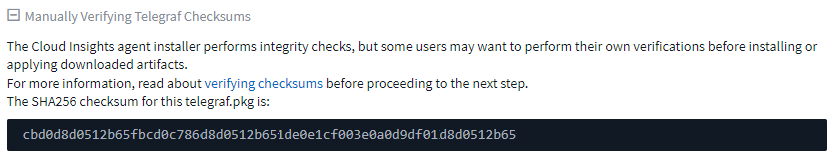
オペレーター画像署名
NetApp Kubernetes Monitoring Operator にプライベート リポジトリを使用するお客様は、Operator のインストール中にイメージ署名公開キーをコピーできるようになり、ダウンロードしたソフトウェアの信頼性を確認できるようになりました。オプションの手順で [イメージ署名の公開キーをコピー] ボタンを選択し、オペレーター イメージをプライベート リポジトリにアップロード します。
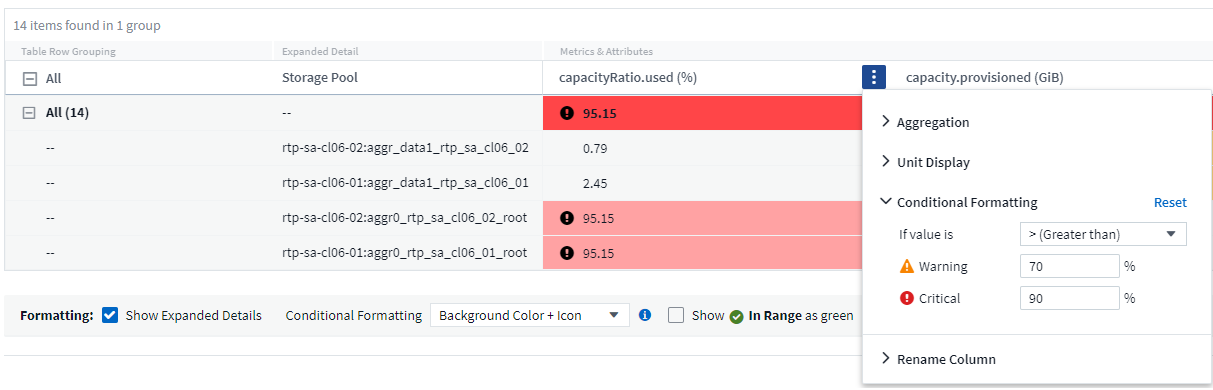
クエリの集計、条件付き書式など
集計、単位選択、条件付き書式、列名の変更はダッシュボードテーブルウィジェットの最も便利な機能の一つであり、これらの同じ機能が"クエリ"。
これらの機能は現在、統合型データ(Kubernetes、 ONTAP Advanced Metrics など)で利用可能であり、インフラストラクチャ オブジェクト(ストレージ、ボリューム、スイッチなど)でもまもなく利用可能になる予定です。
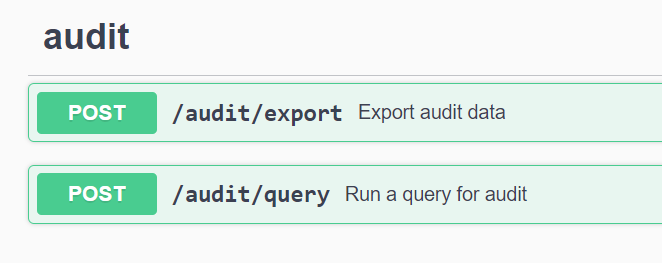
監査用API
API を使用して監査イベントをクエリまたはエクスポートできるようになりました。詳細については、「管理」>「API アクセス」に移動し、「API ドキュメント」リンクを選択してください。
データ収集者:Trident・エコノミー
Cloud Insights はTrident Economy Driver をサポートするようになり、次のようなメリットが実現されています。
-
ポッドとONTAP Qtree のマッピングとパフォーマンス メトリックを可視化します。
-
Kubernetes ポッドからバックエンド ストレージまでのシームレスなトラブルシューティングと簡単なナビゲーションを提供します。
-
モニターを使用してバックエンドのパフォーマンスの問題をプロアクティブに検出する
2023年6月
使用状況を確認する
2023 年 6 月から、 Cloud Insights機能セットに基づいて管理対象ユニットの使用状況の内訳が提供されます。インフラストラクチャの管理対象ユニット (MU) の使用状況と、Kubernetes に関連付けられた MU の使用状況をすばやく表示および監視できるようになりました。
Kubernetesネットワーク監視とマップはすべての
その"Kubernetes ネットワークパフォーマンスとマップ"Kubernetes ワークロード間の依存関係をマッピングすることでトラブルシューティングを簡素化し、Kubernetes ネットワーク パフォーマンスの遅延と異常をリアルタイムで可視化して、ユーザーに影響が及ぶ前にパフォーマンスの問題を特定します。プレビュー期間中に多くのお客様に役立ったと評価いただき、現在では誰でもご利用いただけるようになりました。
コレクター/取得の変更:
次のデータ コレクター/取得ユニットの変更が行われます。
-
Data Domain および Cohesity MU は 40 TiB : 1 MU で計測されます。
-
取得ユニットは、RHEL および Rocky 9.0 および 9.1 をサポートするようになりました。
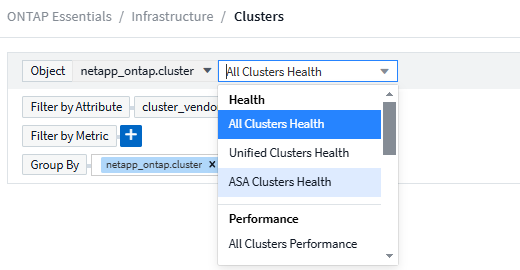
新しいONTAP Essentials ダッシュボード
次のONTAP Essentials ダッシュボードはプレビュー環境で利用可能でしたが、現在はすべてのユーザーが利用できるようになりました。
-
セキュリティダッシュボード
-
データ保護ダッシュボード (ローカルおよびリモート保護の概要を含む)
追加のシステムモニター
Cloud Insightsには次のシステム モニターが含まれています。
-
ストレージ VM FCP サービスが利用できません
-
ストレージ VM iSCSI サービスが利用できません
2023年5月
Kubernetes モニタリング オペレーターのインストールの改善
インストールと設定"NetApp Kubernetes 監視オペレーター"以下の改善により、これまで以上に簡単になりました。
-
環境"構成設定"単一の自己文書化された構成ファイルに保持されます。
-
Kubernetes Monitoring Operator イメージをプライベート リポジトリにアップロードするための手順を説明します。
-
カスタム構成を維持しながら Kubernetes モニタリングをアップグレードするには、1 つのコマンドで簡単にアップグレードできます。
-
より安全: API キーは秘密を安全に管理します。
-
CI/CD 自動化ツールとの統合と展開が簡単です。
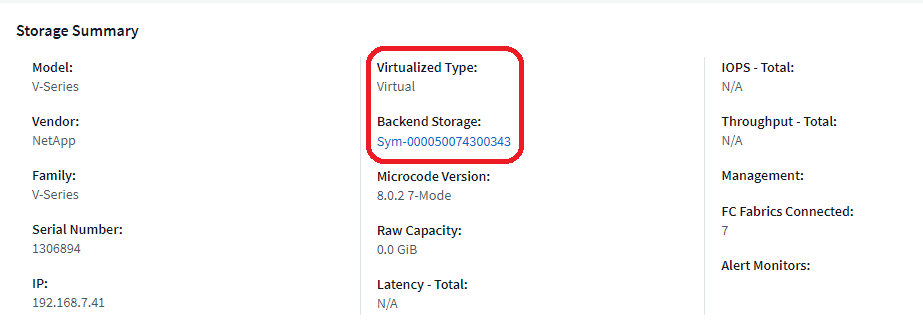
ストレージ仮想化
Cloud Insights は、ローカル ストレージを持つストレージ アレイと他のストレージ アレイの仮想化を区別できます。これにより、インフラストラクチャのフロントエンドからバックエンドに至るまで、コストを関連付け、パフォーマンスを区別できるようになります。
新しいWebhookパラメータ
作成する際は"ウェブフック"通知では、Webhook 定義に次のパラメータを含めることができるようになりました。
-
%%TriggeredOnKeys%%
-
%%トリガーオン値%%
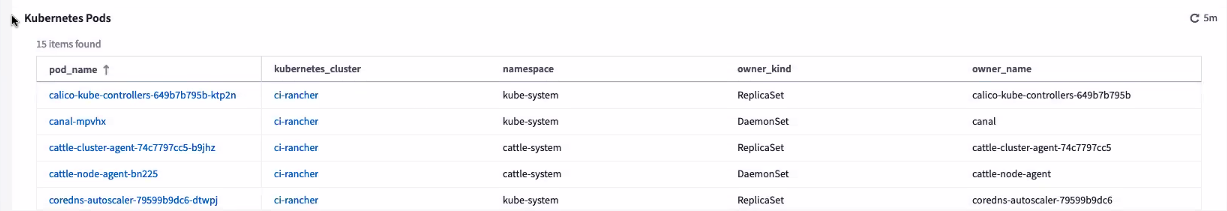
Kubernetesデータのレポート
Cloud Insightsによって収集された Kubernetes データ (永続ボリューム (PV)、PVC、ワークロード、クラスター、名前空間など) がレポートで使用できるようになり、Kubernetes のメトリックに関するチャージバック、傾向分析、予測、TTF 計算、その他のビジネス レポートが可能になります。
新規顧客向けにデフォルトのONTAPシステム モニターを有効化
新しいCloud Insights環境では、多くのONTAPシステム モニターがデフォルトで有効化(つまり、再開)されています。以前は、ほとんどのモニターはデフォルトで 一時停止 状態になっていました。ビジネスニーズは企業によって異なるため、"システムモニター"環境内でアラートを設定し、アラートのニーズに応じてそれぞれを一時停止または再開します。
2023年4月
Kubernetes パフォーマンス監視とマップ
その"Kubernetes ネットワークパフォーマンスとマップ"この機能により、Kubernetes ワークロード間の依存関係をマッピングすることでトラブルシューティングが簡素化されます。 Kubernetes ネットワーク パフォーマンスの遅延と異常をリアルタイムで可視化し、パフォーマンスの問題がユーザーに影響を与える前に特定します。この機能により、組織は Kubernetes トラフィック フローを分析および監査して全体的なコストを削減できます。
主な機能: • ワークロード マップは、Kubernetes ワークロードの依存関係とフローを示し、ネットワークとパフォーマンスの問題を強調表示します。 • Kubernetes ポッド、ワークロード、ノード間のネットワーク トラフィックを監視し、トラフィックとレイテンシの問題の原因を特定します。 • イングレス、エグレス、クロスリージョン、クロスゾーンのネットワーク トラフィックを分析することで、全体的なコストを削減します。
「スライドアウト」の詳細を表示するワークロード マップ:
Kubernetesパフォーマンスモニタリングとマップは、"プレビュー"特徴。
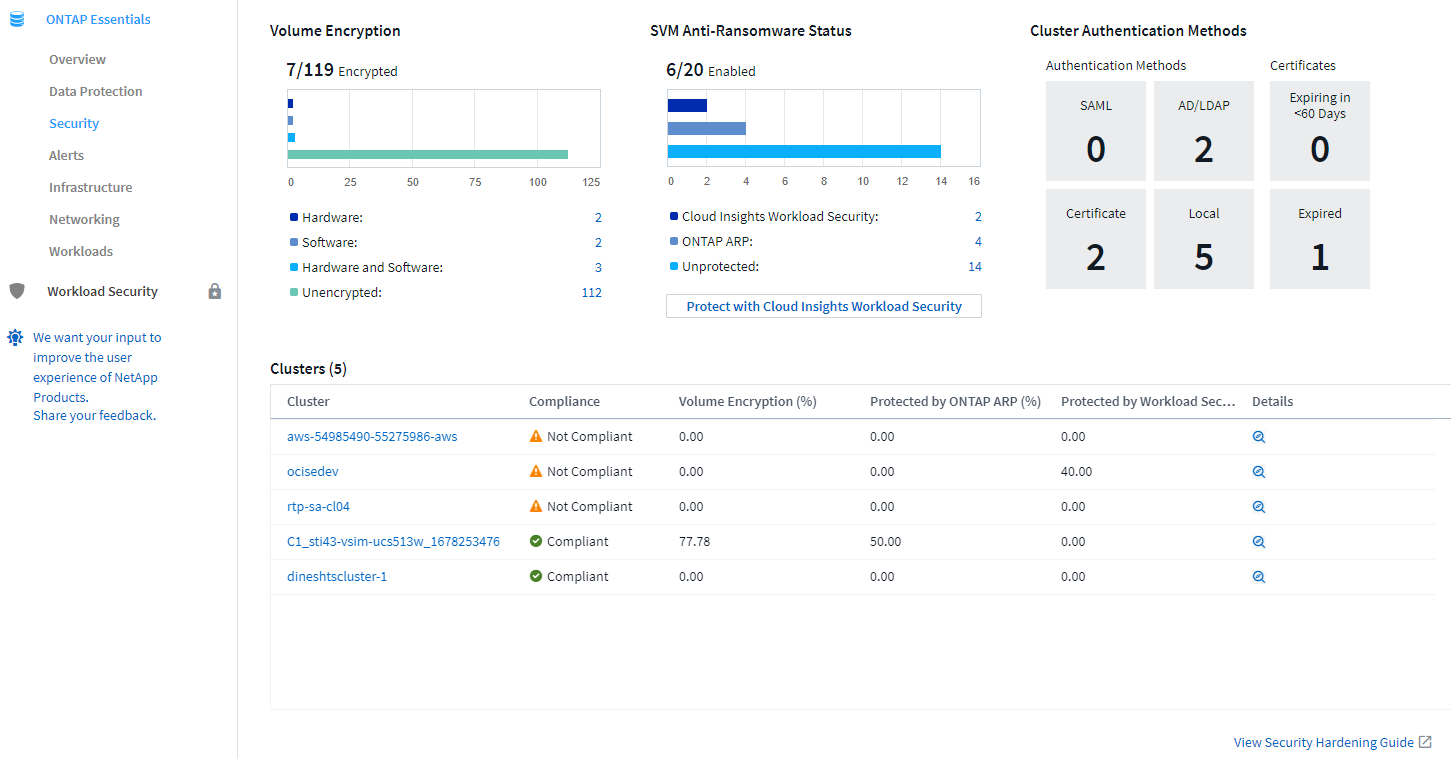
ONTAP Essentials セキュリティダッシュボード
その"セキュリティダッシュボード"ハードウェアとソフトウェアのボリューム暗号化、ランサムウェア対策ステータス、クラスター認証方法のグラフを表示し、現在のセキュリティ状況を即座に確認できます。セキュリティダッシュボードは、"プレビュー"特徴。
ONTAPコールド ストレージの再利用
Reclaim ONTAP Cold Storage Insight は、 ONTAPシステム上のボリュームのコールド容量、潜在的なコスト/電力節約、および推奨されるアクション項目に関するデータを提供します。
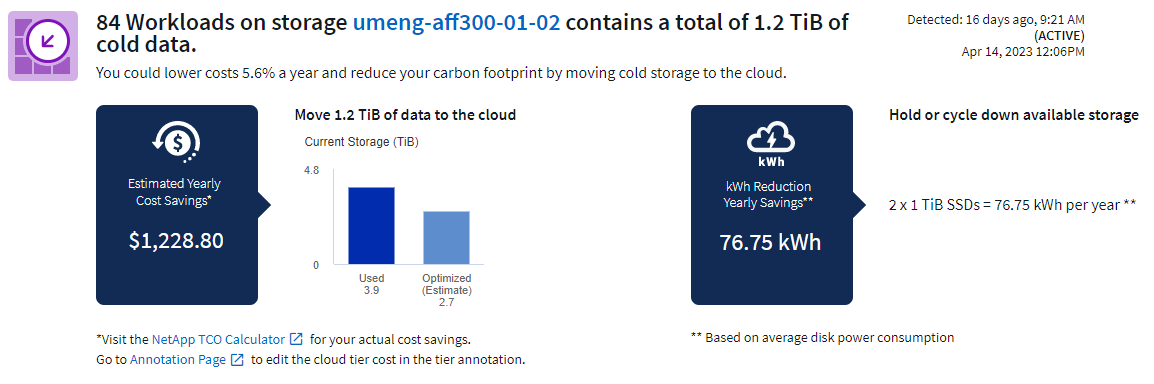
このインサイトを使用すると、次のような質問に答えることができます。
-
ストレージ クラスター上のコールド データのうち、(a) 高価な SSD ディスク、(b) HDD ディスク、(c) 仮想ディスクに保存されているものはどれくらいありますか。
-
最適化されていないストレージに関して、最も大きな影響を与えるワークロードは何ですか?
-
特定のワークロードでデータがコールド状態であった期間 (日数) はどれくらいですか?
Reclaim ONTAP Cold Storage_は、"_プレビュー"機能であるため変更される可能性があります。
サブスクリプション通知はバナーメッセージも制御します
サブスクリプション通知の受信者の設定 (管理 > 通知) では、サブスクリプション関連の製品内バナー通知を誰が見るか制御できるようになりました。

レポートの見た目が新しくなりました
Cloud Insightsレポート画面の外観が新しくなり、メニュー ナビゲーションの一部が変更されていることに気付くでしょう。これらの画面とナビゲーションの変更は、現在更新されています。"報告文書" 。
デフォルトで一時停止するモニター
新しいCloud Insights環境では、次の点に注意してください。"システム定義モニター"デフォルトではアラート通知を送信しません。アラートを受け取りたいモニターに対して、通知を有効にするために、モニターに 1 つ以上の配信方法を追加する必要があります。既存のCloud Insights環境では、現在 一時停止 状態にあるシステム定義モニターのデフォルトの グローバル 通知受信者リストが削除されました。ユーザー定義の通知は変更されず、現在アクティブなシステム定義モニターの通知設定も変更されません。
API メータリング タブをお探しですか?
API メータリングは、サブスクリプション ページから 管理 > API アクセス ページに移動されました。
2023年3月
ONTAP 9.9以降のクラウド接続は廃止されました
ONTAP 9.9+ データ コレクターの Cloud Connection は廃止されます。 2023 年 4 月 4 日以降、環境内の Cloud Connection データ コレクターはデータを収集しなくなり、ポーリング時にエラーが表示されます。 Cloud Connection データ コレクターは、以降のアップデートでCloud Insightsから完全に削除されます。
2023 年 4 月 4 日より前に、現在 Cloud Connection によって収集されているすべてのONTAPシステムに対して、新しいNetApp ONTAP Data Management Software データ コレクターを構成することが必須です。
2023年1月
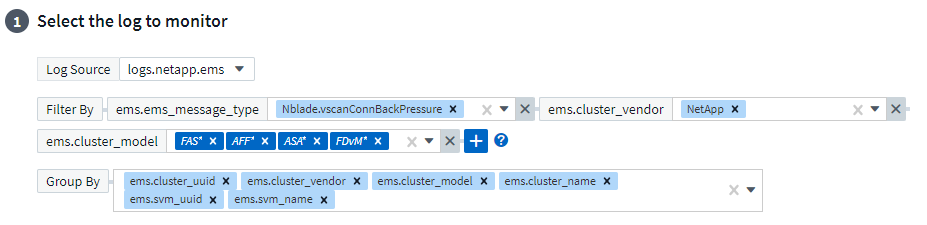
新しいログモニター
20個近く追加しました"追加のシステムモニター"相互接続リンクの破損、ハートビートの問題などを警告します。さらに、 SnapMirror自動再同期、 MetroClusterミラーリング、およびFabricPoolミラー再同期の変更について警告するための 3 つの新しいデータ保護ログ モニターが追加されました。
これらのモニターの一部はデフォルトで 有効 になっていることに注意してください。アラートを生成したくない場合は、それらを 一時停止 する必要があります。また、これらのモニターは通知を配信するように構成されていないことに注意してください。電子メールまたは Webhook 経由でアラートを送信する場合は、これらのモニターで通知の受信者を構成する必要があります。
すべてのダッシュボード テーブル ウィジェットの .CSV エクスポート
データへのアクセス性を確保することは重要であるため、クエリするデータのタイプ (アセットまたは統合) に関係なく、すべてのメトリック クエリ、ダッシュボード テーブル ウィジェット、およびオブジェクト ランディング ページで .CSV エクスポートを利用できるようにしました。
列の選択、列名の変更、単位の変換などのデータのカスタマイズも、新しいエクスポート機能に含まれるようになりました。
2022年12月
Cloud Insightsトライアルでランサムウェア保護やその他のセキュリティ機能をご確認ください
本日より、 Cloud Insightsの新しいトライアルにサインアップすると、ランサムウェアの検出や自動ユーザー ブロック応答ポリシーなどのセキュリティ機能を試すことができます。トライアルにまだ登録していない場合は、今すぐ登録してください。
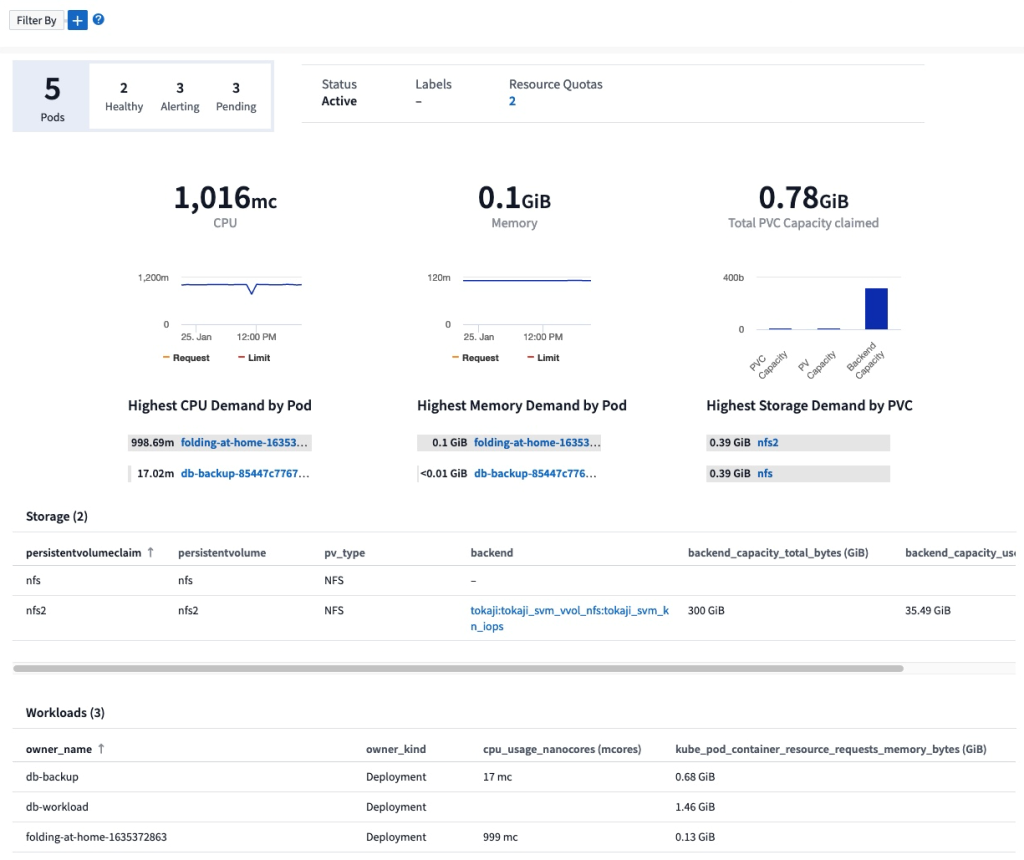
Kubernetesワークロードには独自のランディングページがあります
ワークロードは Kubernetes 環境の重要な部分であるため、 Cloud Insightsではそれらのワークロードのランディング ページが提供されるようになりました。ここから、Kubernetes ワークロードに影響する問題を表示、調査、トラブルシューティングできます。
チェックサムを確認する
Windows および Linux 用エージェントのインストール中にチェックサム値を提供するようご要望がありましたが、これは素晴らしいアイデアだと思いました。それで、ここにあります:
ログアラートの改善
グループ化
ログ モニターを作成または編集するときに、「グループ化」属性を設定して、より焦点を絞ったアラートを生成できるようになりました。モニター定義の「フィルター」設定の下にある「グループ化」属性を探します。
この変更により、モニター定義の「グループ化」の側面が正規化され、メトリック モニターとログ モニターの機能が同等になります。このパリティにより、顧客はシステム定義のデフォルト モニターをすべて複製/複製して、さらにカスタマイズできるようになります。
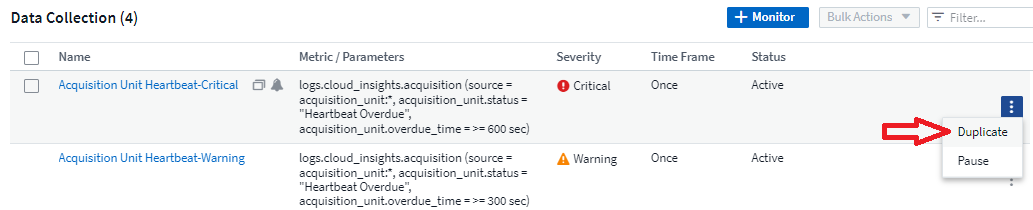
複製
変更ログ、Kubernetes ログ、およびデータ コレクター ログ モニターを複製 (クローン) できるようになりました。これにより、特定の定義に合わせて変更できる新しいカスタム ログ モニターが作成されます。
ビジネス継続性のためのSnapMirrorをカバーする11の新しいデフォルトのONTAPモニター
12個近くの新しい"システムモニター"SnapMirror for Business Continuity (SMBC) の場合、SMBC 証明書とONTAP Mediator の変更について警告します。
2022年11月
40 を超える新しいセキュリティ、データ収集、CVO モニター!
Cloud Volumes、セキュリティ、データ保護に関する潜在的な問題を警告するために、数十の新しいシステム定義モニターを追加しました。これらのモニターについてもっと読む"ここをクリックしてください。"。
2022年10月
ONTAP Autonomous Ransomware Protection の統合により、より優れた正確なランサムウェア検出を実現
Cloud SecureはONTAPとの統合によりランサムウェア検出を向上"自律型ランサムウェア対策"(ARP)。
Cloud Secureは、潜在的なボリュームファイル暗号化アクティビティに関するONTAP ARPイベントを受信し、
-
ボリューム暗号化イベントとユーザーアクティビティを相関させて、誰が損害を引き起こしたかを特定します。
-
攻撃をブロックするための自動応答ポリシーを実装します。
-
影響を受けたファイルを特定し、より迅速な復旧とデータ侵害調査の実施に役立ちます。
2022年9月
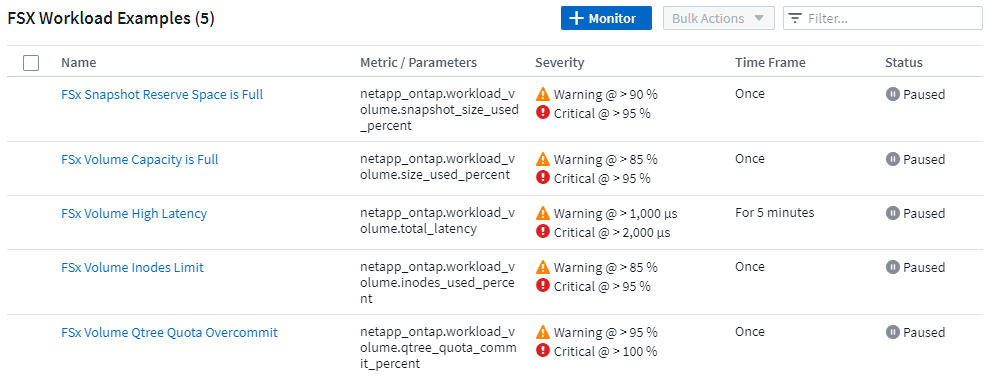
ベーシックエディションで利用可能なモニター
ONTAP"デフォルトのモニター"Cloud Insights Basic Edition で使用できるようになりました。これには、70 を超えるインフラストラクチャ モニターと 30 のワークロード例が含まれます。
ONTAP PowerとStorageGRIDダッシュボード
ダッシュボード ギャラリーには、 ONTAP電力と温度の新しいダッシュボードと、 StorageGRIDの 4 つのダッシュボードが含まれています。環境でONTAP電力メトリックやStorageGRIDデータを収集している場合は、+ギャラリーから を選択してこれらのダッシュボードをインポートします。
表で一目でわかるしきい値の可視性
条件付き書式を使用すると、テーブル ウィジェットで警告レベルと重大レベルのしきい値を設定して強調表示できるため、外れ値や例外的なデータ ポイントを即座に表示できます。
セキュリティモニター
Cloud Insights は、 ONTAPシステムで FIPS モードが無効になっていることを検出すると、警告を発することができます。詳細はこちら"システムモニター"、また、近日中にさらに多くのセキュリティ モニターが登場する予定ですので、このページをご覧ください。
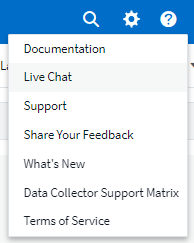
どこからでもチャット
新しい ヘルプ > ライブ チャット リンクを選択すると、任意のCloud Insights画面からNetAppサポート スペシャリストとチャットできます。ヘルプは画面右上の「?」アイコンからご利用いただけます。
より目に見えるインサイト
お使いの環境で"Insight"Shared resources Under Stress や Kubernetes Namespaces Running Out of Space など、影響を受けるリソースのアセット ランディング ページに Insight 自体へのリンクが含まれるようになり、より迅速な調査とトラブルシューティングが可能になります。
新しいデータ収集者
-
Amazon S3 (プレビュー版で利用可能)
-
BrocadeFOS 9.0.x
-
Dell/EMC PowerStore 3.0.0.0
その他のデータコレクターの更新
すべてのデータ ソースは、取得ユニットの更新やパッチの適用後にパフォーマンス ポーリングを再開するように最適化されるようになりました。
オペレーティングシステムのサポート
Cloud Insights Acquisition Unitsでは、以下のオペレーティングシステムがサポートされています。"すでにサポートされています" :
-
Red Hat Enterprise Linux 8.5、8.6
2022年8月
Cloud Insights の外観が新しくなりました。
今月より、「監視と最適化」は Observability に名前が変更されました。ダッシュボード、クエリ、アラート、レポートなどのお気に入りの機能はすべてここにあります。さらに、新しい セキュリティ メニューの下にあるCloud Secureを探してください。メニューのみが変更され、機能は同じままであることに注意してください。
ヘルプ メニューをお探しですか?
ヘルプは画面の右上に表示されるようになりました。
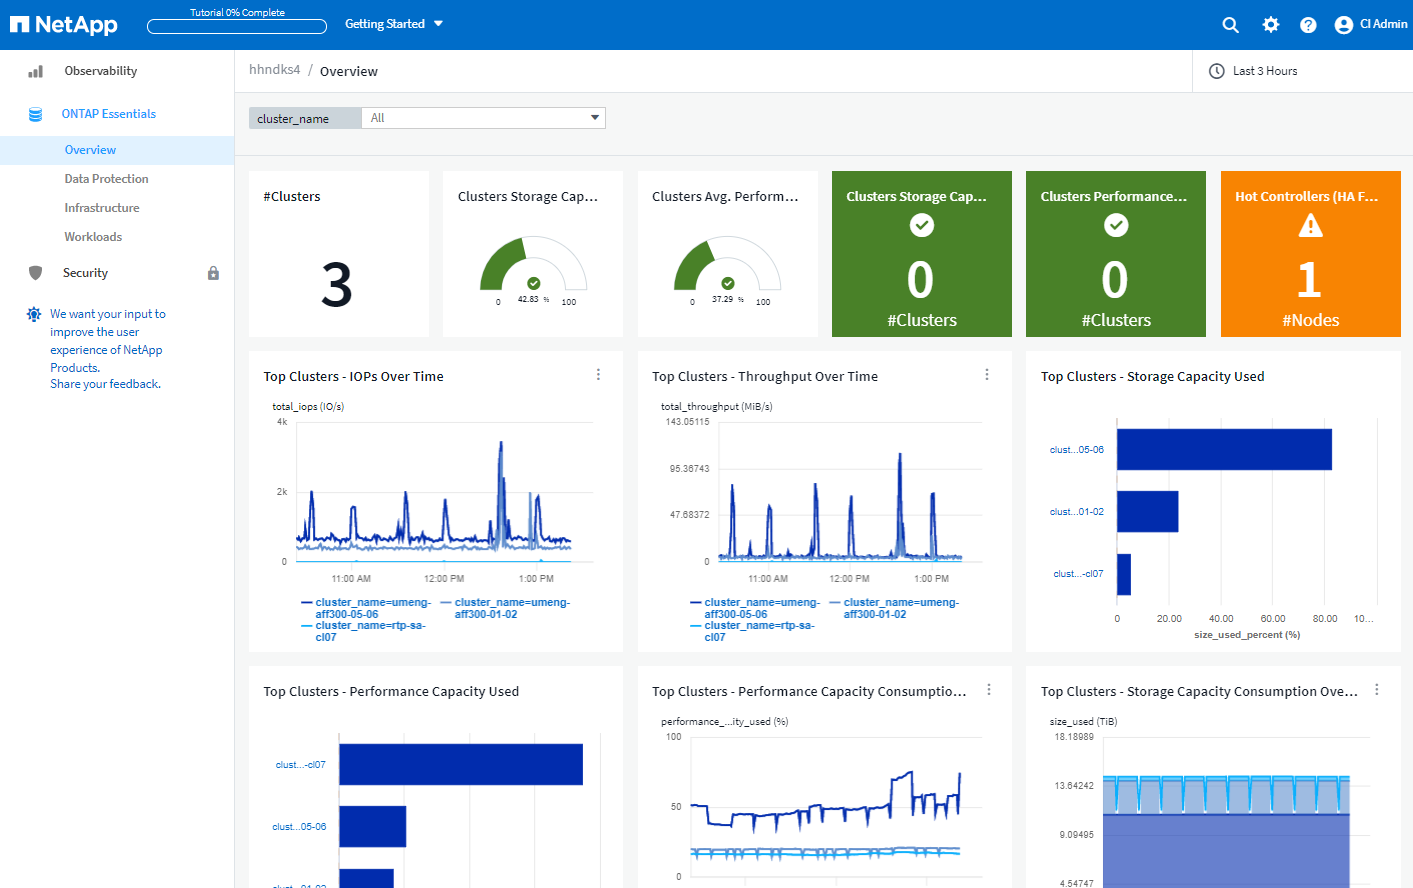
処理を開始するには、ONTAP Essentials をチェックしてください!
"* ONTAPエッセンシャル*"は、 NetApp ONTAPインベントリ、ワークロード、データ保護の詳細なビューを提供するダッシュボードとワークフローのセットです。これには、ストレージ容量とパフォーマンスの完全使用までの日数予測も含まれます。高い使用率で実行されているコントローラーがあるかどうかを確認することもできます。 ONTAP Essentials は、 NetApp ONTAP の監視のあらゆるニーズに最適な場所です。
すべてのエディションで利用可能なONTAP Essentials は、既存のONTAPオペレータと管理者にとって直感的に使用できるように設計されており、ActiveIQ Unified Manager からサービスベースの管理ツールへの移行を容易にします。
ストレージデータファミリーが統合される
あなたがそれを要求し、今それを手に入れました。ストレージの 2 進数と 10 進数のデータ単位が、ビットやバイトからテビビットやテラバイトまで 1 つのファミリに統合され、ダッシュボードにデータを好みの方法で表示しやすくなりました。データ レートも今では独自の 1 つの大きなファミリーになっています。
ストレージはどれくらいの電力を消費していますか?
netapp_ontap.storage_shelf、netapp_ontap.system_node、および netapp_ontap.cluster (電力消費のみ) メトリックを使用して、 ONTAPストレージ シェルフとノードの電力消費、温度、およびファン速度を表示および監視します。
プレビューから卒業した機能
以下の機能はプレビューから移行され、すべてのお客様が利用できるようになりました。
特徴 |
説明 |
Kubernetes 名前空間のスペース不足 |
Kubernetes 名前空間のスペース不足 インサイトでは、スペース不足になるリスクがある Kubernetes 名前空間のワークロードが表示され、各スペースがいっぱいになるまでの残り日数の見積もりも表示されます。"続きを読む" |
ストレス下の共有リソース |
Shared Resource Under Stress の分析情報は、AI/ML を使用して、環境内でリソースの競合がパフォーマンスの低下を引き起こしている場所を自動的に特定し、影響を受けるワークロードを強調表示して、修復するための推奨アクションを提供することで、パフォーマンスの問題をより迅速に解決できるようにします。"続きを読む" |
Cloud Secure– 攻撃時にユーザーアクセスをブロック |
攻撃が検出されるとユーザー アクセスをブロックする機能により、ビジネスに不可欠なデータをより強力に保護します。アクセスは、自動応答ポリシーを使用して自動的にブロックすることも、アラートまたはユーザーの詳細ページから手動でブロックすることもできます。"続きを読む" |
データ収集の健全性はどうですか?
Cloud Insightsには、Acquisition Unit 用の 2 つの新しいハートビート モニターと、データ コレクターの障害を警告する 2 つのモニターが用意されています。これらを使用すると、データ収集に関する問題を迅速に警告することができます。
Data Collection モニター グループでは、次のモニターが利用できるようになりました。
-
取得ユニットハートビートクリティカル
-
取得ユニットハートビート警告
-
コレクターが失敗しました
-
コレクターの警告
これらのモニターは、デフォルトでは 一時停止 状態になっていることに注意してください。これらを有効にすると、データ収集の問題について警告が表示されます。
自動更新APIトークン
API アクセス トークンを自動更新に設定できるようになりました。この機能を有効にすると、期限切れのトークンに対して新しい/更新された API アクセス トークンが自動的に生成されます。期限切れのトークンを使用しているCloud Insightsエージェントは、対応する新規または更新された API アクセス トークンを使用するように自動的に更新され、シームレスに動作し続けることができます。トークンを作成するときに、「トークンを自動的に更新する」ボックスをチェックするだけです。この機能は現在、最新のNetApp Kubernetes Monitoring Operator を搭載した Kubernetes プラットフォーム上で実行されているCloud Insightsエージェントでサポートされています。
ベーシックエディションでは、これまで以上の機能が提供されます
試用期間が終了していますが、サブスクリプションが適切かどうかまだわかりませんか? Basic Edition では、現在のONTAPデータ コレクターでCloud Insightsを引き続き使用できるようになっていますが、VMWare バージョン、トポロジ、IOPS/スループット/レイテンシ データも引き続きキャプチャできるようになりました。ストレージ システムのプレミアム サポートを受けているNetApp のお客様は、 Cloud Insightsのサポートも受けられます。
さらに詳しく知りたいですか?
NetApp University Cloud Insightsコースへのリンクについては、[ヘルプ] > [サポート] ページの ラーニング センター セクションをご覧ください。
オペレーティングシステムのサポート
Cloud Insights Acquisition Unitsでは、以下のオペレーティングシステムがサポートされています。"すでにサポートされています" :
-
Windows Server 11
2022年6月
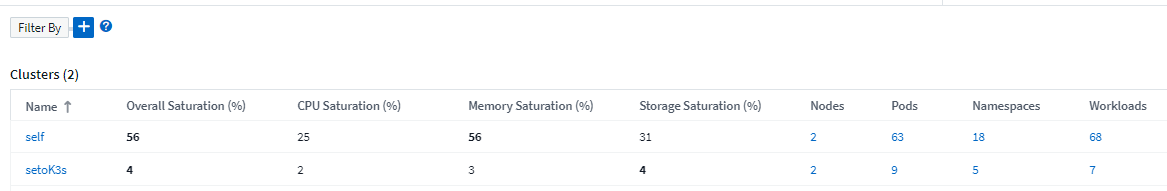
Kubernetes クラスターの飽和状態とその他の詳細
Cloud Insights、飽和度の詳細と、名前空間とワークロードのより明確なビューを提供する改善されたクラスター詳細ページにより、Kubernetes 環境の探索がこれまで以上に簡単になります。
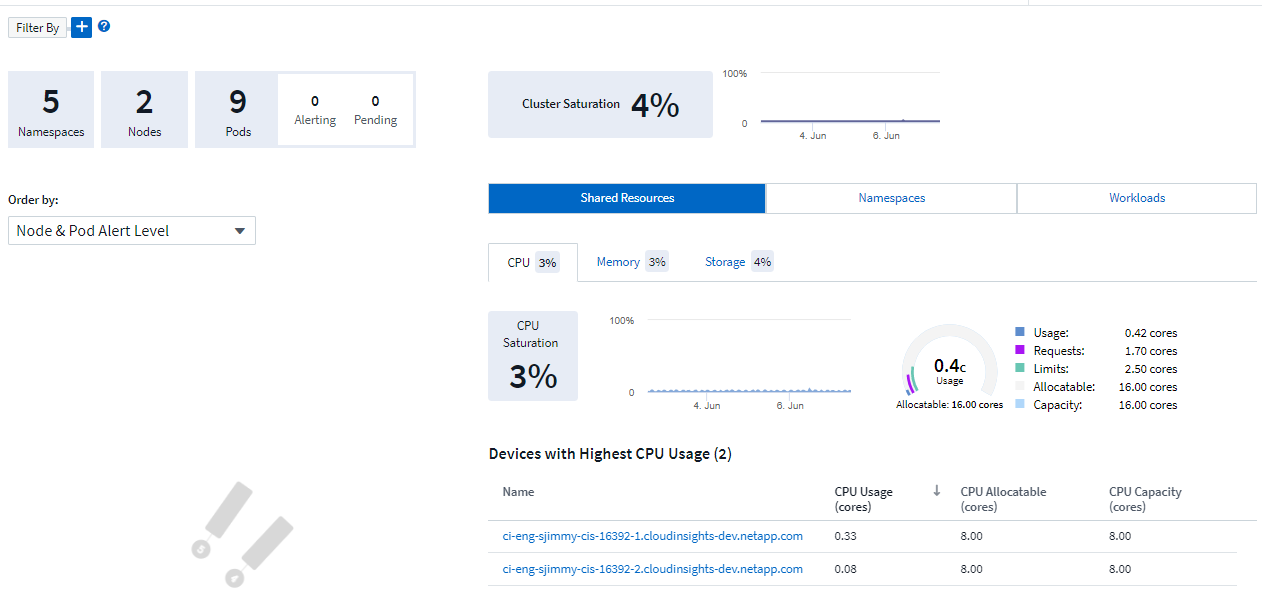
クラスター リスト ページでは、ノード、ポッド、名前空間、ワークロードの数に加えて、飽和状態も簡単に確認できます。
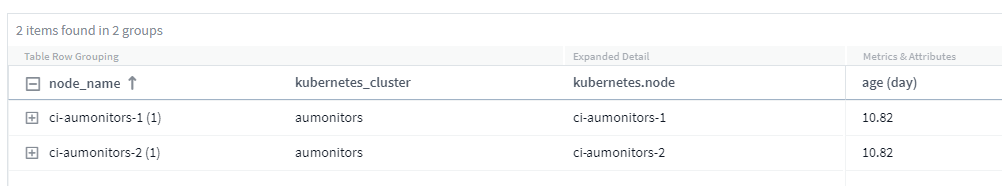
あなたの Kubernetes クラスターは何年経っていますか?
あなたのクラスターは世界に登場したばかりですか、それとも長いデジタルライフを経験してきましたか? Kubernetes ノードで収集される時間メトリックとして Age が追加されました。
容量満杯までの時間予測
Cloud Insights は、監視対象の内部ボリュームごとに容量がなくなるまでの日数を予測するダッシュボードを提供します。これらの値は、停止のリスクを大幅に軽減するのに役立ちます。
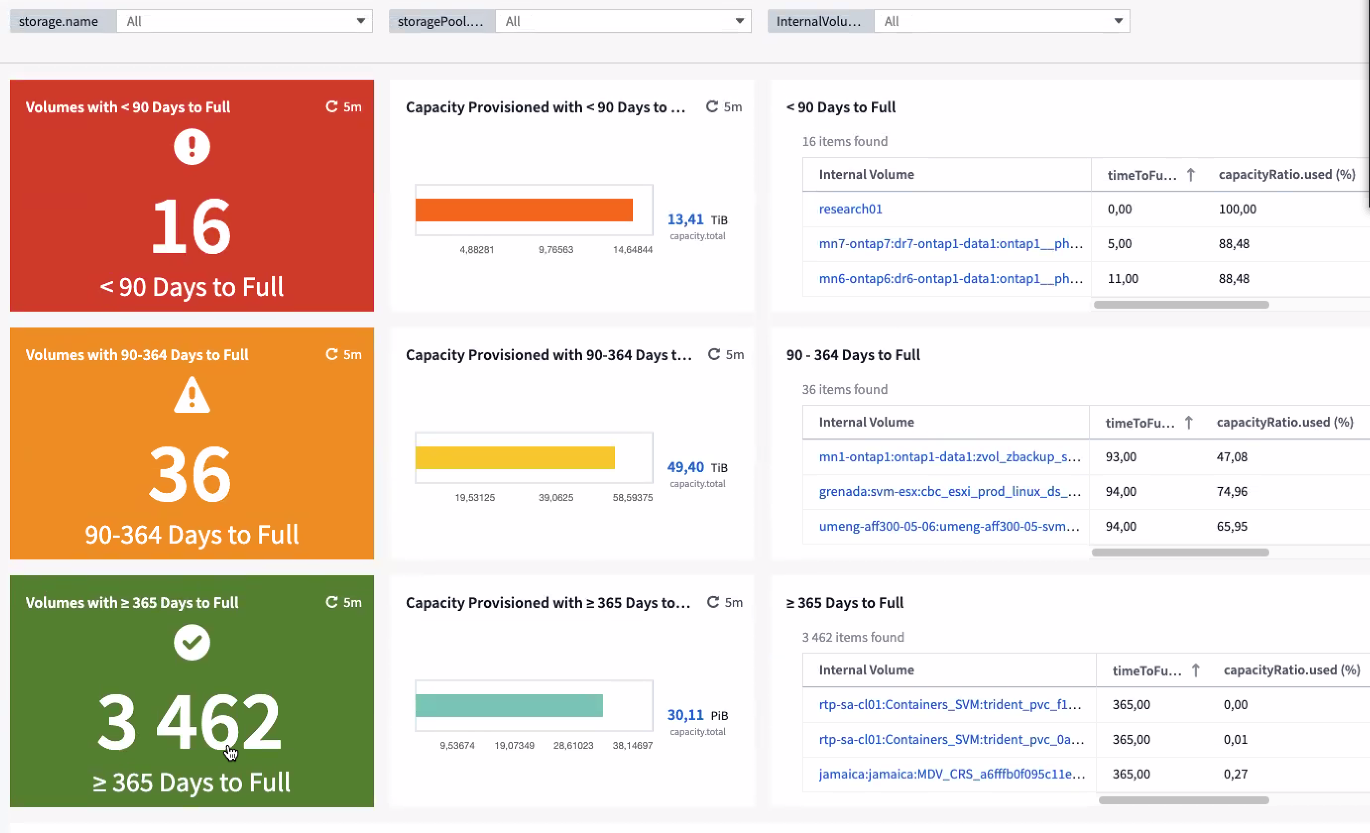
TTF カウンターは、ストレージ、ストレージ プール、ボリュームでも使用できます。これらのオブジェクトの追加ダッシュボードについては、このページを引き続きご覧ください。
なお、Time-to-Full 予測はプレビュー段階から移行し、すべての顧客に展開される予定です。
私の環境で何が変わったのでしょうか?
ONTAP変更ログ エントリは、ログ エクスプローラーで表示できます。
オペレーティングシステムのサポート
Cloud Insights Acquisition Unitsでは、以下のオペレーティングシステムがサポートされています。"すでにサポートされています" :
-
CentOS ストリーム 9
-
Windows Server 2022
更新されたTelegrafエージェント
Telegraf 統合データを取り込むエージェントがバージョン 1.22.3 に更新され、パフォーマンスとセキュリティが向上しました。アップデートを希望するユーザーは、"エージェントのインストール"ドキュメント。エージェントの以前のバージョンは、ユーザーの操作を必要とせずに引き続き機能します。
プレビュー機能
Cloud Insights、数多くの新しい魅力的なプレビュー機能を定期的に紹介しています。これらの機能の1つ以上をプレビューすることにご興味がある場合は、"NetAppセールスチーム"詳細についてはこちらをご覧ください。
特徴 |
説明 |
Kubernetes 名前空間のスペース不足 |
Kubernetes 名前空間のスペース不足 インサイトでは、スペース不足になるリスクがある Kubernetes 名前空間のワークロードが表示され、各スペースがいっぱいになるまでの残り日数の見積もりも表示されます。"続きを読む" |
Cloud Secure– 攻撃時にユーザーアクセスをブロック |
攻撃が検出されるとユーザー アクセスをブロックする機能により、ビジネスに不可欠なデータをより強力に保護します。アクセスは、自動応答ポリシーを使用して自動的にブロックすることも、アラートまたはユーザーの詳細ページから手動でブロックすることもできます。"続きを読む" |
ストレス下の共有リソース |
Shared Resource Under Stress の分析情報は、AI/ML を使用して、環境内でリソースの競合がパフォーマンスの低下を引き起こしている場所を自動的に特定し、影響を受けるワークロードを強調表示して、修復するための推奨アクションを提供することで、パフォーマンスの問題をより迅速に解決できるようにします。"続きを読む" |
2022年5月
NetAppサポートとライブチャット
NetAppサポート担当者とライブチャットできるようになりました。 「ヘルプ > サポート」ページで、チャット アイコンをクリックするか、「お問い合わせ」セクションの「チャット」をクリックして、チャット セッションを開始します。チャット サポートは、Standard Edition および Premium Edition ユーザー向けに米国の平日にご利用いただけます。

Kubernetesオペレーター
Cloud Insightsの高度な Kubernetes モニタリングとクラスター エクスプローラーを使用すると、簡単に起動して実行できるようになります。
その"Kubernetes モニタリング オペレーター"(NKMO) は、 Cloud Insights Insights に Kubernetes をインストールするための推奨される方法です。これにより、より少ない手順でより柔軟に監視を構成できるようになり、K8s クラスターで実行されている他のソフトウェアを監視する機会も広がります。
詳細情報と前提条件については、上記のリンクをクリックしてください。
APIを使用してユーザーと招待を管理する
Cloud Insightsの強力な API を使用して、ユーザーと招待を管理できるようになりました。詳しくは"API Swaggerドキュメント"。
データ収集アラート
コレクターの失敗により重要なメトリックを見逃さないでください。
新しい機能により、データ収集者の追跡がこれまで以上に簡単になりました。"アラート"データコレクターおよび取得ユニットの障害の場合。これらのモニターはデフォルトでは一時停止されていることに注意してください。有効にするには、モニターページに移動し、「取得ユニットのシャットダウン」と「コレクターの失敗」を見つけて再開します。
ONTAPストレージの変更に関するアラート
予期しないストレージの変更によって停止が発生しないようにしてください。
ONTAPシステムで FlexVol、ノード、SVM の変更または削除が検出されたときにアラートを出すようにCloud Insightsを設定できるようになりました。
プレビュー機能
Cloud Insights、数多くの新しい魅力的なプレビュー機能を定期的に紹介しています。これらの機能の1つ以上をプレビューすることにご興味がある場合は、"NetAppセールスチーム"詳細についてはこちらをご覧ください。
特徴 |
説明 |
Kubernetes 名前空間のスペース不足 |
Kubernetes 名前空間のスペース不足 インサイトでは、スペース不足になるリスクがある Kubernetes 名前空間のワークロードが表示され、各スペースがいっぱいになるまでの残り日数の見積もりも表示されます。"続きを読む" |
内部ボリュームとボリューム容量の満杯までの時間の予測 |
Cloud Insights は、監視対象の内部ボリュームとボリュームごとに、容量が不足するまでの日数を予測できます。この値は、停止のリスクを大幅に軽減するのに役立ちます。 |
Cloud Secure– 攻撃時にユーザーアクセスをブロック |
攻撃が検出されるとユーザー アクセスをブロックする機能により、ビジネスに不可欠なデータをより強力に保護します。アクセスは、自動応答ポリシーを使用して自動的にブロックすることも、アラートまたはユーザーの詳細ページから手動でブロックすることもできます。"続きを読む" |
ストレス下の共有リソース |
Shared Resource Under Stress の分析情報は、AI/ML を使用して、環境内でリソースの競合がパフォーマンスの低下を引き起こしている場所を自動的に特定し、影響を受けるワークロードを強調表示して、修復するための推奨アクションを提供することで、パフォーマンスの問題をより迅速に解決できるようにします。"続きを読む" |
2022年4月
フィードバックを共有してください!
皆様のご意見をCloud Insightsの形成に役立てていただきたいと考えています。 NetApp の Insights to Action プログラムに参加してポイントと賞品を獲得しましょう。"今すぐ登録" !
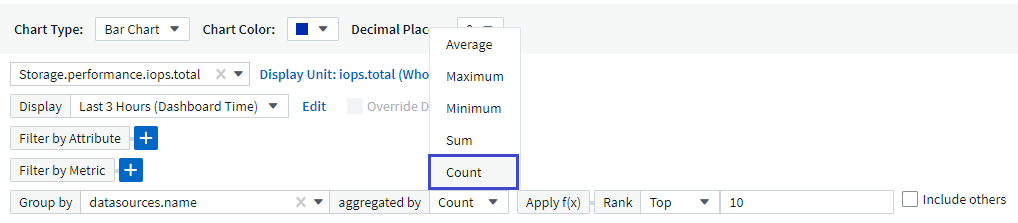
ダッシュボードエディターの更新
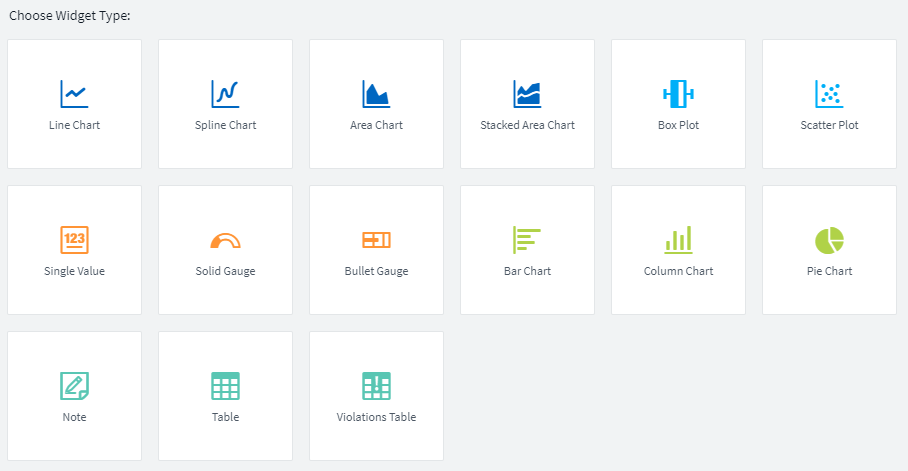
ダッシュボード作成ツールを全面的に改良し、データをさらに素早く簡単に視覚化できるようになりました。 Cloud Insightsの「ダッシュボード」ページに移動して、既存のダッシュボードを編集したり、ダッシュボード ギャラリーからダッシュボードを追加したり、独自の新しいダッシュボードを作成して確認したりすることができます。
新しい Count 集計方法も導入されました。棒グラフ、縦棒グラフ、円グラフのウィジェットでデータをグループ化すると、選択したメトリックに関連するオブジェクトの数をすばやく簡単に表示できます。
さらに、折れ線グラフでは3つのタイプから1つを選択できるようになりました。"補間"方法:
-
なし - 補間は行われません
-
線形 - 既存のポイント間のデータポイントを補間します
-
階段 - 前のデータポイントを補間データポイントとして使用します
Kubernetes インフラストラクチャの強化された監視
Cloud Insights は、ポッド、デーモンセット、レプリカセットが作成または削除されたときや、新しいデプロイメントが作成されたときにアラートを通知することで、Kubernetes 環境の変更を常に把握できるようにします。 Kubernetes モニターはデフォルトで 一時停止 状態になっているため、必要なモニターのみを有効にする必要があります。
プレビュー機能
Cloud Insights、数多くの新しい魅力的なプレビュー機能を定期的に紹介しています。これらの機能の1つ以上をプレビューすることにご興味がある場合は、"NetAppセールスチーム"詳細についてはこちらをご覧ください。
特徴 |
説明 |
内部ボリュームとボリューム容量の満杯までの時間の予測 |
Cloud Insights は、監視対象の内部ボリュームとボリュームごとに、容量が不足するまでの日数を予測できます。この値は、停止のリスクを大幅に軽減するのに役立ちます。 |
Cloud Secure– 攻撃時にユーザーアクセスをブロック |
攻撃が検出されるとユーザー アクセスをブロックする機能により、ビジネスに不可欠なデータをより強力に保護します。アクセスは、自動応答ポリシーを使用して自動的にブロックすることも、アラートまたはユーザーの詳細ページから手動でブロックすることもできます。"続きを読む" |
ストレス下の共有リソース |
ストレス下にある共有リソースの分析情報は、AI/ML を使用して、環境内でリソースの競合がパフォーマンスの低下を引き起こしている場所を自動的に特定し、影響を受けるワークロードを強調表示し、修復するための推奨アクションを提供することで、パフォーマンスの問題をより迅速に解決できるようにします。"続きを読む" |
新しいデータ収集者
-
Cohesity SmartFiles - この REST API ベースのコレクターは、Cohesity クラスターを取得し、「ビュー」(CI 内部ボリュームとして) やさまざまなノードを検出し、パフォーマンス メトリックを収集します。
その他のデータコレクターの更新
次のデータ コレクターでパフォーマンス データの収集と表示が改善されました。
-
Brocade CLI
-
Dell/EMC VPlex、PowerStore、Isilon/PowerScale、VNX Block/Clariion CLI、XtremIO、Unity/VNXe
-
ピュアフラッシュアレイ
これらのパフォーマンス強化は、すべてのNetAppデータ コレクター、VMware、 Ciscoですでに利用可能であり、今後数か月以内に他のすべてのデータ コレクターにも展開される予定です。
2022年3月
ONTAP 9.9以降のクラウド接続
その"ONTAP 9.9以降向けNetAppクラウド接続"データ コレクターを使用すると、外部の取得ユニットをインストールする必要がなくなり、トラブルシューティング、メンテナンス、初期導入が簡素化されます。
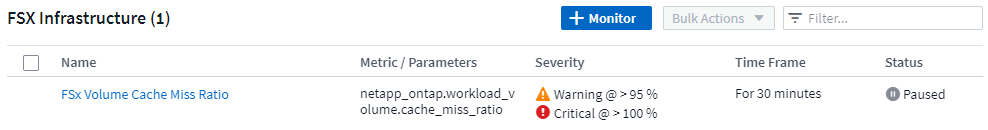
NetApp ONTAPモニター用の新しい FSx
FSx for NetApp ONTAP環境の監視は、新しい"システム定義モニター"インフラストラクチャ (メトリック) とワークロード (ログ) の両方に対して。
すべてのユーザーが利用できる新しいCloud Secure機能
現在一般提供されている以下のCloud Secure機能により、環境はこれまで以上に安全になります。
特徴 |
説明 |
データ破壊 – ファイル削除攻撃の検出 |
異常な大規模なファイル削除アクティビティを検出し、悪意のあるユーザーによる悪意のあるファイルアクセスをブロックし、自動応答ポリシーを使用して自動スナップショットを取得します。 |
警告とアラートの個別の通知 |
警告とアラートの通知を別々の受信者に送信できるため、適切なチームが常に情報を得ることができます。 |
更新されたTelegrafエージェント
Telegraf 統合データを取り込むエージェントがバージョン 1.21.2 に更新され、パフォーマンスとセキュリティが向上しました。アップデートを希望するユーザーは、"エージェントのインストール"ドキュメント。エージェントの以前のバージョンは、ユーザーの操作を必要とせずに引き続き機能します。
データコレクターの更新
-
Broadcom ファイバー チャネル スイッチ データ コレクターは、各インベントリ ポーリングで発行される CLI コマンドの数を削減するように最適化されました。
2022年2月
Cloud Insights がApache Log4j の脆弱性に対処
顧客のセキュリティはNetAppにとって最優先事項です。 Cloud Insightsには、最近の Apache Log4j の脆弱性を解決するためのソフトウェア ライブラリの更新が含まれています。
NetApp の製品セキュリティ アドバイザリ Web サイトで以下を参照してください。
これらの脆弱性とNetAppの対応の詳細については、"NetAppニュースルーム" 。
Kubernetes 名前空間の詳細ページ
クラスターの名前空間の詳細な情報ページが表示されるようになり、Kubernetes 環境の探索がこれまで以上に簡単になりました。名前空間の詳細ページには、すべてのバックエンド ストレージ リソースとその容量使用率など、名前空間で使用されるすべてのアセットの概要が表示されます。
2021年12月
ONTAPシステムとのより緊密な統合
NetAppイベント管理システム (EMS) との新しい統合により、 ONTAPハードウェア障害などのアラートが簡素化されます。"探索と警告" Cloud Insightsの低レベルのONTAPメッセージに基づいて、トラブルシューティング ワークフローを通知および改善し、 ONTAP要素管理ツールへの依存をさらに軽減します。
データコレクターレベルの通知。
アラート用のシステム定義およびカスタム作成されたモニターに加えて、 ONTAPデータ コレクターのアラート通知を設定することもできます。これにより、他のモニター アラートとは独立して、コレクター レベルのアラートの受信者を指定できます。
Cloud Secure の役割の柔軟性の向上
ユーザーは、以下の基準に基づいてCloud Secure機能へのアクセスを許可されます。"ロール"管理者によって設定:
ロール |
Cloud Secureアクセス |
管理者 |
アラート、フォレンジック、データ コレクター、自動応答ポリシー、 Cloud Secureの API など、すべてのCloud Secure機能を実行できます。管理者は他のユーザーを招待することもできますが、割り当てることができるのはCloud Secureロールのみです。 |
ユーザ |
アラートを表示および管理し、フォレンジックを表示できます。ユーザー ロールでは、アラートのステータスを変更したり、メモを追加したり、スナップショットを手動で取得したり、ユーザー アクセスをブロックしたりできます。 |
ゲスト |
アラートとフォレンジックを表示できます。ゲスト ロールでは、アラート ステータスを変更したり、メモを追加したり、スナップショットを手動で取得したり、ユーザー アクセスをブロックしたりすることはできません。 |
オペレーティングシステムのサポート
CentOS 8.x のサポートは、CentOS 8 Stream サポートに置き換えられます。 CentOS 8.x は 2021 年 12 月 31 日にサポートが終了します。
データコレクターの更新
ベンダーの変更を反映するために、いくつかのCloud Insightsデータ コレクター名が追加されました。
ベンダー/モデル |
以前の名前 |
Dell EMC パワースケール |
Isilon |
HPE アレトラ 9000 / プリメーラ |
3PAR |
HPE アレトラ 6000 |
機敏な |
2021年11月
適応型ダッシュボード
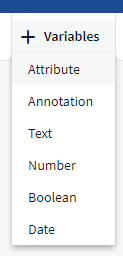
属性用の新しい変数とウィジェットで変数を使用する機能。
ダッシュボードはこれまで以上に強力かつ柔軟になりました。属性変数を使用して適応型ダッシュボードを構築し、ダッシュボードを即座にフィルター処理します。これらと既存の"変数"環境全体のメトリックを表示し、リソース名、タイプ、場所などでシームレスにフィルタリングできる 1 つの高レベルダッシュボードを作成できるようになりました。ウィジェット内の数値変数を使用して、生のメトリックとコストを関連付けます (例: サービスとしてのストレージの 1 GB あたりのコスト)。
API経由でレポートデータベースにアクセスする
サードパーティのレポート、ITSM、自動化ツールとの統合のための強化された機能: Cloud Insightsの強力な"API"ユーザーは、Cognos レポート環境を経由せずに、 Cloud Insightsレポート データベースを直接クエリできます。
VM ランディング ページのポッド テーブル
VM とそれを使用する Kubernetes Pod 間のシームレスなナビゲーション: トラブルシューティングとパフォーマンスのヘッドルーム管理を改善するために、関連付けられている Kubernetes Pod のテーブルが VM ランディング ページに表示されるようになりました。
データコレクターの更新
-
ECSはストレージとノードのファームウェアを報告するようになりました
-
Isilonは迅速な検出を改善しました
-
Azure NetApp Files はパフォーマンスデータをより迅速に収集します
-
StorageGRID はシングル サインオン (SSO) をサポートするようになりました
-
Brocade CLI は X&-4 のモデルを適切に報告します
サポートされている追加のオペレーティングシステム
Cloud Insights Acquisition Unit は、既にサポートされているオペレーティング システムに加えて、次のオペレーティング システムもサポートしています。
-
Centos (64ビット) 8.4
-
Oracle Enterprise Linux (64 ビット) 8.4
-
Red Hat Enterprise Linux (64 ビット) 8.4
2021年10月
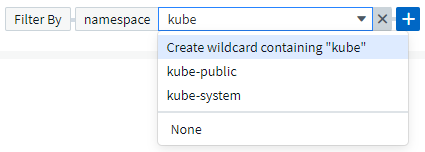
K8Sエクスプローラーページのフィルター
"Kubernetes エクスプローラー"ページ フィルターを使用すると、Kubernetes クラスター、ノード、ポッドの探索用に表示されるデータを集中的に制御できます。
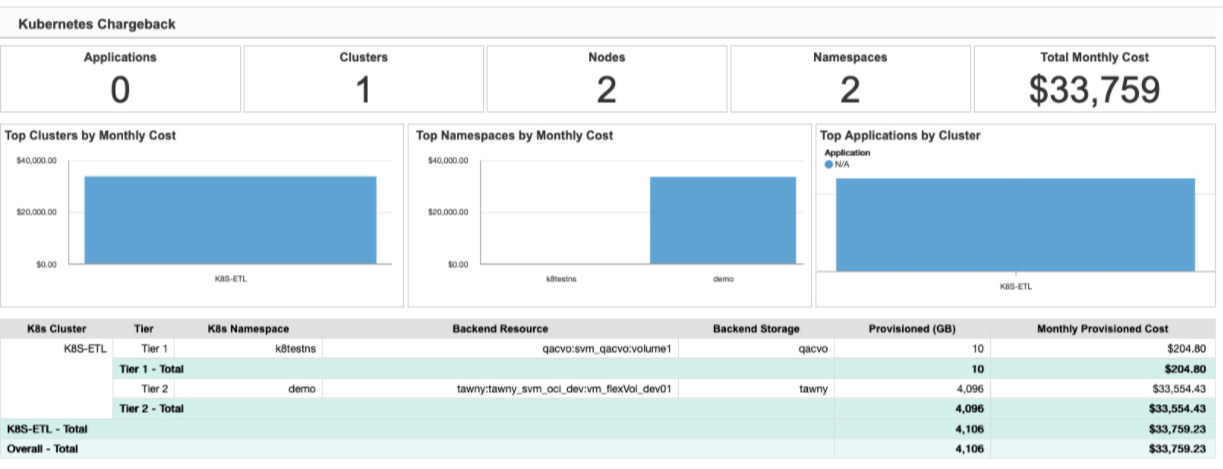
レポート用K8sデータ
Kubernetes データがレポートで使用できるようになり、チャージバックやその他のレポートを作成できるようになりました。 Kubernetes チャージバック データをレポートに渡すには、Kubernetes クラスターとそのバックエンド ストレージへのアクティブな接続があり、 Cloud Insights がそこからデータを受信している必要があります。バックエンド ストレージからデータが受信されない場合、 Cloud Insights はKubernetes オブジェクト データを Reporting に送信できません。
ダークテーマが登場
多くの方からダーク テーマの要望がありましたが、 Cloud Insights がそれに応えました。明るいテーマと暗いテーマを切り替えるには、ユーザー名の横にあるドロップダウンをクリックします。
データコレクターのサポート
Cloud Insightsデータ コレクターにいくつかの改善を加えました。以下にハイライトをいくつか紹介します。
-
Amazon FSx for ONTAPの新しいコレクター
2021年9月
パフォーマンスポリシーがモニターになりました
Cloud Insights全体で、パフォーマンス ポリシーと違反がモニターとアラートに置き換えられました。"モニターによるアラート"環境内の潜在的な問題や傾向に対する柔軟性と洞察力が向上します。
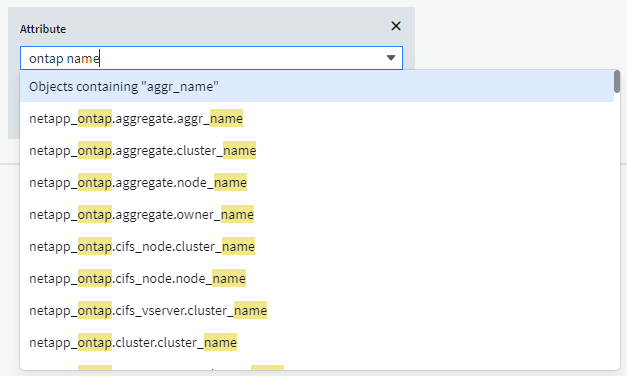
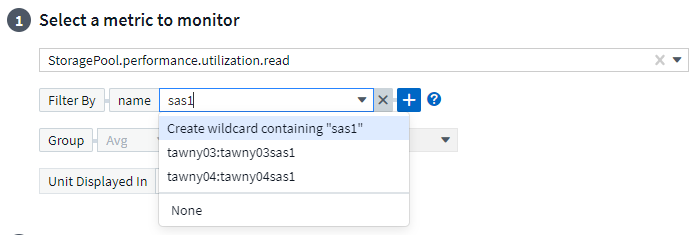
モニターの自動補完候補、ワイルドカード、および式
アラート用のモニターを作成するときに、フィルターの入力が予測的になり、モニターのメトリックや属性を簡単に検索して見つけることができるようになりました。さらに、入力したテキストに基づいてワイルドカード フィルターを作成するオプションもあります。
更新されたTelegrafエージェント
Telegraf 統合データを取り込むエージェントがバージョン 1.19.3 に更新され、パフォーマンスとセキュリティが向上しました。アップデートを希望するユーザーは、"エージェントのインストール"ドキュメント。エージェントの以前のバージョンは、ユーザーの操作を必要とせずに引き続き機能します。
データコレクターのサポート
Cloud Insightsデータ コレクターにいくつかの改善を加えました。以下にハイライトをいくつか紹介します。
-
Microsoft Hyper-V コレクターは WMI の代わりに PowerShell を使用するようになりました
-
Azure VMおよびVHDコレクターは、並列呼び出しにより最大10倍高速化されました。
-
HPE Nimbleはフェデレーション構成とiSCSI構成をサポートするようになりました
当社は常にデータ収集の改善に努めておりますので、注目すべき最近の変更点をいくつかご紹介します。
-
EMC Powerstore の新しいコレクター
-
日立オプスセンターの新コレクター
-
日立コンテンツプラットフォームの新しいコレクター
-
ファブリックプールを報告するためのONTAPコレクターの強化
-
ストレージプールとボリュームのパフォーマンスを強化した ANF
-
ストレージノードとストレージパフォーマンス、およびバケット内のオブジェクト数を備えた強化された EMC ECS
-
ストレージノードとQtreeメトリックを備えたEMC Isilonの強化
-
ボリューム QOS 制限メトリックを備えた拡張 EMC Symetrix
-
拡張IBM SVCおよびEMC PowerStore with Storage Nodes親シリアル番号
2021年8月
新しい監査ページのユーザーインターフェース
その"監査ページ"よりクリーンなインターフェースを提供し、監査イベントを .CSV ファイルにエクスポートできるようになりました。
強化されたユーザーロール管理
Cloud Insightsでは、ユーザー ロールとアクセス制御の割り当てをさらに自由に行うことができるようになりました。ユーザーには、監視、レポート、 Cloud Secureの詳細な権限を個別に割り当てることができるようになりました。
つまり、より多くのユーザーに監視、最適化、レポート機能への管理アクセスを許可しながら、機密性の高いCloud Secure監査およびアクティビティ データへのアクセスを、必要なユーザーのみに制限することができます。
"詳細はこちら"Cloud Insightsドキュメントのさまざまなアクセス レベルについて説明します。
2021年6月
フィルターのオートコンプリート候補、ワイルドカード、および式
Cloud Insightsのこのリリースでは、クエリまたはウィジェットでフィルタリングできるすべての名前と値を知る必要がなくなりました。フィルタリングするときは、入力を開始するだけで、Cloud Insights がテキストに基づいて値を提案します。ウィジェットに表示するアプリケーション名や Kubernetes 属性を見つけるために、事前にアプリケーション名や Kubernetes 属性を調べる必要がなくなります。
フィルターを入力すると、フィルターによって選択可能な結果のスマート リストが表示されるほか、現在のテキストに基づいて ワイルドカード フィルター を作成するオプションも表示されます。このオプションを選択すると、ワイルドカード式に一致するすべての結果が返されます。もちろん、フィルターに追加する複数の個別の値を選択することもできます。
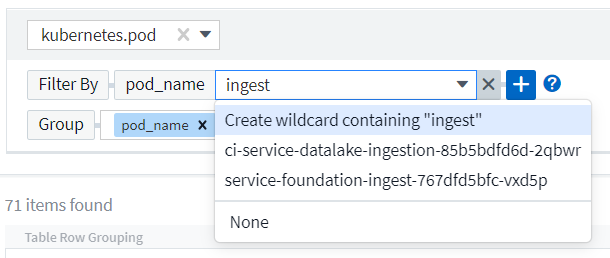
さらに、NOT または OR を使用してフィルターに*式*を作成したり、「なし」オプションを選択してフィールド内の null 値をフィルターしたりすることもできます。
詳細はこちら"フィルタリングオプション"クエリとウィジェット内。
エディション別に利用可能なAPI
Cloud Insightsの強力な API はこれまで以上にアクセスしやすくなり、Alerts API が Standard エディションと Premium エディションで利用できるようになりました。各エディションでは次の API が利用可能です。
| API カテゴリ | Basic | Standard | Premium |
|---|---|---|---|
買収ユニット |
|
|
|
データの収集 |
|
|
|
アラート |
|
|
|
資産 |
|
|
|
データの取り込み |
|
|

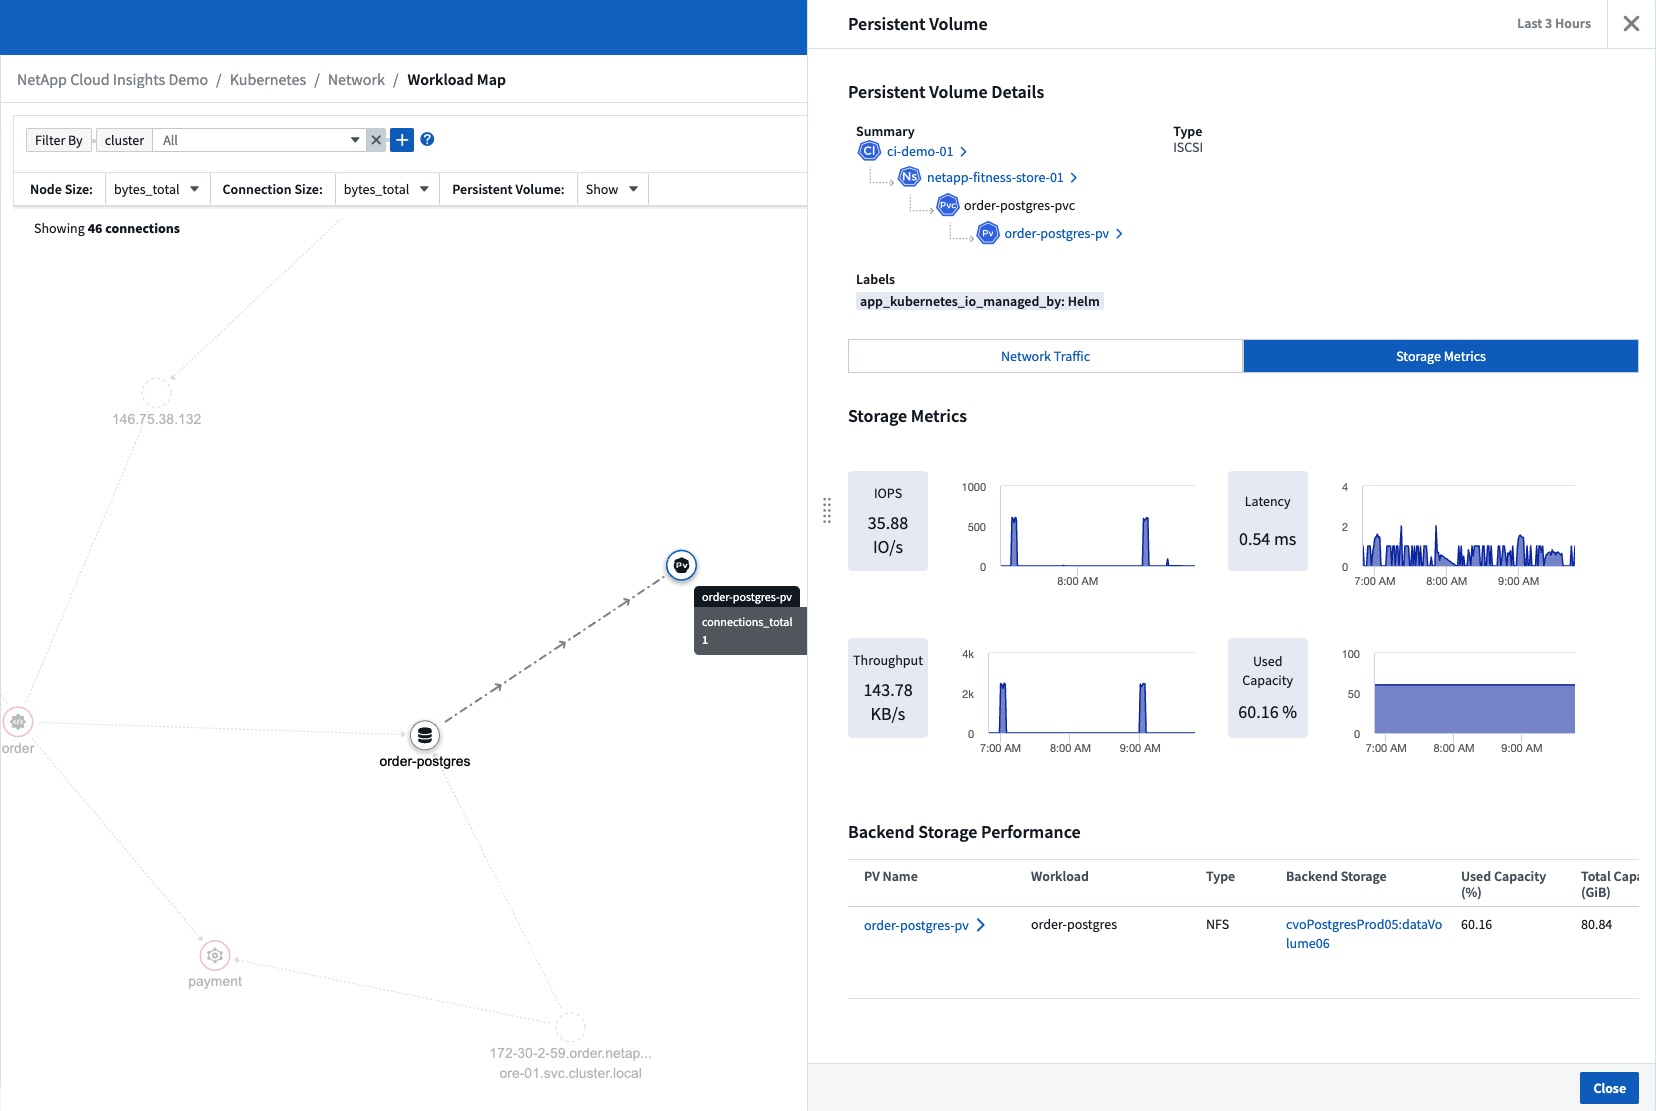
Kubernetes PVとPodの可視性
Cloud Insights は、Kubernetes 環境のバックエンド ストレージの可視性を提供し、Kubernetes Pod と永続ボリューム (PV) に関する分析情報を提供します。単一の Pod の使用状況から PV カウンター、PV、そしてバックエンド ストレージ デバイスに至るまで、IOPS、レイテンシー、スループットなどの PV カウンターを追跡できるようになりました。
ボリュームまたは内部ボリュームのランディング ページには、次の 2 つの新しいテーブルが表示されます。
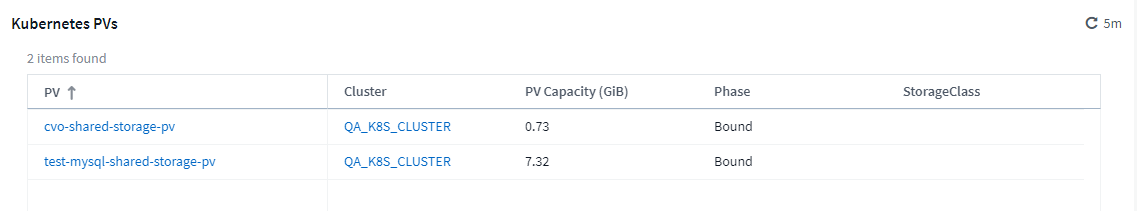
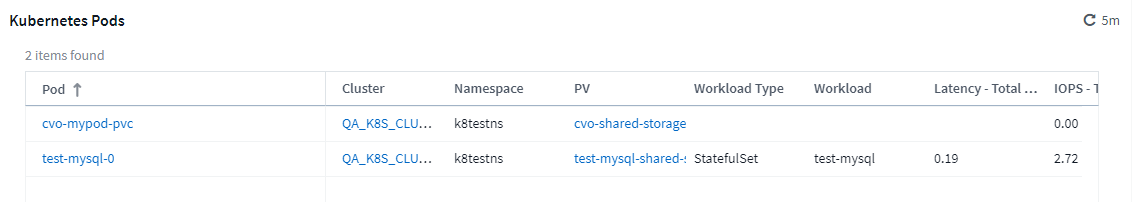
これらの新しいテーブルを活用するには、現在の Kubernetes エージェントをアンインストールして、新規にインストールすることをお勧めします。 Kube-State-Metrics バージョン 2.1.0 以降もインストールする必要があります。
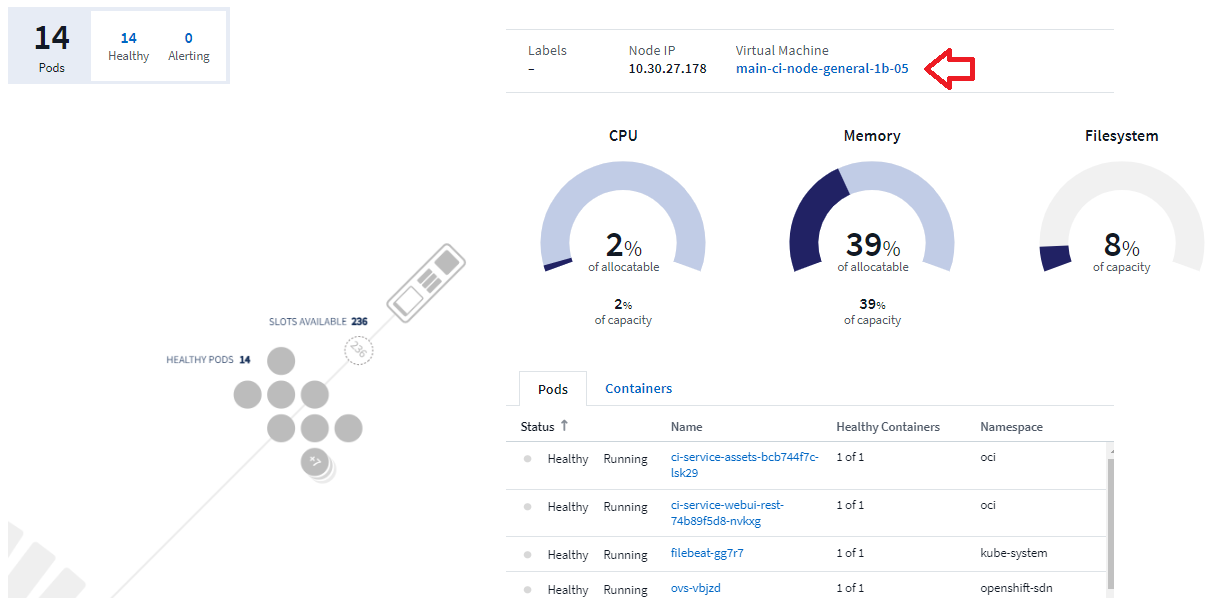
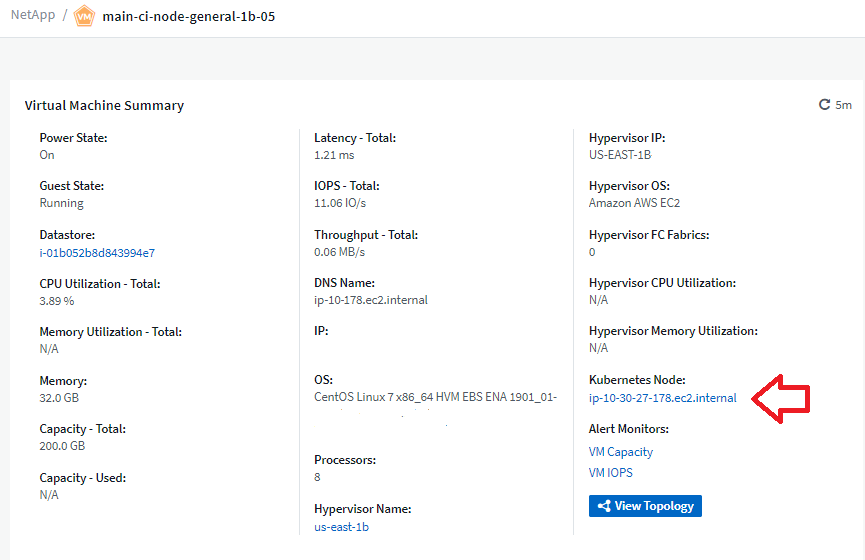
Kubernetes ノードから VM へのリンク
Kubernetes ノード ページでクリックすると、ノードの VM ページが開くようになりました。 VM ページには、ノード自体へのリンクも含まれています。
パフォーマンス ポリシーに代わるアラート モニター
複数のしきい値、Webhook および電子メールアラートの配信、単一のインターフェースを使用したすべてのメトリックのアラートなどの追加のメリットを有効にするために、 Cloud Insights は2021 年 7 月から 8 月にかけて、Standard および Premium Edition のお客様を パフォーマンス ポリシー から モニター に変換します。詳細はこちら"アラートとモニター"このエキサイティングな変化にご期待ください。
Cloud SecureはNFSをサポート
Cloud Secure は、 ONTAPデータ収集用の NFS をサポートするようになりました。 SMB および NFS ユーザー アクセスを監視して、ランサムウェア攻撃からデータを保護します。さらに、 Cloud Secure は、NFS ユーザー属性の収集のために Active-Directory および LDAP ユーザー ディレクトリをサポートしています。
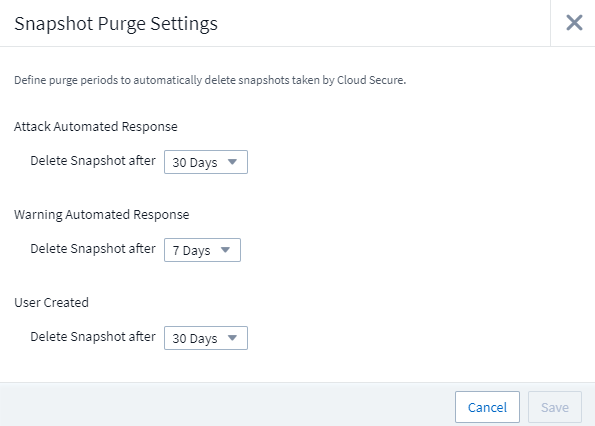
Cloud Secureスナップショットの消去
Cloud Secure は、スナップショット消去設定に基づいてスナップショットを自動的に削除し、ストレージ スペースを節約し、手動でスナップショットを削除する必要性を減らします。
Cloud Secureデータ収集速度
単一のデータ コレクター エージェント システムは、1 秒あたり最大 20,000 件のイベントをCloud Secureに投稿できるようになりました。
2021年5月
4 月に行った変更の一部をご紹介します。
更新されたTelegrafエージェント
Telegraf 統合データを取り込むエージェントがバージョン 1.17.3 に更新され、パフォーマンスとセキュリティが向上しました。アップデートを希望するユーザーは、"エージェントのインストール"ドキュメント。エージェントの以前のバージョンは、ユーザーの操作を必要とせずに引き続き機能します。
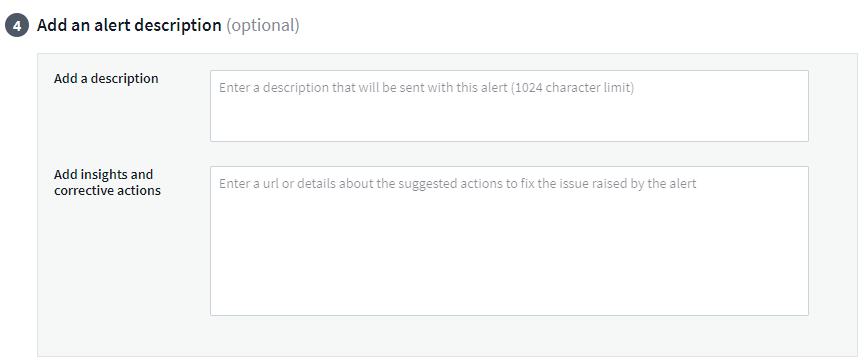
アラートに是正措置を追加する
*アラートの説明を追加*セクションに入力することで、モニターを作成または変更するときに、オプションの説明や追加の洞察や修正アクションを追加できるようになりました。説明はアラートとともに送信されます。 洞察と是正措置 フィールドでは、アラートに対処するための詳細な手順とガイダンスが提供され、アラート ランディング ページの概要セクションに表示されます。
すべてのエディション向けのCloud Insights API
API アクセスは、 Cloud Insightsのすべてのエディションで利用できるようになりました。 Basic エディションのユーザーは、取得ユニットとデータ コレクターのアクションを自動化できるようになりました。また、Standard エディションのユーザーは、メトリックを照会したり、カスタム メトリックを取り込んだりすることができます。プレミアム エディションでは、引き続きすべての API カテゴリをフルに使用できます。
| API カテゴリ | Basic | Standard | Premium |
|---|---|---|---|
買収ユニット |
|
|
|
データの収集 |
|
|
|
資産 |
|
|
|
データの取り込み |
|
|
|
Data Warehouse |
|
APIの使用に関する詳細は、"APIのドキュメント" 。
2021年4月
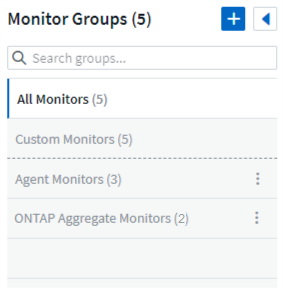
モニターの管理が簡単
"モニターのグループ化"環境内のモニターの管理を簡素化します。複数のモニターをグループ化し、1 つとして一時停止できるようになりました。たとえば、インフラストラクチャのスタックで更新が行われている場合、ワンクリックですべてのデバイスからのアラートを一時停止できます。
モニター グループは、 Cloud InsightsにONTAPデバイスの管理機能の向上をもたらす魅力的な新機能の最初の部分です。
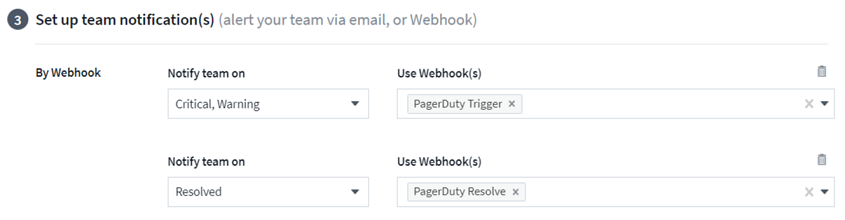
Webhookを使用した強化されたアラートオプション
多くの商用アプリケーションがサポート"ウェブフック"標準入力インターフェースとして。 Cloud Insights は現在、これらの配信チャネルの多くをサポートしており、Slack、PagerDuty、Teams、Discord のデフォルト テンプレートを提供しているほか、他の多くのアプリケーションをサポートするためにカスタマイズ可能な汎用 Webhook も提供しています。
デバイス識別の改善
監視とトラブルシューティングを改善し、正確なレポートを提供するには、デバイスの IP アドレスやその他の識別子ではなく、デバイスの名前を理解することが役立ちます。 Cloud Insightsには、ルールベースのアプローチを使用して、環境内のストレージと物理ホストデバイスの名前を自動的に識別する方法が組み込まれました。"デバイスの解像度" *管理*メニューで利用できます。
もっと求めてたよ!
お客様から、データの範囲を視覚化するためのデフォルト オプションを増やしてほしいというご要望が多かったため、時間範囲ピッカーを通じてサービス全体で利用できる次の 5 つの新しい選択肢を追加しました。
-
最後の30分
-
過去 2 時間
-
過去 6 時間
-
過去 12 時間
-
過去 2 日間
1 つのCloud Insights環境で複数のサブスクリプション
4 月 2 日より、 Cloud Insights は単一のCloud Insightsインスタンスで、顧客に対して同じエディション タイプの複数のサブスクリプションをサポートします。これにより、顧客はCloud Insightsサブスクリプションの一部をインフラストラクチャの購入と同時に終了できるようになります。複数のサブスクリプションに関するサポートについては、 NetApp の営業部にお問い合わせください。
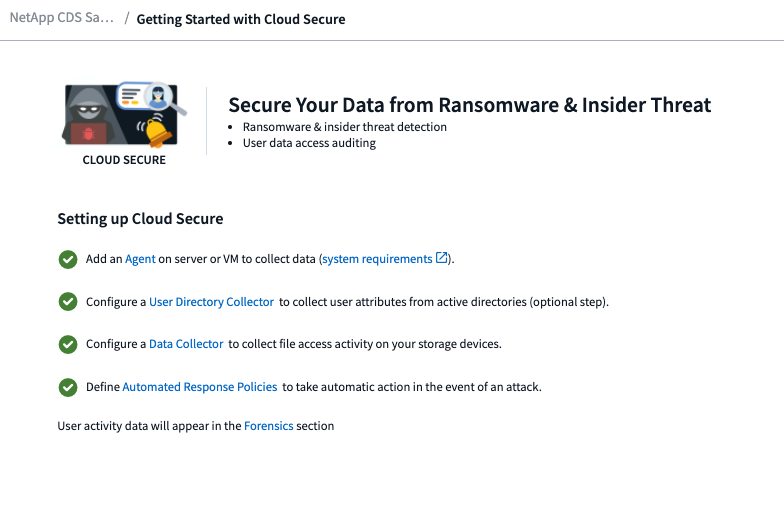
あなたの道を選びなさい
Cloud Insightsを設定する際に、監視とアラートから開始するか、ランサムウェアと内部脅威の検出から開始するかを選択できるようになりました。 Cloud Insights は、選択したパスに基づいて開始環境を構成します。他のパスは後からいつでも設定できます。
より簡単なCloud Secureオンボーディング
また、新しいステップバイステップのセットアップ チェックリストにより、 Cloud Secureの使用を開始するのがこれまで以上に簡単になりました。
いつものように、皆様からのご提案をお待ちしております。 ng-cloudinsights-customerfeedback@netapp.com までお送りください。
2021年2月
更新されたTelegrafエージェント
Telegraf 統合データを取り込むエージェントがバージョン 1.17.0 に更新され、脆弱性とバグの修正が含まれています。
クラウドコストアナライザー
過去、現在、および推定支出の詳細なコスト分析を提供し、環境内のクラウド使用状況を可視化する、 NetAppの Spot と Cloud Cost のパワーを体験してください。クラウド コスト ダッシュボードでは、クラウド費用を明確に把握し、個々のワークロード、アカウント、サービスにドリルダウンすることができます。
Cloud Cost は、次のような大きな課題の解決に役立ちます。
-
クラウド費用の追跡と監視
-
無駄と潜在的な最適化領域の特定
-
実行可能なアクションアイテムの提供
クラウドコストは監視に重点を置いています。完全な Spot by NetAppアカウントにアップグレードすると、自動的なコスト削減と環境の最適化が可能になります。
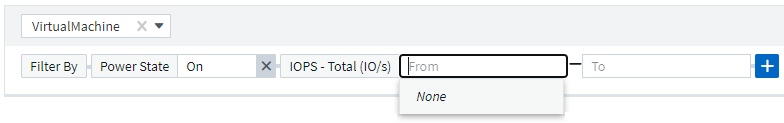
フィルターを使用して null 値を持つオブジェクトを照会する
Cloud Insightsでは、フィルターを使用して null/none 値を持つ属性とメトリックを検索できるようになりました。このフィルタリングは、次の場所の任意の属性/メトリックに対して実行できます。
-
クエリページ
-
ダッシュボードウィジェットとページ変数
-
アラートリストページ
-
モニターを作成するとき
null/なしの値をフィルタリングするには、適切なフィルタ ドロップダウンに [なし] オプションが表示されたらそれを選択するだけです。
マルチリージョンサポート
本日より、世界中のさまざまな地域でCloud Insightsサービスの提供を開始し、米国外に拠点を置くお客様のパフォーマンス向上とセキュリティ強化を実現します。 Cloud Insights/ Cloud Secure は、環境が作成されたリージョンに応じて情報を保存します。
クリック"ここをクリックしてください。"詳細についてはこちらをご覧ください。
2021年1月
追加のONTAPメトリックの名前が変更されました
ONTAPシステムからのデータ収集の効率を向上するための継続的な取り組みの一環として、次のONTAPメトリックの名前が変更されました。
これらのメトリックのいずれかを使用している既存のダッシュボード ウィジェットまたはクエリがある場合は、新しいメトリック名を使用するためにそれらを編集または再作成する必要があります。
| 以前のメトリック名 | 新しいメトリック名 |
|---|---|
netapp_ontap.disk_constituent.total_transfers |
netapp_ontap.disk_constituent.total_iops |
netapp_ontap.disk.total_transfers |
netapp_ontap.disk.total_iops |
netapp_ontap.fcp_lif.read_data |
netapp_ontap.fcp_lif.読み取りスループット |
netapp_ontap.fcp_lif.write_data |
netapp_ontap.fcp_lif.書き込みスループット |
netapp_ontap.iscsi_lif.read_data |
netapp_ontap.iscsi_lif.読み取りスループット |
netapp_ontap.iscsi_lif.write_data |
netapp_ontap.iscsi_lif.書き込みスループット |
netapp_ontap.lif.recv_data |
netapp_ontap.lif.recv_throughput |
netapp_ontap.lif.送信データ |
netapp_ontap.lif.送信スループット |
netapp_ontap.lun.read_data |
netapp_ontap.lun.読み取りスループット |
netapp_ontap.lun.write_data |
netapp_ontap.lun.書き込みスループット |
netapp_ontap.nic_common.rx_bytes |
netapp_ontap.nic_common.rx_throughput |
netapp_ontap.nic_common.tx_bytes |
netapp_ontap.nic_common.tx_throughput |
netapp_ontap.path.read_data |
netapp_ontap.path.読み取りスループット |
netapp_ontap.path.write_data |
netapp_ontap.path.write_throughput |
netapp_ontap.path.total_data |
netapp_ontap.path.合計スループット |
netapp_ontap.ポリシーグループ.読み取りデータ |
netapp_ontap.ポリシーグループ.読み取りスループット |
netapp_ontap.ポリシーグループ.write_data |
netapp_ontap.ポリシーグループ.書き込みスループット |
netapp_ontap.ポリシーグループ.その他のデータ |
netapp_ontap.ポリシーグループ.その他のスループット |
netapp_ontap.ポリシーグループ.合計データ |
netapp_ontap.ポリシーグループ.合計スループット |
netapp_ontap.system_node.disk_data_read |
netapp_ontap.system_node.disk_throughput_read |
netapp_ontap.system_node.disk_data_written |
netapp_ontap.system_node.disk_throughput_written |
netapp_ontap.system_node.hdd_data_read |
netapp_ontap.system_node.hdd_throughput_read |
netapp_ontap.system_node.hdd_data_written |
netapp_ontap.system_node.hdd_throughput_written |
netapp_ontap.system_node.ssd_data_read |
netapp_ontap.system_node.ssd_throughput_read |
netapp_ontap.system_node.ssd_data_written |
netapp_ontap.system_node.ssd_throughput_written |
netapp_ontap.system_node.net_data_recv |
netapp_ontap.system_node.net_throughput_recv |
netapp_ontap.system_node.net_data_sent |
netapp_ontap.system_node.net_throughput_sent |
netapp_ontap.system_node.fcp_data_recv |
netapp_ontap.system_node.fcp_throughput_recv |
netapp_ontap.system_node.fcp_data_sent |
netapp_ontap.system_node.fcp_throughput_sent |
netapp_ontap.volume_node.cifs_read_data |
netapp_ontap.volume_node.cifs_read_throughput |
netapp_ontap.volume_node.cifs_write_data |
netapp_ontap.volume_node.cifs_write_throughput |
netapp_ontap.volume_node.nfs_read_data |
netapp_ontap.volume_node.nfs_read_throughput |
netapp_ontap.volume_node.nfs_write_data |
netapp_ontap.volume_node.nfs_write_throughput |
netapp_ontap.volume_node.iscsi_read_data |
netapp_ontap.volume_node.iscsi_read_throughput |
netapp_ontap.volume_node.iscsi_write_data |
netapp_ontap.volume_node.iscsi_write_throughput |
netapp_ontap.volume_node.fcp_read_data |
netapp_ontap.volume_node.fcp_read_throughput |
netapp_ontap.volume_node.fcp_write_data |
netapp_ontap.volume_node.fcp_write_throughput |
netapp_ontap.ボリューム.読み取りデータ |
netapp_ontap.ボリューム.読み取りスループット |
netapp_ontap.ボリューム.書き込みデータ |
netapp_ontap.ボリューム.書き込みスループット |
netapp_ontap.workload.read_data |
netapp_ontap.workload.read_throughput |
netapp_ontap.ワークロード.書き込みデータ |
netapp_ontap.workload.write_throughput |
netapp_ontap.ワークロードボリューム.読み取りデータ |
netapp_ontap.ワークロードボリューム.読み取りスループット |
netapp_ontap.ワークロードボリューム.書き込みデータ |
netapp_ontap.ワークロードボリューム.書き込みスループット |
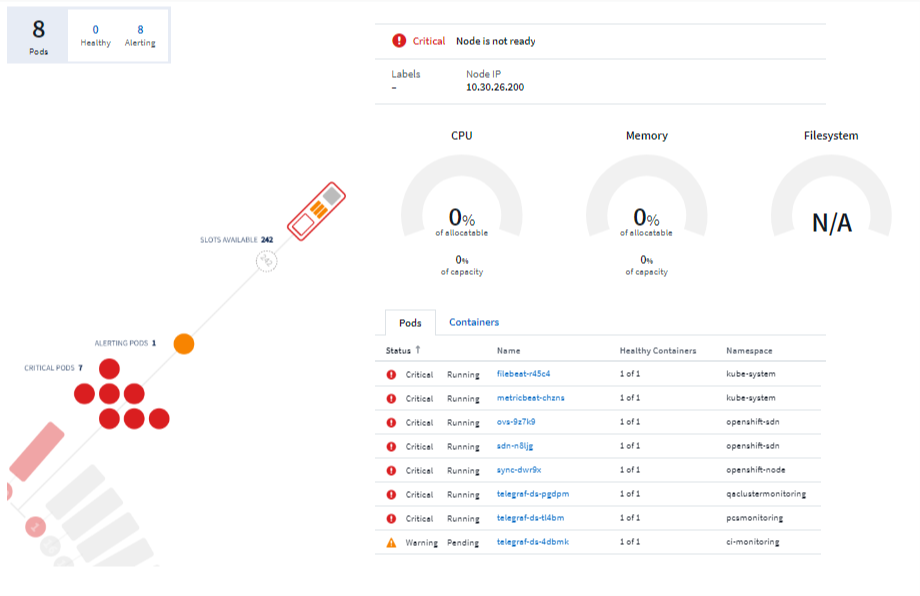
新しい Kubernetes エクスプローラー
その"Kubernetes エクスプローラー"Kubernetes クラスターのシンプルなトポロジ ビューを提供し、専門家でなくても、クラスター レベルからコンテナーやストレージに至るまで、問題と依存関係を迅速に特定できます。
Kubernetes Explorer のドリルダウン詳細を使用して、Kubernetes 環境内のクラスター、ノード、ポッド、コンテナー、ストレージのステータス、使用状況、正常性に関するさまざまな情報を調査できます。
2020年12月
よりシンプルなKubernetesのインストール
Kubernetes エージェントのインストールが合理化され、ユーザーによる操作が少なくて済むようになりました。"Kubernetesエージェントのインストール" Kubernetes データ収集が含まれるようになりました。
2020年11月
追加のダッシュボード
次の新しいONTAPに特化したダッシュボードがギャラリーに追加され、インポートできるようになりました。
-
ONTAP: 総合的なパフォーマンスと容量
-
ONTAP FAS/ AFF - 容量使用率
-
ONTAP FAS/ AFF - クラスタ容量
-
ONTAP FAS/ AFF - 効率
-
ONTAP FAS/ AFF - FlexVolパフォーマンス
-
ONTAP FAS/ AFF - ノードの運用/最適ポイント
-
ONTAP FAS/ AFF - 事前事後容量効率
-
ONTAP: ネットワークポートアクティビティ
-
ONTAP: ノードプロトコルのパフォーマンス
-
ONTAP: ノードワークロードパフォーマンス(フロントエンド)
-
ONTAP: プロセッサ
-
ONTAP: SVM ワークロード パフォーマンス (フロントエンド)
-
ONTAP: ボリューム ワークロード パフォーマンス (フロントエンド)
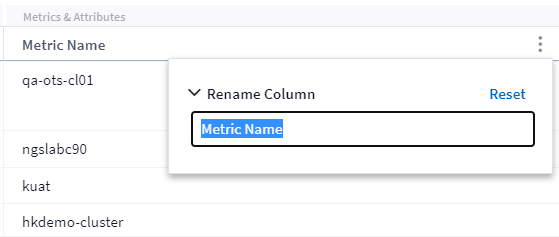
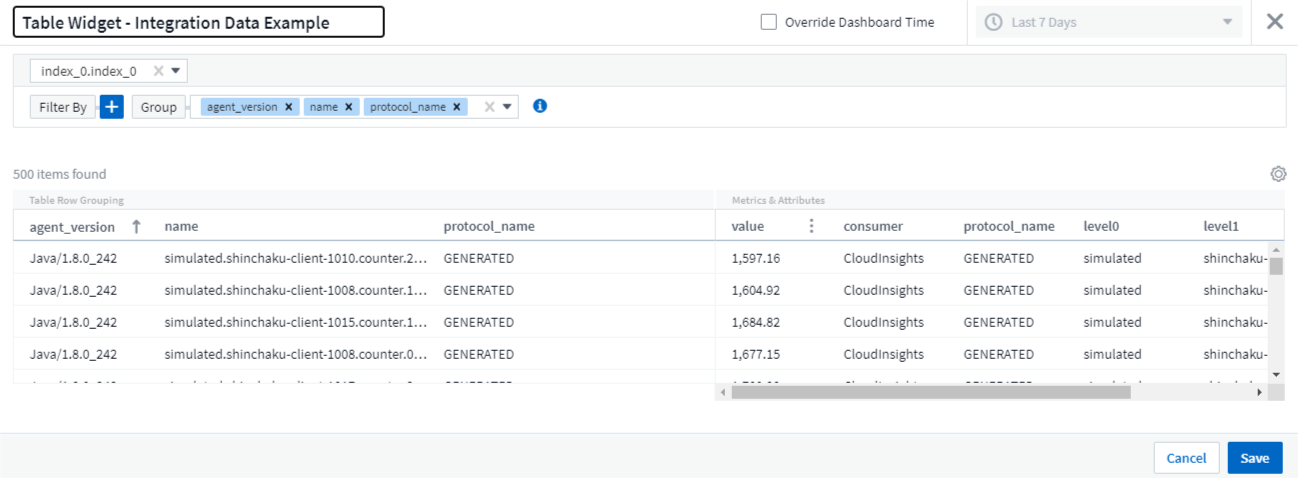
テーブルウィジェットの列名の変更
テーブル ウィジェットの [メトリックと属性] セクションの列の名前を変更するには、ウィジェットを編集モードで開き、列の上部にあるメニューをクリックします。新しい名前を入力して [Save] をクリックするか、[Reset] をクリックして列を元の名前に戻します。
これはテーブル ウィジェット内の列の表示名にのみ影響し、基になるデータ自体のメトリック/属性名は変更されないことに注意してください。
2020年10月
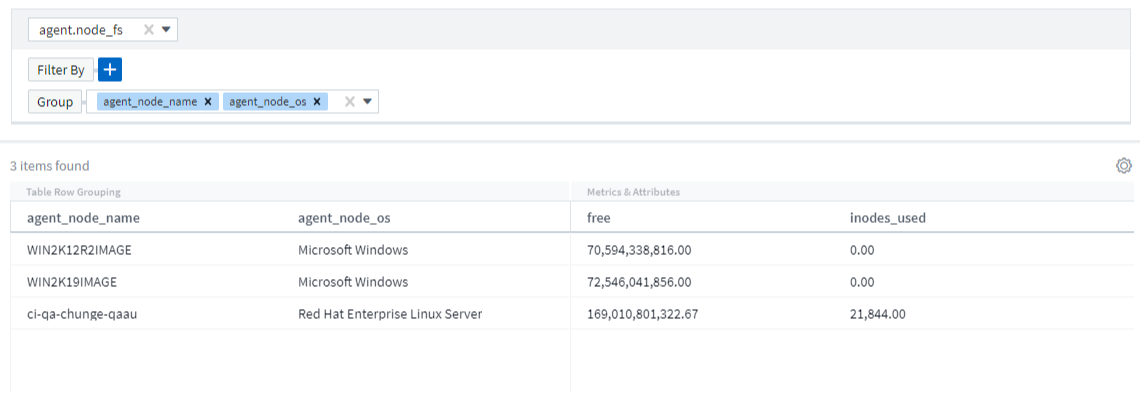
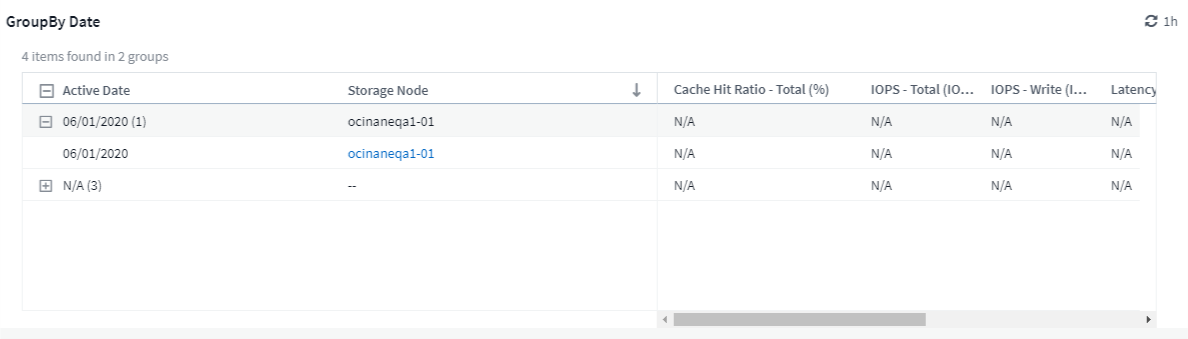
統合データのデフォルトの拡張
テーブル ウィジェットのグループ化により、Kubernetes、 ONTAP Advanced Data、およびエージェント ノードのメトリックのデフォルトの拡張が可能になりました。たとえば、Kubernetes Nodes を Cluster ごとにグループ化すると、テーブルに各クラスターの行が表示されます。次に、各クラスター行を展開して、ノード オブジェクトのリストを表示できます。
ベーシックエディションのテクニカルサポート
テクニカル サポートは、Standard Edition および Premium Edition に加えて、 Cloud Insights Basic Edition の加入者にも利用できるようになりました。さらに、 Cloud Insightsにより、 NetAppサポート チケットを作成するワークフローが簡素化されました。
Cloud SecureパブリックAPI
Cloud Secureは"REST API"アクティビティとアラートの情報にアクセスします。これは、 Cloud Secure Admin UI を通じて作成された API アクセス トークンを使用することで実現され、その後 REST API へのアクセスに使用されます。これらの REST API の Swagger ドキュメントはCloud Secureと統合されています。
2020年9月
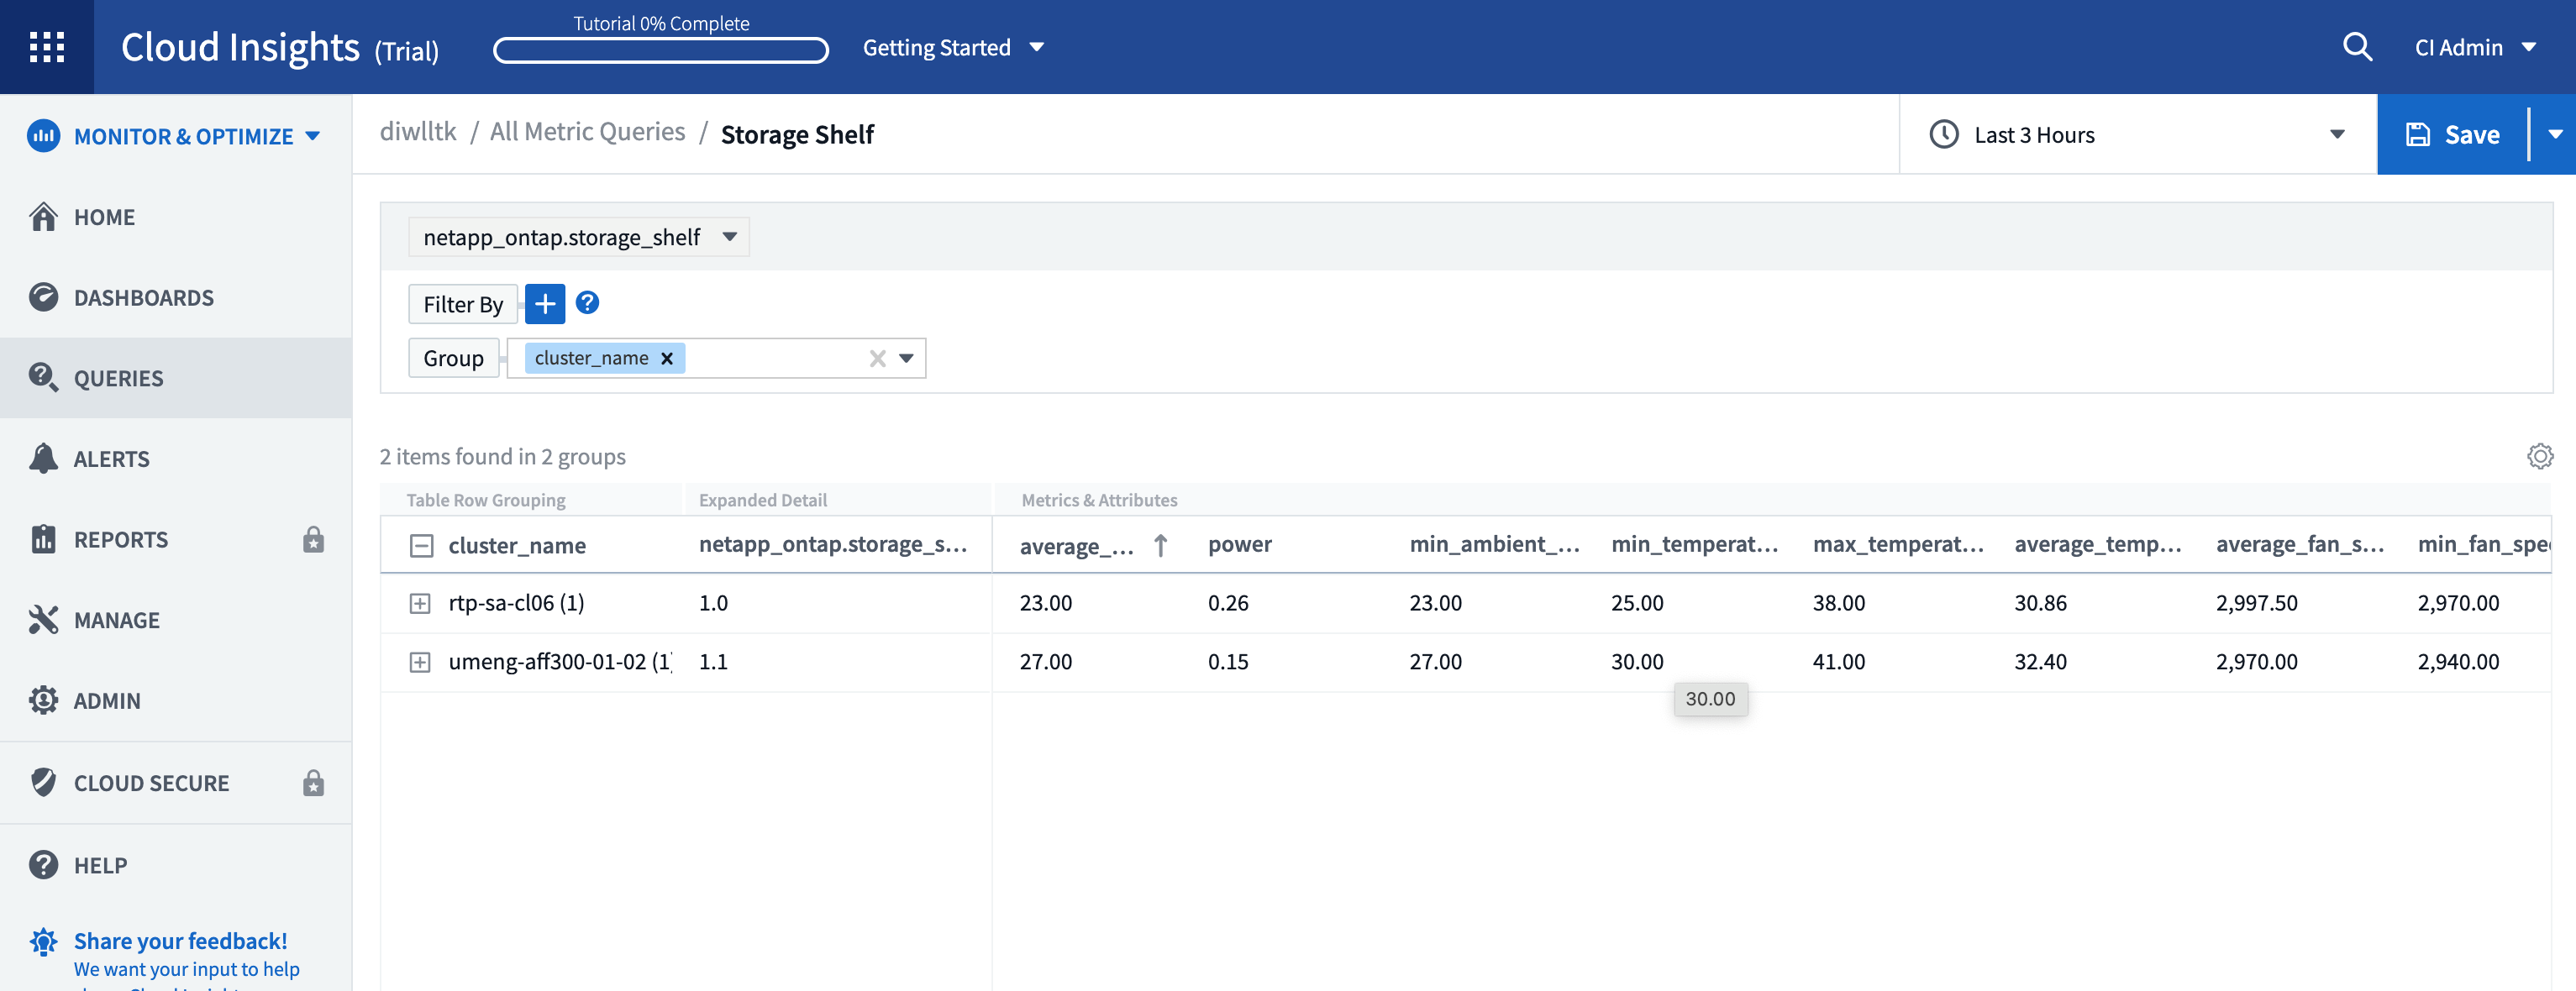
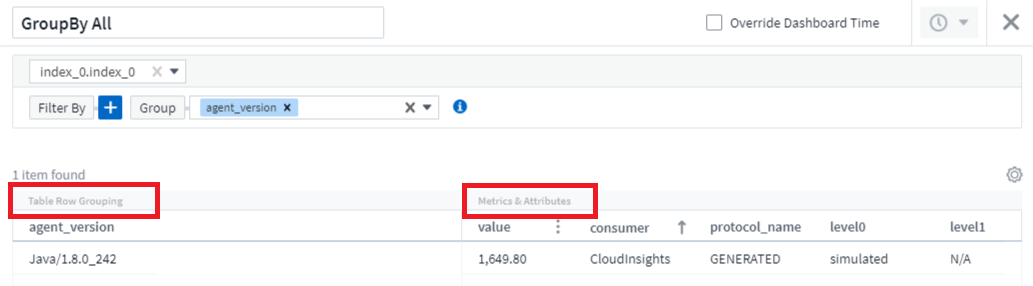
統合データを含むクエリページ
Cloud Insightsクエリ ページは、統合データ (Kubernetes、 ONTAP Advanced Metrics など) をサポートします。統合データを使用する場合、クエリ結果テーブルには「分割画面」ビューが表示され、左側にオブジェクト/グループ、右側にオブジェクト データ (属性/メトリック) が表示されます。統合データをグループ化するために複数の属性を選択することもできます。
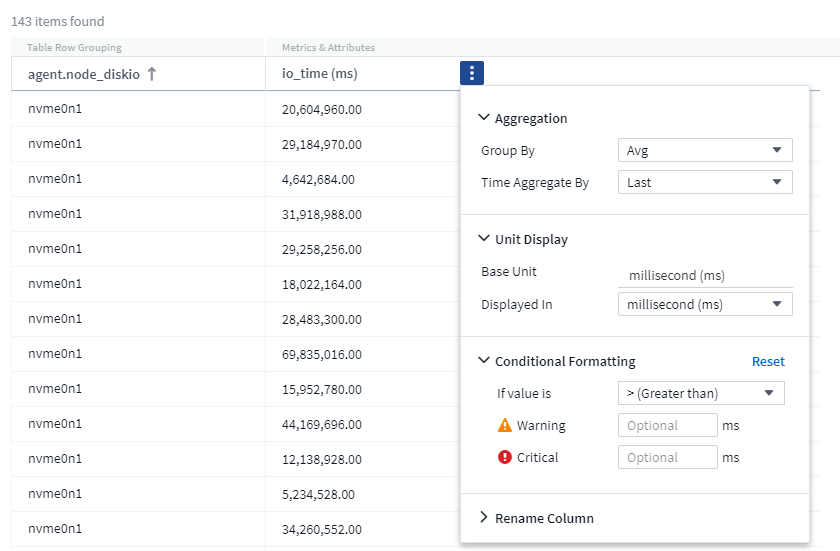
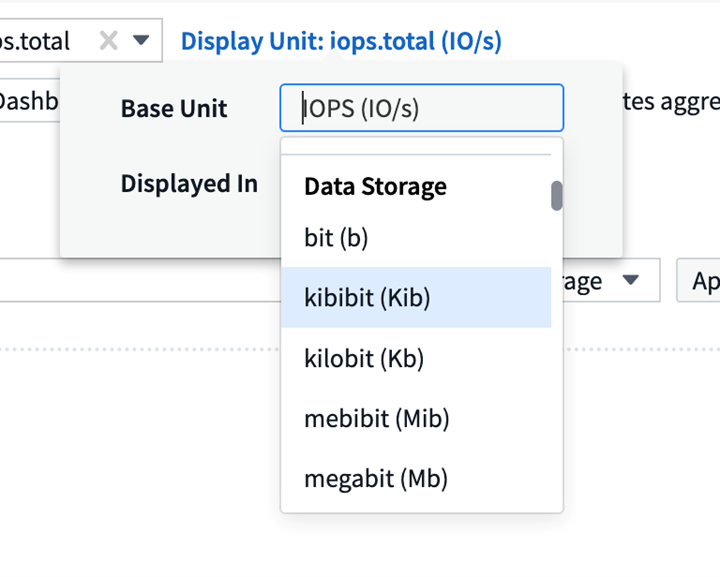
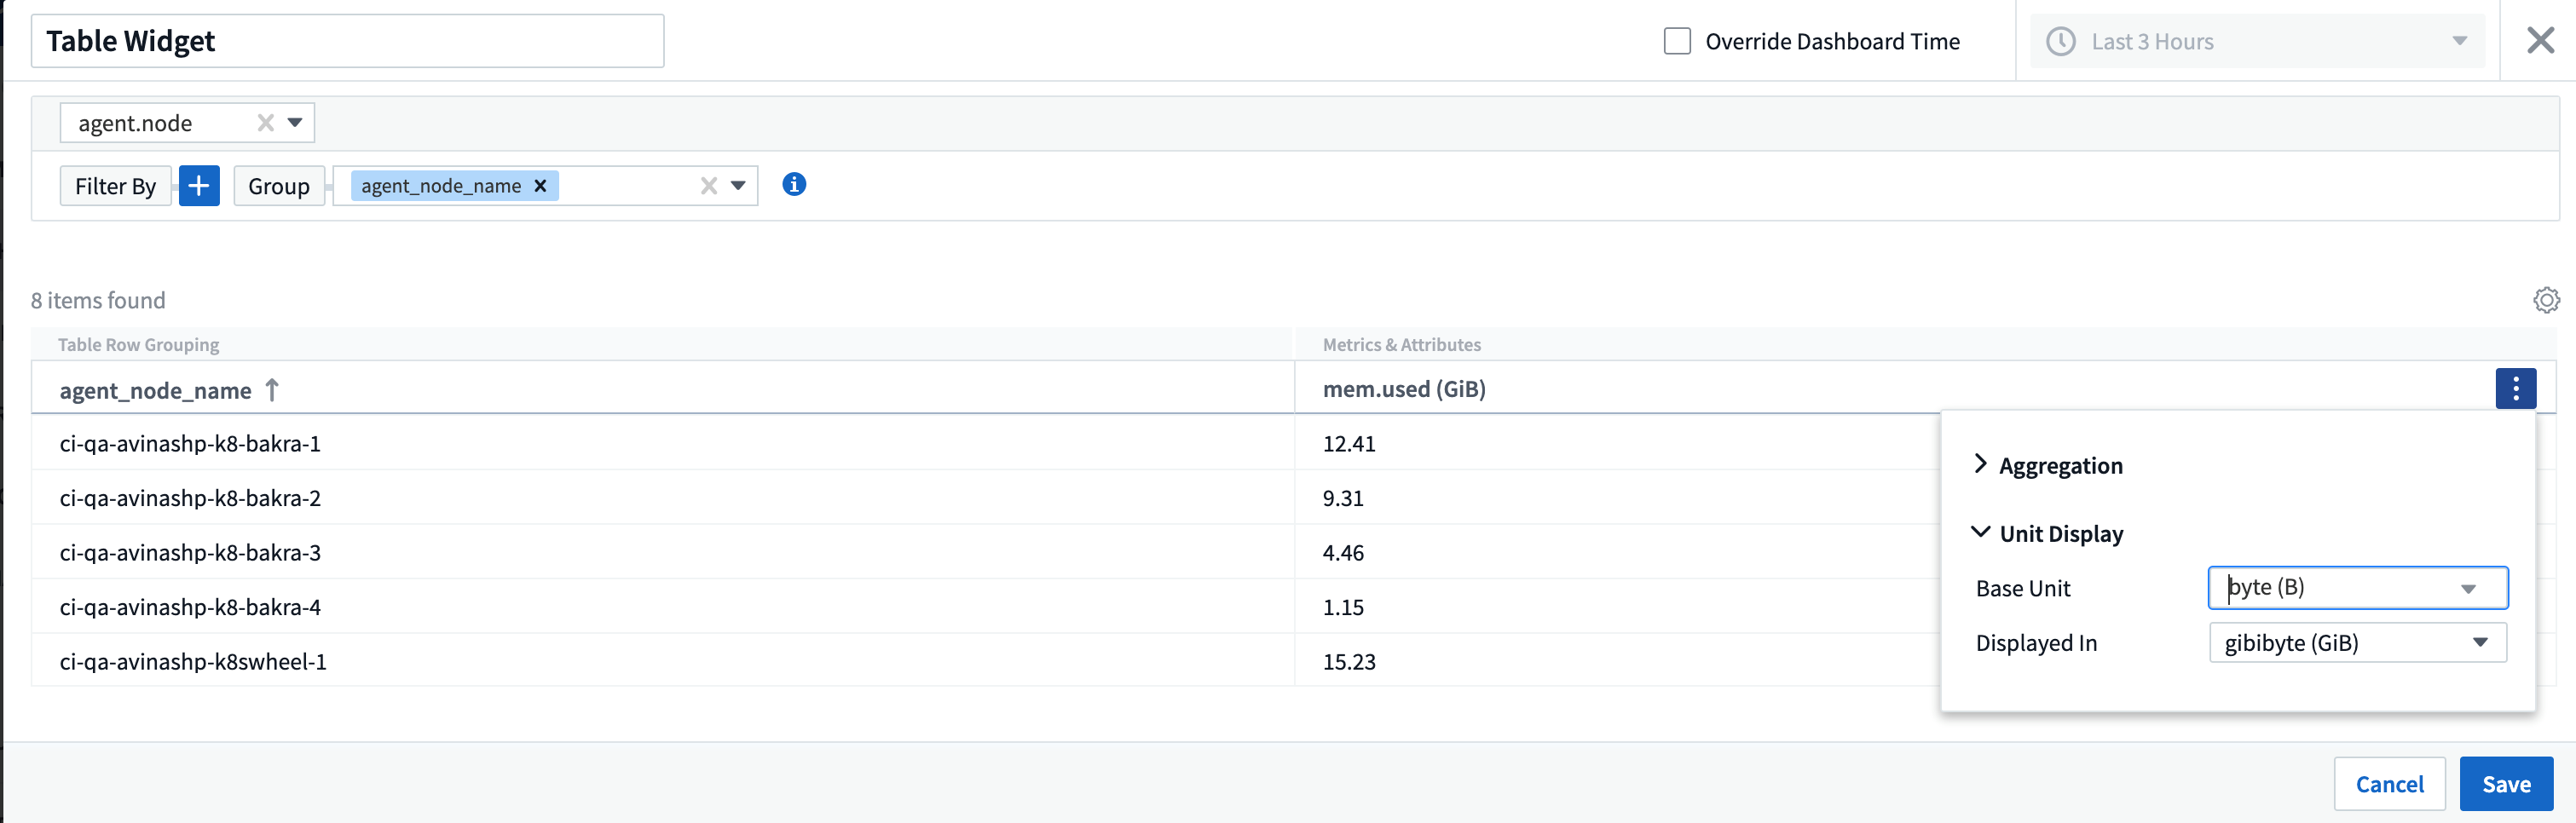
テーブルウィジェットの単位表示書式
メトリック/カウンター データ (ギガバイト、MB/秒など) を表示する列のテーブル ウィジェットで、単位表示フォーマットが利用できるようになりました。メトリックの表示単位を変更するには、列ヘッダーの「3 つのドット」メニューをクリックし、「単位表示」を選択します。利用可能なユニットから選択できます。使用可能な単位は、表示列のメトリック データの種類によって異なります。
取得ユニット詳細ページ
獲得ユニットには独自のランディング ページが用意され、各 AU に関する有用な詳細情報やトラブルシューティングに役立つ情報が提供されるようになりました。その"AU詳細ページ"AU のデータ収集者へのリンクと役立つステータス情報を提供します。
Cloud SecureDocker依存関係の削除
Cloud Secure の Docker への依存関係が削除されました。 Cloud Secureエージェントのインストールに Docker は不要になりました。
ユーザーロールの報告
Cloud Insights Premium Edition と Reporting をご利用の場合、環境内のすべてのCloud Insightsユーザーに Reporting アプリケーション (Cognos など) へのシングル サインオン (SSO) ログイン権限が付与されます。メニューの Reports リンクをクリックすると、Reporting に自動的にログインします。
Cloud Insightsにおけるユーザーの役割によって、"報告ユーザーの役割" :
Cloud Insightsの役割 |
報告役割 |
報告権限 |
ゲスト |
消費者 |
レポートを表示、スケジュール、実行したり、言語やタイムゾーンなどの個人設定を行ったりできます。消費者はレポートを作成したり、管理タスクを実行したりすることはできません。 |
ユーザ |
作成者 |
すべてのコンシューマー機能を実行できるほか、レポートとダッシュボードを作成および管理できます。 |
管理者 |
管理者 |
すべての作成者機能のほか、レポートの構成、レポート タスクのシャットダウンと再起動などのすべての管理タスクを実行できます。 |

|
Cloud Insights Reporting は、500 MU 以上の環境で利用できます。 |

|
現在プレミアムエディションをご利用で、レポートを保持したい場合は、こちらをお読みください。"既存のお客様への重要なお知らせ" 。 |
データ取り込み用の新しい API カテゴリ
Cloud Insights に*データ取り込み* API カテゴリが追加され、カスタム データとエージェントをより細かく制御できるようになりました。この API カテゴリおよびその他の API カテゴリの詳細なドキュメントは、 Cloud Insightsで [管理] > [API アクセス] に移動し、[API ドキュメント] リンクをクリックすると見つかります。 AU の詳細ページと AU リスト ページに表示される「メモ」フィールドで AU にコメントを添付することもできます。
2020年8月
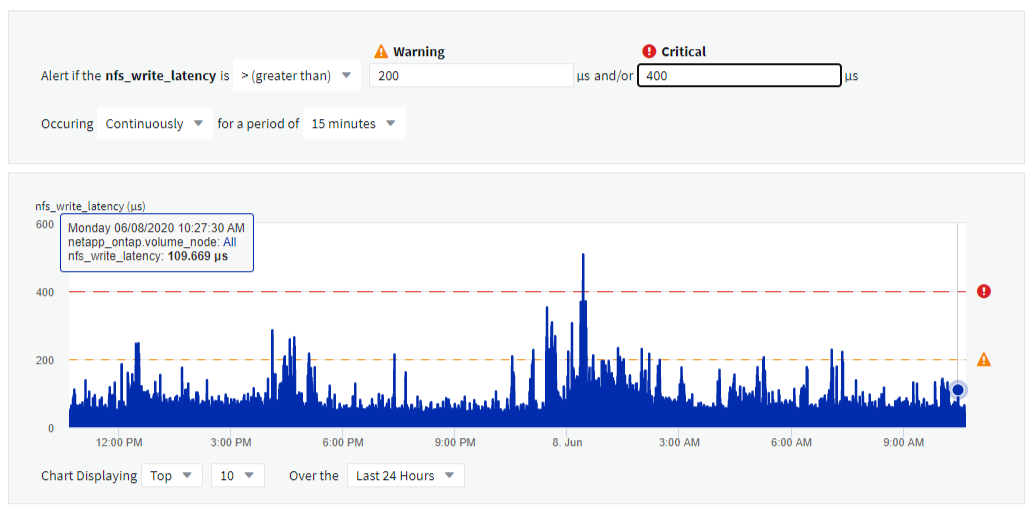
監視と警告
ストレージオブジェクト、VM、EC2、ポートのパフォーマンスポリシーを設定する現在の機能に加えて、 Cloud Insights Standard Editionには、"モニターを構成する" Kubernetes、 ONTAP の高度なメトリック、および Telegraf プラグインの統合データのしきい値。アラートをトリガーするオブジェクト メトリックごとにモニターを作成し、警告レベルまたは重大レベルのしきい値の条件を設定し、各レベルに必要な電子メール受信者を指定するだけです。その後、"アラートの表示と管理"傾向を追跡したり、問題をトラブルシューティングしたりします。
2020年7月
Cloud Secure_スナップショット_アクション
Cloud Secure は、悪意のあるアクティビティが検出されると自動的にスナップショットを取得してデータを保護し、データが安全にバックアップされることを保証します。
ランサムウェア攻撃やその他の異常なユーザー アクティビティが検出されたときにスナップショットを取得する自動応答ポリシーを定義できます。アラート ページから手動でスナップショットを取得することもできます。
自動スナップショットが取得されました: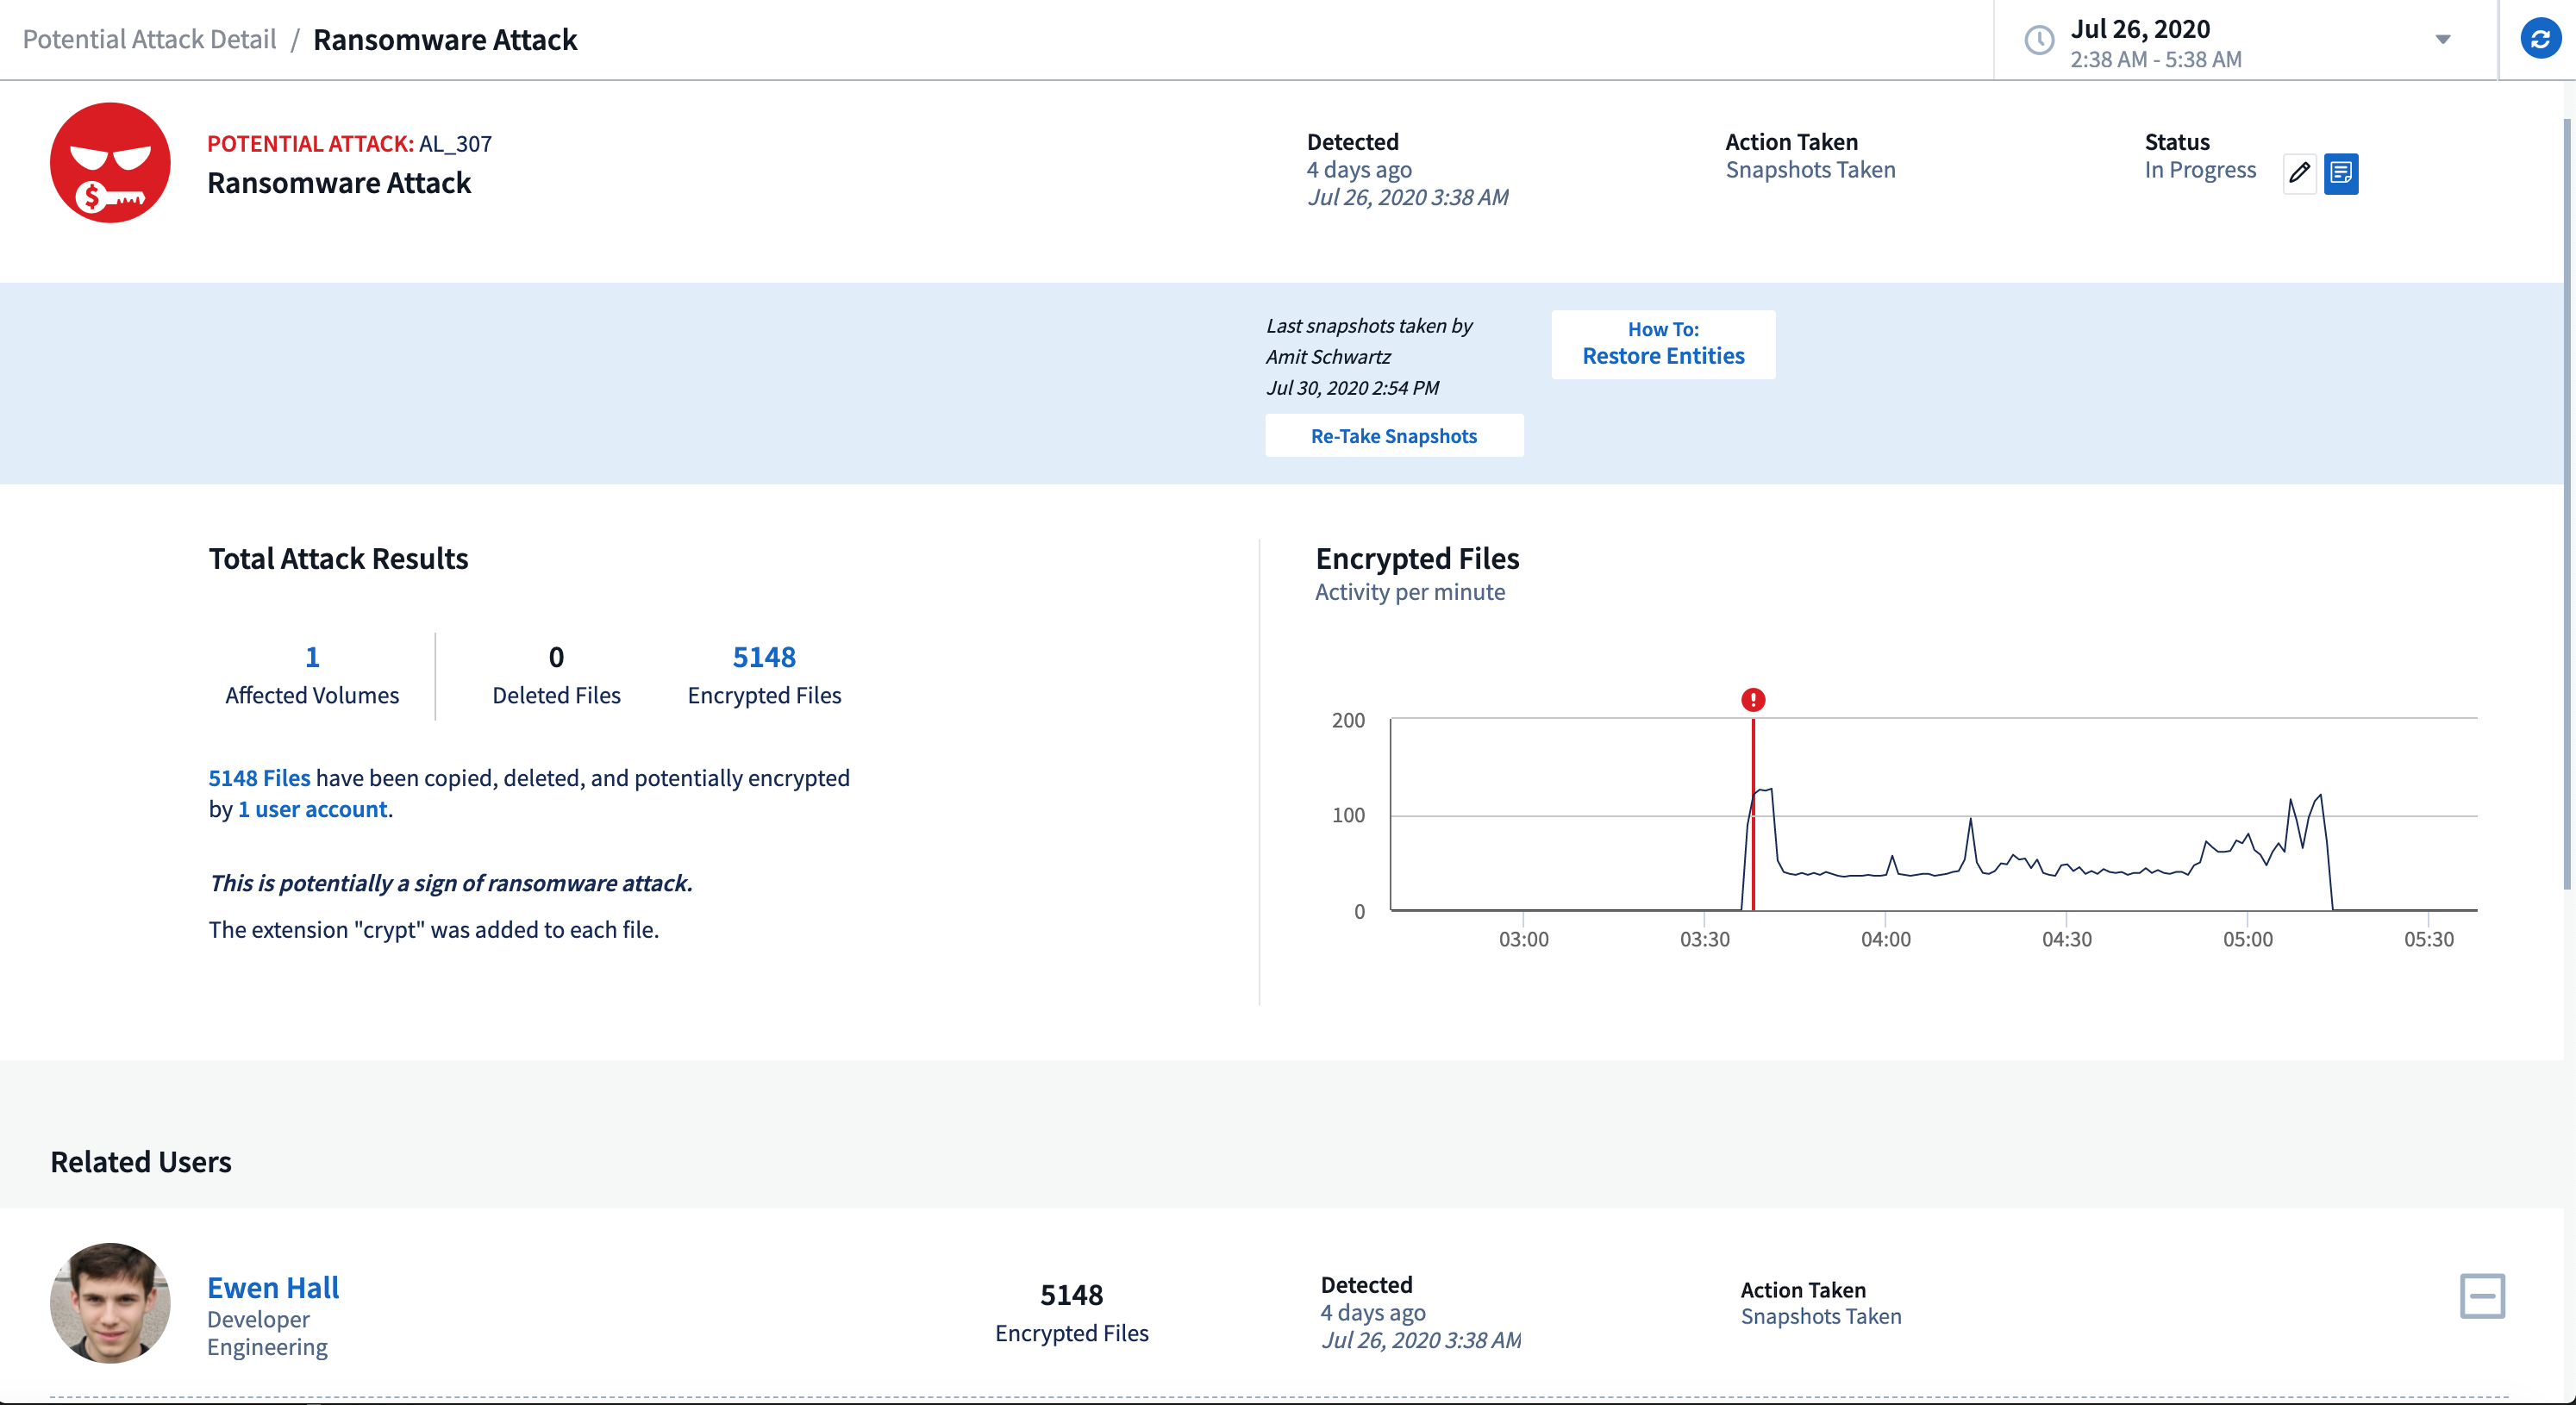
手動スナップショット: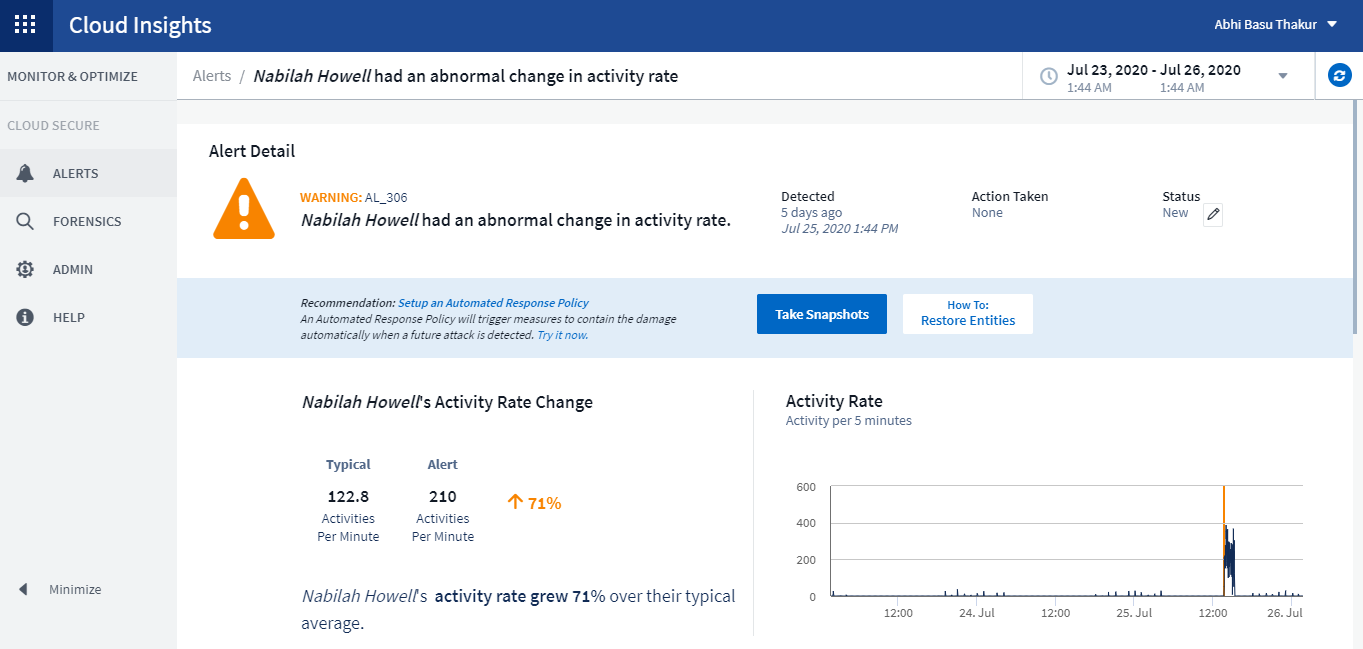
メトリック/カウンターの更新
Cloud Insights UI および REST API では、次の容量カウンターを使用できます。以前は、これらのカウンターはデータ ウェアハウス/レポートでのみ使用可能でした。
| オブジェクト タイプ | カウンタ |
|---|---|
ストレージ |
容量 - 予備のRAW容量 - 障害が発生したRAW |
ストレージ プール |
データ容量 - 使用済みデータ容量 - 合計その他の容量 - 使用済みその他の容量 - 合計容量 - 生の容量 - ソフト制限 |
内部容積 |
データ容量 - 使用済み データ容量 - 合計 その他の容量 - 使用済み その他の容量 - 合計 クローン保存容量 - 合計 |
Cloud Secure潜在的攻撃検出
Cloud Secure は、ランサムウェアなどの潜在的な攻撃を検出できるようになりました。アラート リスト ページでアラートをクリックすると、次の内容を示す詳細ページが開きます。
-
攻撃時間
-
関連ユーザーとファイルアクティビティ
-
取られた措置
-
セキュリティ侵害の可能性を追跡するのに役立つ追加情報
潜在的なランサムウェア攻撃を示すアラートページ: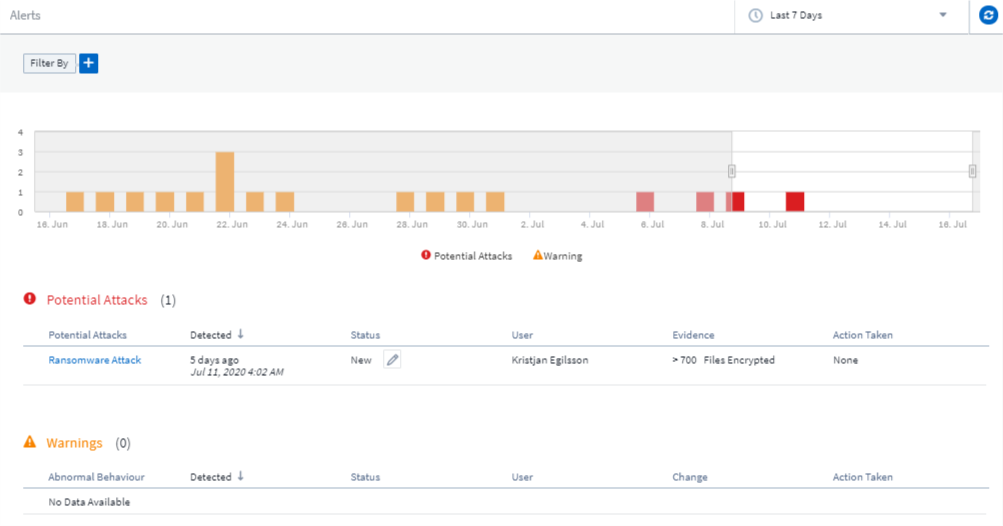
潜在的なランサムウェア攻撃の詳細ページ: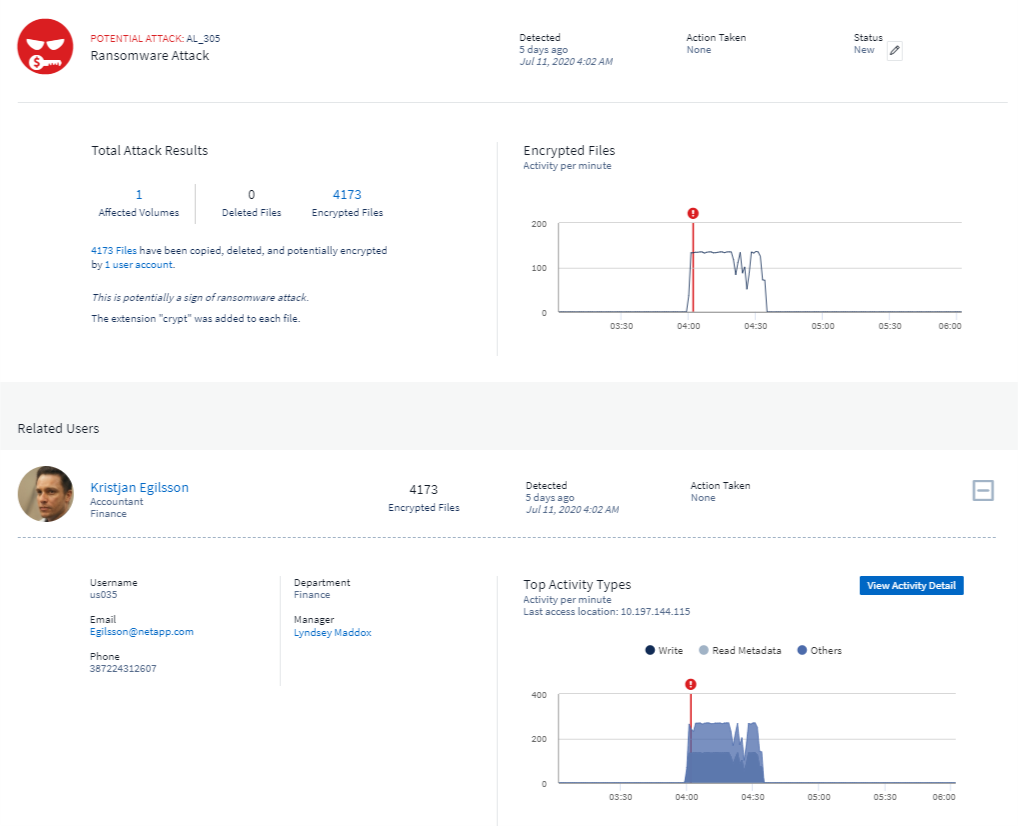
AWS 経由でプレミアムエディションをサブスクライブする
Cloud Insightsのトライアル期間中は、"セルフサブスクライブ" AWS Marketplace を通じてCloud Insights Standard Edition または Premium Edition にアップグレードできます。以前は、AWS Marketplace を通じて Standard Edition のみにセルフサブスクライブすることができました。
強化されたテーブルウィジェット
ダッシュボード/アセット ページのテーブル ウィジェットには、次の機能強化が含まれています。
-
「分割画面」ビュー: テーブル ウィジェットでは、左側にオブジェクト/グループが表示され、右側にオブジェクト データ (属性/メトリック) が表示されます。
-
複数属性のグループ化: 統合データ (Kubernetes、 ONTAP高度なメトリック、Docker など) の場合、グループ化に複数の属性を選択できます。データは、選択したグループ化属性に従って表示されます。
統合データによるグループ化(編集モードで表示):
-
インフラストラクチャ データ (ストレージ、EC2、VM、ポートなど) のグループ化は、以前と同様に単一の属性によって行われます。オブジェクトではない属性でグループ化する場合、テーブルではグループ行を展開してグループ内のすべてのオブジェクトを表示できます。
インフラストラクチャ データによるグループ化 (表示モードで表示):
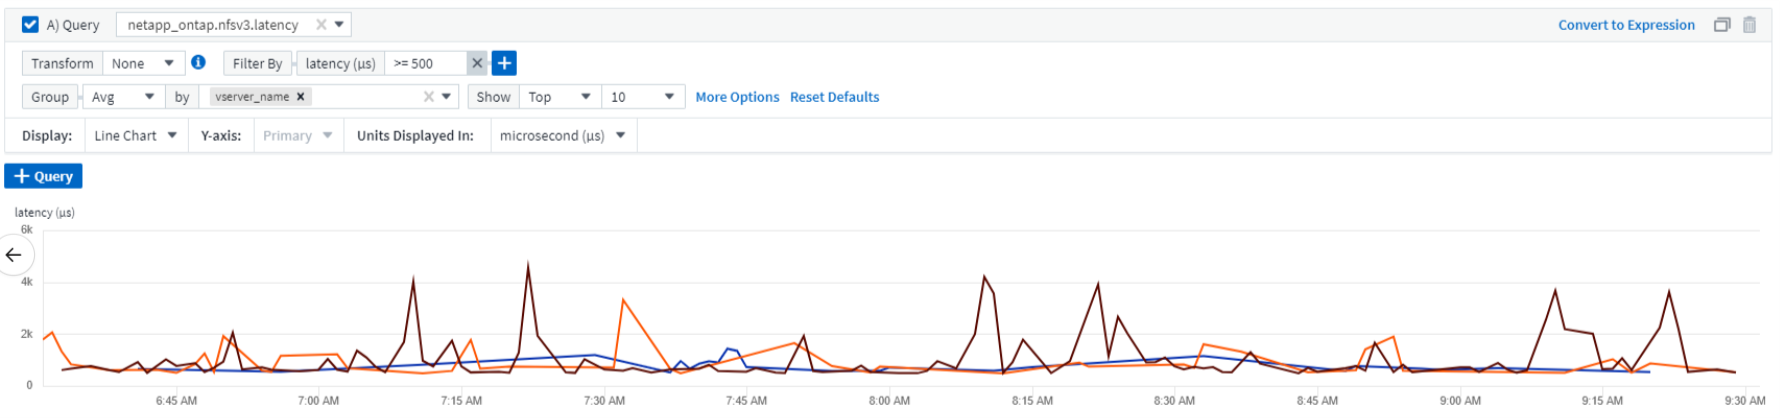
メトリクスフィルタリング
ウィジェット内のオブジェクトの属性に基づいてフィルタリングすることに加えて、メトリックに基づいてフィルタリングすることもできるようになりました。
統合データ (Kubernetes、 ONTAP Advanced Data など) を操作する場合、メトリック フィルタリングによって、プロットされたデータ シリーズから個別のデータ ポイントや一致しないデータ ポイントが削除されます。これは、インフラストラクチャ データ (ストレージ、VM、ポートなど) の場合、フィルタがデータ シリーズの集計値に対して機能し、チャートからオブジェクト全体が削除される可能性があるのとは異なります。
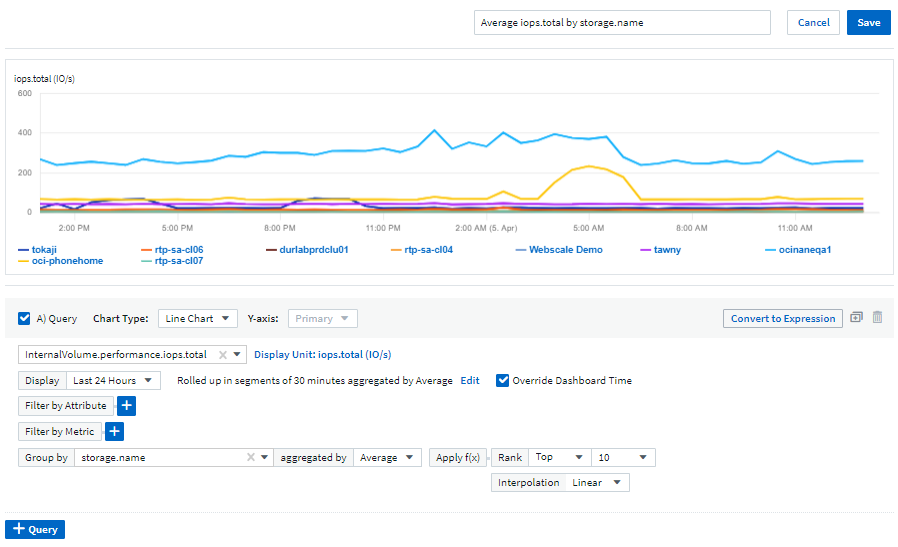
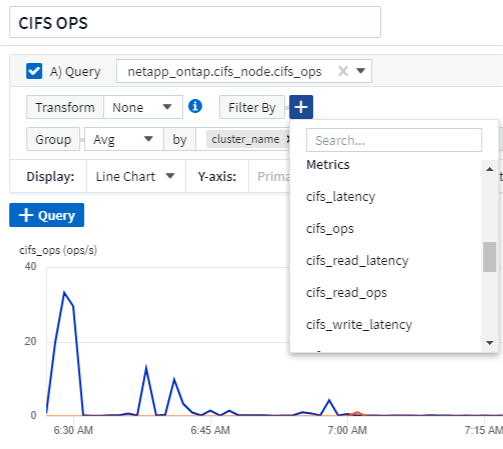
ONTAP高度なカウンタデータ
Cloud Insights は、 ONTAPデバイスから収集された多数のカウンターとメトリックを提供する、NetApp のONTAP固有の Advanced Counter Data を活用します。 ONTAP Advanced Counter Data は、すべてのNetApp ONTAP のお客様がご利用いただけます。これらのメトリックにより、Cloud Insightsウィジェットとダッシュボードでカスタマイズされた幅広い視覚化が可能になります。
ONTAPアドバンス カウンターは、ウィジェットのクエリで「netapp_ontap」を検索し、カウンターの中から選択することで見つかります。
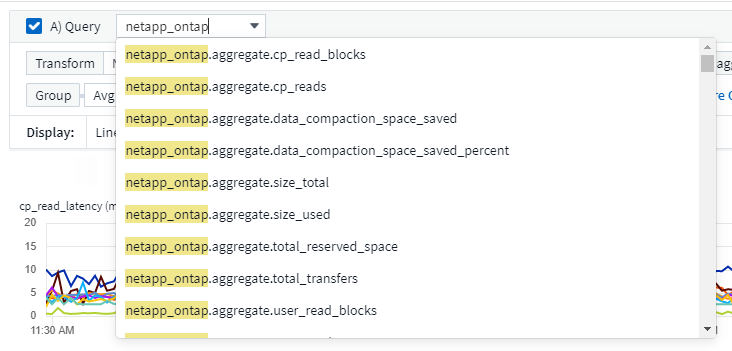
カウンター名の追加部分を入力することで、検索を絞り込むことができます。例えば:
-
lif
-
集計
-
オフボックス_vscan_サーバー
-
その他
以下の点にご注意ください。
-
新しいONTAPデータ コレクターでは、高度なデータ収集がデフォルトで有効になります。既存のONTAPデータ コレクターの高度なデータ収集を有効にするには、データ コレクターを編集し、[詳細構成] セクションを展開します。
-
高度なデータ収集は、7 モードONTAPでは使用できません。
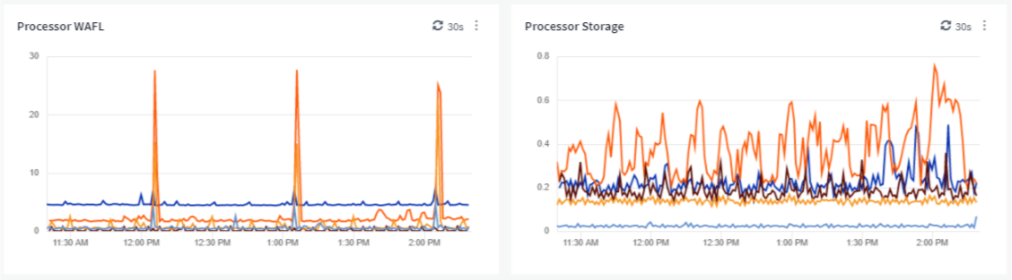
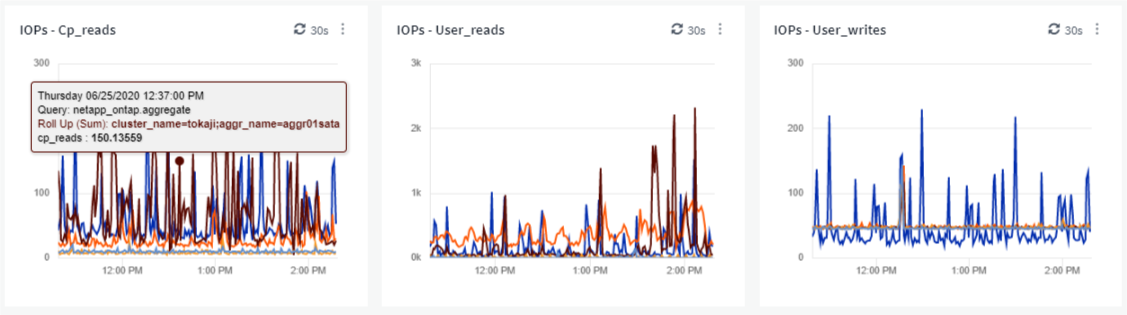
高度なカウンターダッシュボード
Cloud Insights には、Aggregate Performance、Volume Workload、Processor Activity などのトピックに関するONTAP Advanced Counters の視覚化を開始できるように、さまざまな事前設計されたダッシュボードが付属しています。少なくとも 1 つのONTAPデータ コレクターが設定されている場合は、任意のダッシュボード リスト ページのダッシュボード ギャラリーからこれらをインポートできます。
詳細情報
ONTAP Advanced Data の詳細については、次のリンクを参照してください。
-
https://mysupport.netapp.com/site/tools/tool-eula/netapp-harvest(注: NetAppサポートにサインインする必要があります)
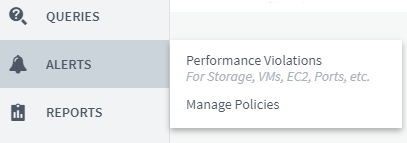
ポリシーと違反メニュー
パフォーマンス ポリシーと違反は、[アラート] メニューに表示されるようになりました。ポリシーと違反の機能は変更されていません。
更新されたTelegrafエージェント
Telegraf統合データの取り込みエージェントが更新されました"version 1.14"これにはバグ修正、セキュリティ修正、新しいプラグインが含まれます。
注意: Kubernetes プラットフォームで Kubernetes データ コレクターを構成するときに、「clusterrole」属性の権限が不十分なため、ログに「HTTP ステータス 403 禁止」エラーが表示される場合があります。
この問題を回避するには、エンドポイント アクセス クラスタロールの rules: セクションに次の強調表示された行を追加し、Telegraf ポッドを再起動します。
rules:
- apiGroups:
  - ""
  - apps
  - autoscaling
  - batch
  - extensions
  - policy
  - rbac.authorization.k8s.io
  attributeRestrictions: null
  resources:
  - nodes/metrics
  - nodes/proxy     <== Add this line
  - nodes/stats
  - pods            <== Add this line
  verbs:
  - get
  - list            <== Add this line
2020年6月
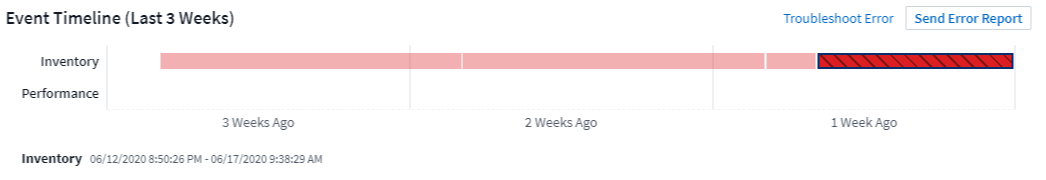
簡素化されたデータコレクターエラーレポート
データ コレクターのエラーの報告は、データ コレクター ページの [エラー レポートの送信] ボタンを使用すると簡単になります。ボタンをクリックすると、エラーに関する基本情報がNetAppに送信され、問題の調査が促されます。押すと、 Cloud Insights はNetAppに通知されたことを認識し、エラー レポート ボタンが無効になり、そのデータ コレクターのエラー レポートが送信されたことが示されます。ブラウザ ページが更新されるまで、ボタンは無効のままになります。
ウィジェットの改善
ダッシュボード ウィジェットに次の改善が加えられました。これらの改善はプレビュー機能とみなされており、すべてのCloud Insights環境で利用できるとは限りません。
-
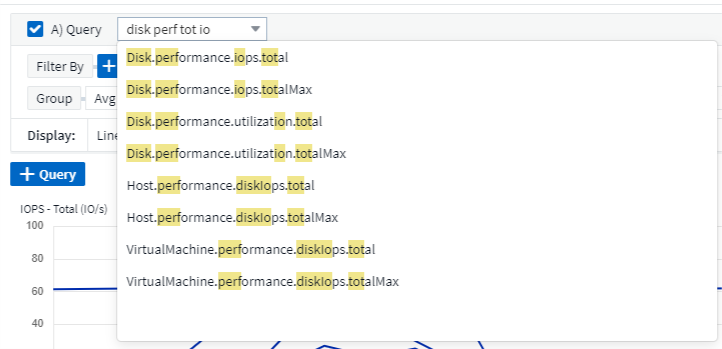
新しいオブジェクト/メトリック選択: オブジェクト (ストレージ、ディスク、ポート、ノードなど) とそれに関連するメトリック (IOPS、レイテンシ、CPU 数など) が、強力な検索機能を備えた単一の包括的なドロップダウンのウィジェットで利用できるようになりました。ドロップダウンに複数の部分的な用語を入力すると、 Cloud Insights はそれらの用語に一致するすべてのオブジェクト メトリックを一覧表示します。
-
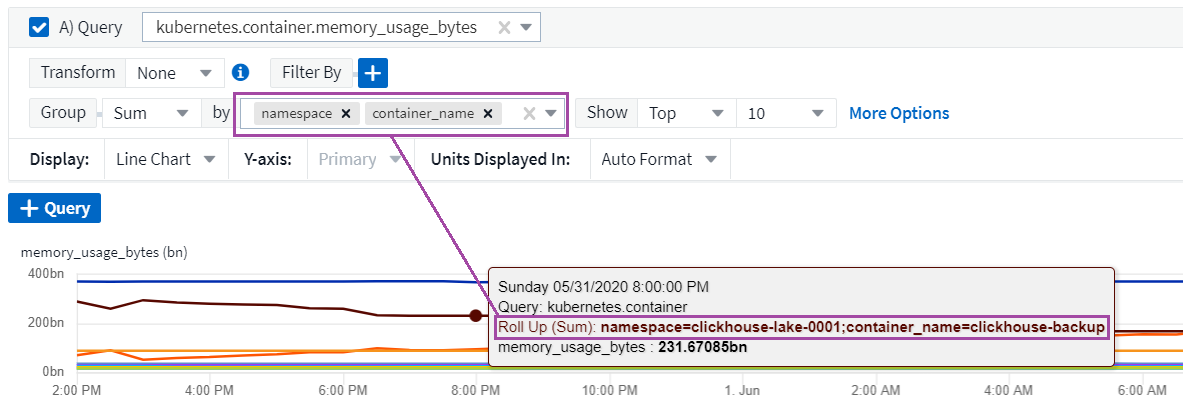
複数のタグのグループ化: 統合データ (Kubernetes など) を操作する場合、複数のタグ/属性でデータをグループ化できます。たとえば、Kubernetes 名前空間とコンテナ名によるメモリ使用量の合計などです。
2020年5月
ユーザーロールの報告
レポートに次のロールが追加されました:
-
Cloud Insightsのコンシューマー: レポートの実行と表示が可能
-
Cloud Insights Authors: Consumer 機能を実行できるほか、レポートやダッシュボードを作成および管理できます。
-
Cloud Insights管理者: 作成者機能とすべての管理タスクを実行できます
Cloud Secureアップデート
Cloud Insightsには、次のような最近のCloud Secure の変更が含まれています。
「フォレンジック > アクティビティ フォレンジック」ページには、ユーザー アクティビティを分析および調査するための 2 つのビューが用意されています。
-
アクティビティ ビュー、ユーザー アクティビティに重点を置きます (どのような操作ですか?)どこで行われましたか?
-
ユーザーがアクセスしたファイルに焦点を当てたエンティティ ビュー。
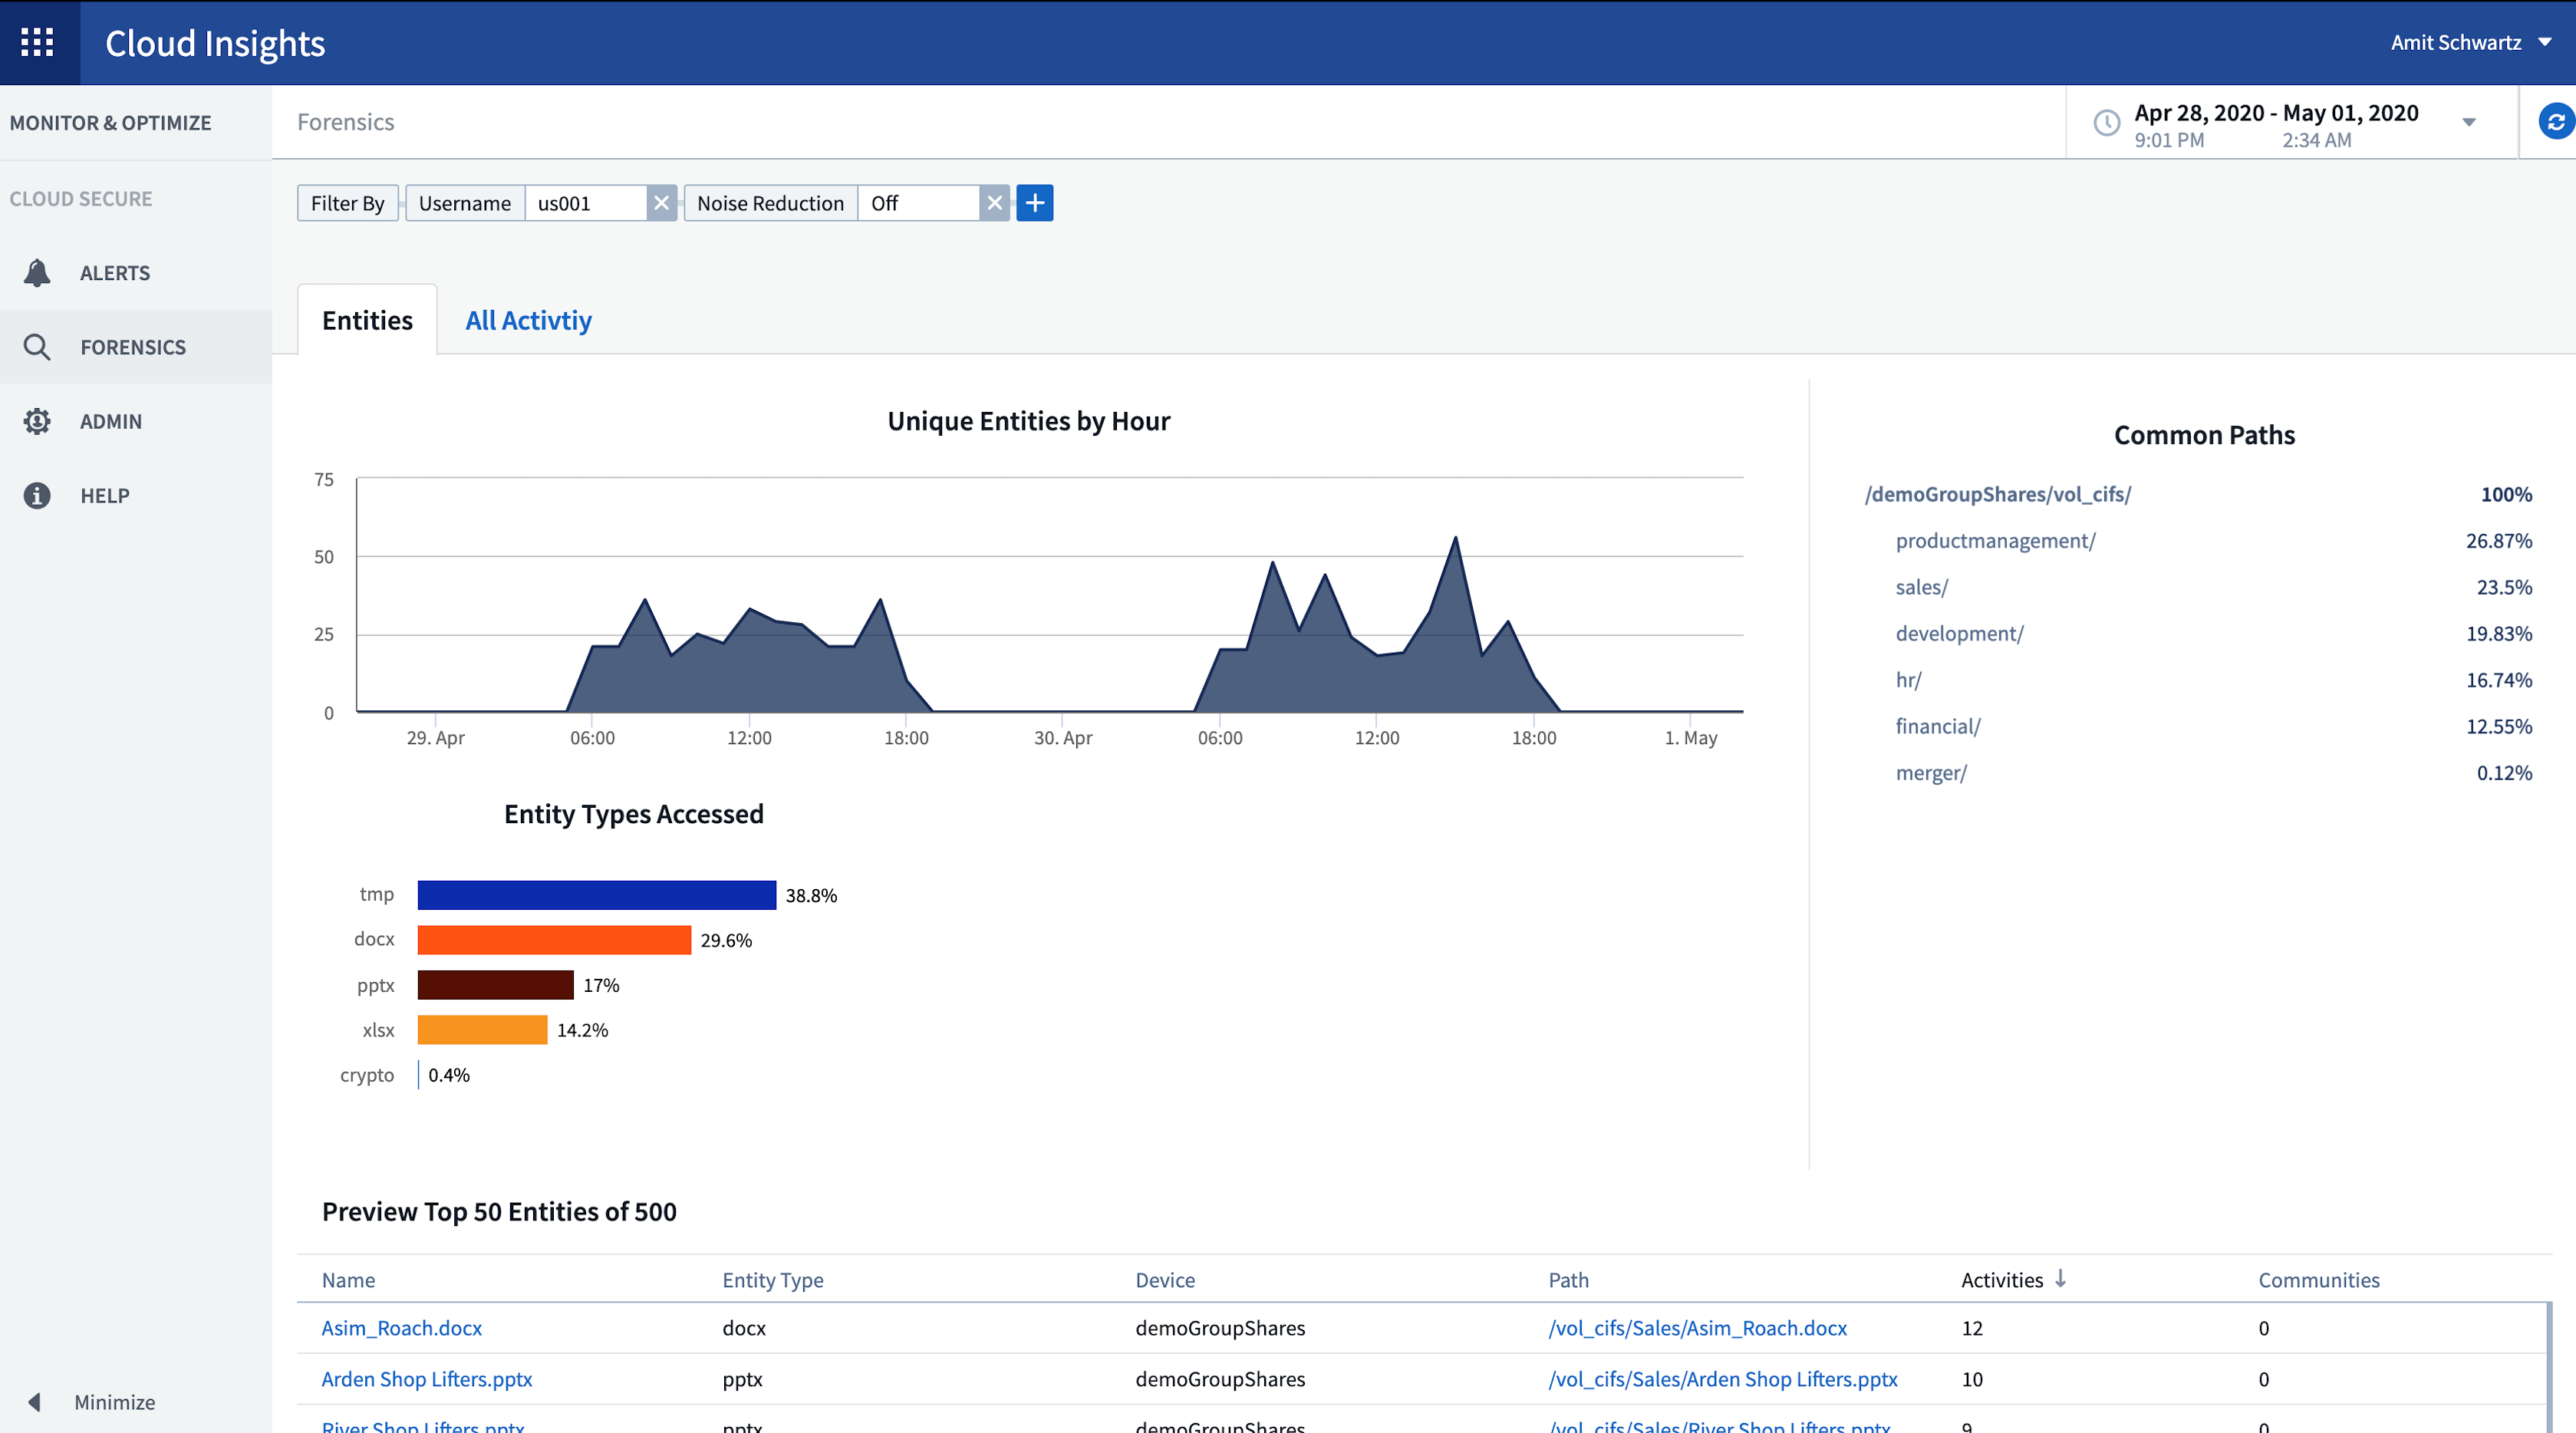
さらに、アラート電子メール通知にアラート ページへの直接リンクが含まれるようになりました。
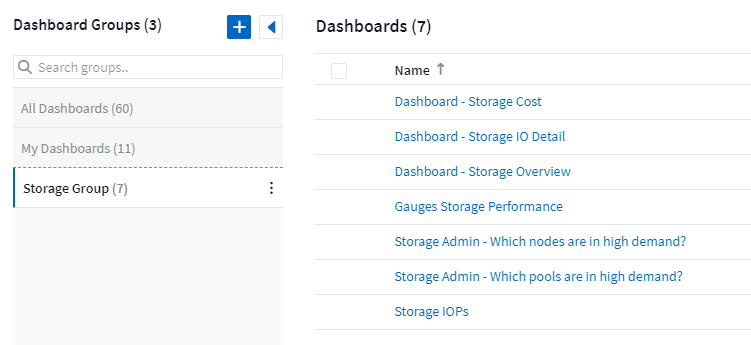
ダッシュボードのグループ化
ダッシュボードのグループ化により、"ダッシュボードの管理"あなたにとって関連性のあるものです。関連するダッシュボードをグループに追加して、たとえばストレージや仮想マシンを「ワンストップ」で管理できます。
グループはユーザーごとにカスタマイズされるため、あるユーザーのグループは他のユーザーのグループと異なる場合があります。グループは必要なだけ作成でき、各グループ内のダッシュボードの数も必要なだけ増やすことができます。
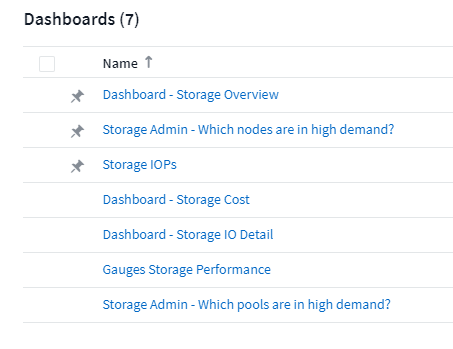
ダッシュボードのピン留め
ダッシュボードをピン留めすると、お気に入りが常にリストの上部に表示されます。
TVモードと自動更新
"TVモードと自動更新"ダッシュボードまたはアセット ページでデータをほぼリアルタイムで表示できるようになります。
-
TV モード では、すっきりとした表示が実現します。ナビゲーション メニューは非表示になり、データ表示用の画面領域が広がります。
-
ダッシュボードとアセット ランディング ページ上のウィジェットのデータは、選択したダッシュボードの時間範囲 (またはダッシュボードの時間を上書きするように設定されている場合、ウィジェットの時間範囲) によって決まる更新間隔 (最短 10 秒ごと) に従って 自動更新 されます。
TV モードと自動更新を組み合わせることで、 Cloud Insightsデータのライブ ビューが提供され、シームレスなデモンストレーションや社内監視に最適です。
2020年4月
新しいダッシュボードの時間範囲の選択肢
ダッシュボードやその他の Cloud Insights ページの時間範囲の選択肢に、過去 1 時間 と 過去 15 分 が含まれるようになりました。
Cloud Secureアップデート
Cloud Insightsには、次のような最近のCloud Secure の変更が含まれています。
-
ファイルとフォルダーのメタデータの変更認識が向上し、ユーザーが権限、所有者、またはグループの所有権を変更したかどうかを検出できるようになりました。
-
ユーザーアクティビティレポートを CSV にエクスポートします。
Cloud Secure は、ファイルとフォルダーに対するすべてのユーザー アクセス操作を監視および監査します。アクティビティ監査により、社内のセキュリティ ポリシーに準拠し、PCI、GDPR、HIPAA などの外部コンプライアンス要件を満たし、データ侵害やセキュリティ インシデントの調査を実施できます。
デフォルトのダッシュボード時間
ダッシュボードのデフォルトの時間範囲は、24 時間ではなく 3 時間になりました。
最適化された集約時間
最適化"時間集約"時系列ウィジェット (折れ線グラフ、スプライン グラフ、面グラフ、積み上げ面グラフ) の間隔が 3 時間および 24 時間のダッシュボード/ウィジェットの時間範囲でより頻繁になり、データのグラフ化が高速化されます。
-
3 時間の時間範囲は 1 分の集約間隔に最適化されます。以前は5分でした。
-
24 時間の時間範囲は 30 分の集約間隔に最適化されます。以前は1時間でした。
カスタム間隔を設定することで、最適化された集計をオーバーライドすることもできます。
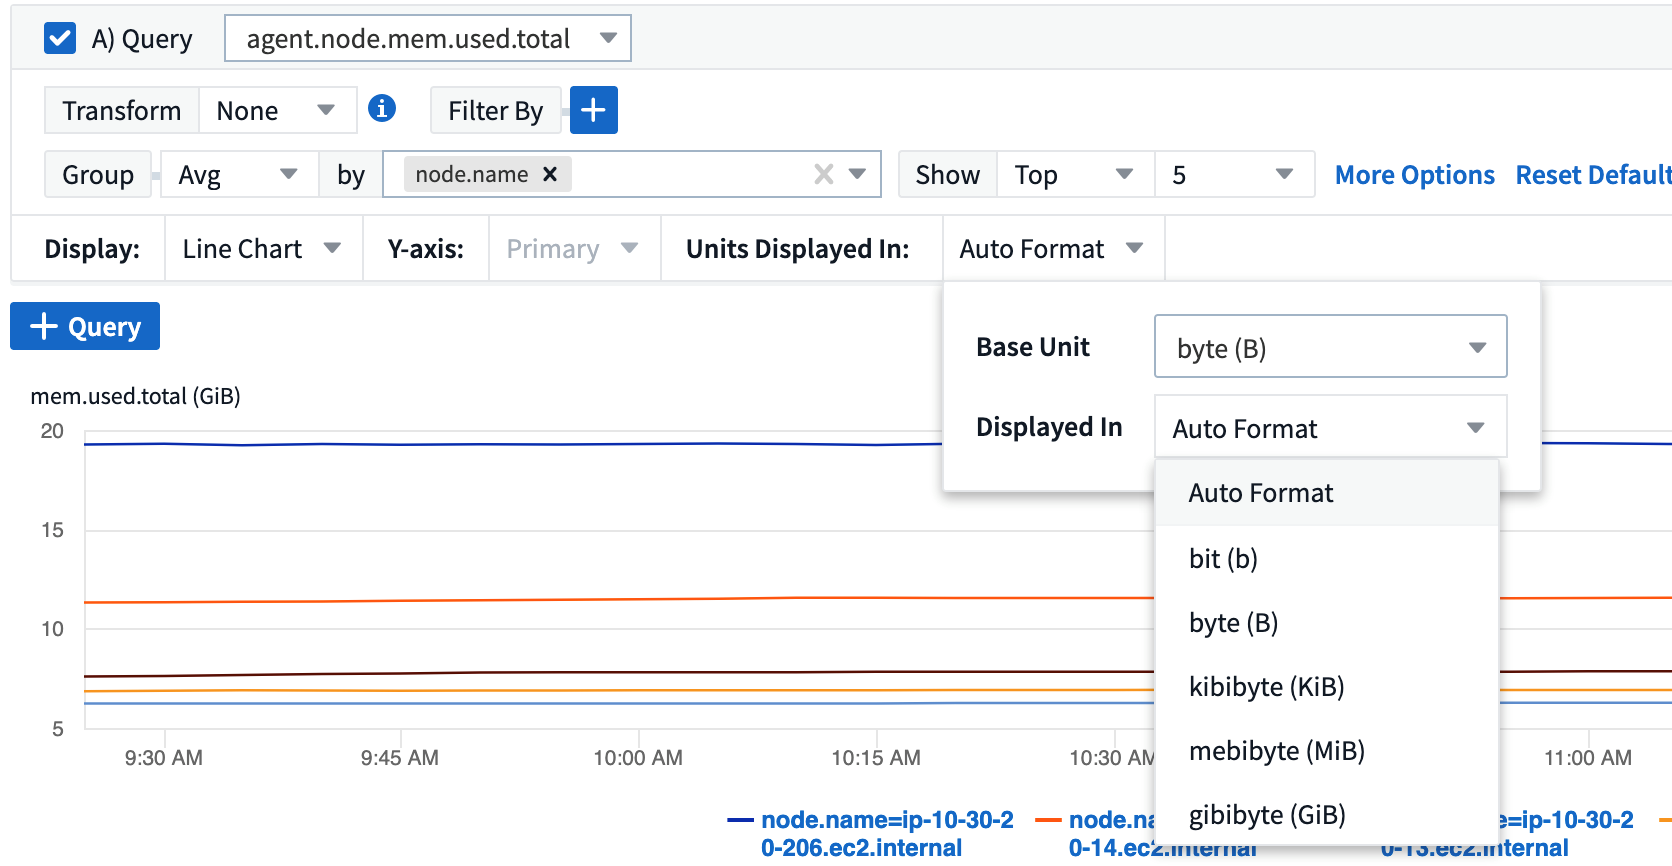
表示単位の自動フォーマット
ほとんどのウィジェットでは、 Cloud Insightsは値を表示する基本単位(例えば、メガバイト、千、パーセント、_ミリ秒(ms)_など)を認識しており、"自動的にフォーマットする"ウィジェットを最も読みやすい単位にします。たとえば、1,234,567,890 バイトのデータ値は、1.23 ギビバイトに自動的にフォーマットされます。多くの場合、 Cloud Insights は取得されるデータに最適な形式を認識しています。最適な形式が不明な場合、または自動書式設定を上書きするウィジェットの場合は、必要な形式を選択できます。
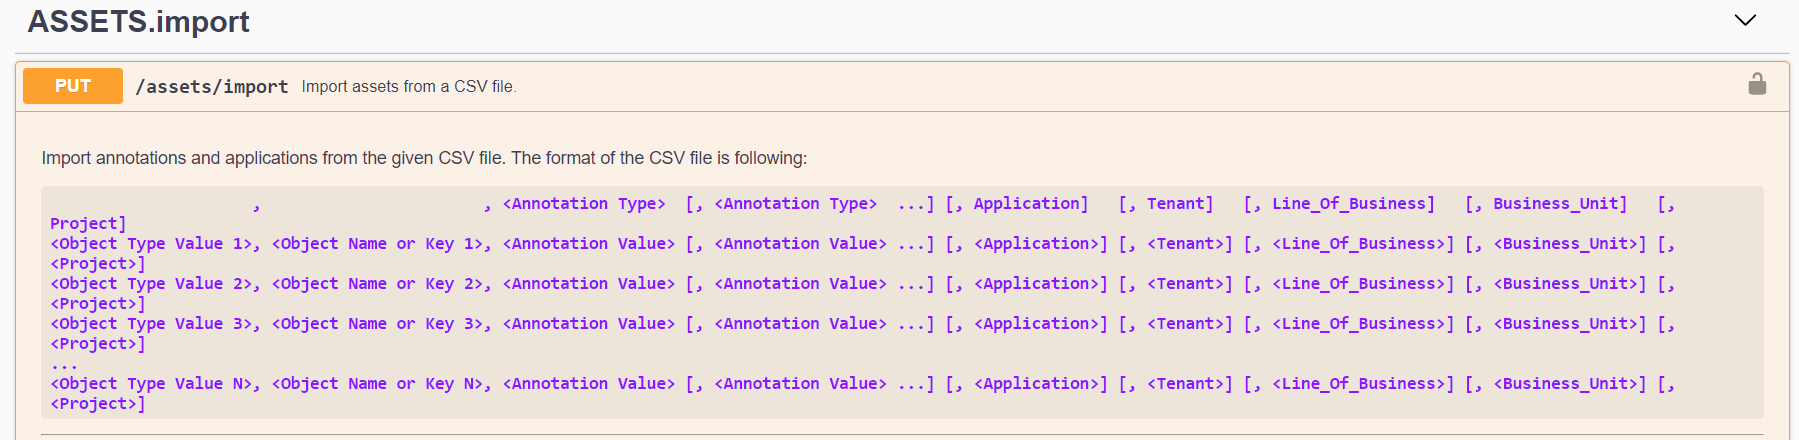
APIを使用して注釈をインポートする
Cloud Insights Premium Editionの強力なAPIを使用すると、"インポート注釈" .CSV ファイルを使用してオブジェクトに割り当てます。同様の方法でアプリケーションをインポートし、ビジネス エンティティを割り当てることもできます。
よりシンプルなウィジェットセレクター
ダッシュボードやアセットランディングページへのウィジェットの追加が、すべてのウィジェットタイプを一括表示できる新しいウィジェットセレクターによってさらに簡単になりました。ユーザーはウィジェットタイプのリストをスクロールして追加したいウィジェットを探す必要がなくなりました。新しいセレクターでは、関連ウィジェットが色分けされ、近接性に基づいてグループ化されています。
2020年2月
プレミアムエディションのAPI
Cloud Insights Premium Editionには、"強力なAPI" Cloud Insights をCMDB や他のチケット システムなどの他のアプリケーションと統合するために使用できます。
詳細な Swagger ベースの情報は、管理 > API アクセス の API ドキュメント リンクにあります。 Swagger は API の簡単な説明と使用方法の情報を提供するため、自分の環境で各 API を試すことができます。
Cloud Insights API は、アクセス トークンを使用して、ASSETS や COLLECTION などの API カテゴリへの権限ベースのアクセスを提供します。
データコレクター追加後の初期ポーリング
以前は、新しいデータ コレクターを構成すると、 Cloud Insights はデータ コレクターをすぐにポーリングして インベントリ データを収集していましたが、構成されたパフォーマンス ポーリング間隔 (通常は 15 分) まで待機して、初期の パフォーマンス データを収集していました。その後、2 回目のパフォーマンス ポーリングを開始する前に別の間隔を待機するため、新しいデータ コレクターから意味のあるデータが取得されるまでに最大 30 分かかります。
データ収集者"投票"大幅に改善され、最初のパフォーマンス ポーリングはインベントリ ポーリングの直後に実行され、2 番目のパフォーマンス ポーリングは最初のパフォーマンス ポーリングの完了後数秒以内に実行されるようになりました。これにより、 Cloud Insights は非常に短時間でダッシュボードやグラフに有用なデータを表示できるようになります。
このポーリング動作は、既存のデータ コレクターの構成を編集した後にも発生します。
ウィジェットの複製が簡単に
ダッシュボードやランディング ページでウィジェットのコピーを作成するのがこれまで以上に簡単になりました。ダッシュボードの編集モードで、ウィジェットのメニューをクリックし、「複製」を選択します。ウィジェット エディターが起動し、元のウィジェットの構成が事前に入力され、ウィジェット名に「コピー」サフィックスが付きます。必要な変更を簡単に行い、新しいウィジェットを保存できます。ウィジェットはダッシュボードの下部に配置され、必要に応じて配置できます。すべての変更が完了したら、ダッシュボードを必ず保存してください。

シングルサインオン(SSO)
Cloud Insights Premium Editionでは、管理者は*"シングルサインオン" * 企業ドメイン内のすべてのユーザーが、個別に招待することなくCloud Insightsに (SSO) アクセスできるようになります。 SSO を有効にすると、同じドメインのメール アドレスを持つすべてのユーザーが、企業の認証情報を使用してCloud Insightsにログインできるようになります。
|
|
SSO はCloud Insights Premium Edition でのみ使用可能であり、 Cloud Insightsで有効にする前に構成する必要があります。 SSO設定には以下が含まれます"アイデンティティ フェデレーション"NetApp Cloud Central を通じて。フェデレーションにより、シングル サインオン ユーザーは、企業ディレクトリの資格情報を使用してNetApp Cloud Central アカウントにアクセスできるようになります。 |
2020年1月
REST API の Swagger ドキュメント
Swagger では、 Cloud Insightsで利用可能な各 REST API と、その使用方法および構文について説明します。 Cloud Insights APIに関する情報は、"ドキュメント" 。
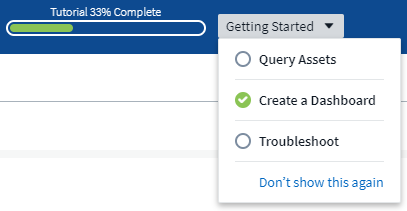
機能チュートリアルの進捗バー
機能チュートリアルのチェックリストは上部のバナーに移動され、進行状況インジケーターが追加されました。チュートリアルは、終了するまで各ユーザーが利用でき、 Cloud Insightsでいつでも利用できます。"ドキュメント" 。
取得ユニットの変更
すでにインストールされている AU と同じ名前の Acquisition Unit (AU) をホストまたは VM にインストールする場合、 Cloud Insights はAU 名に「_1」、「_2」などを追加して一意の名前を保証します。これは、最初にCloud Insightsから AU を削除せずに、同じ VM から AU をアンインストールして再インストールする場合にも当てはまります。まったく別の AU 名をご希望ですか? 問題ありません。AU はインストール後に名前を変更できます。
ウィジェットにおける時間集計の最適化
ウィジェットでは、_最適化された_時間集約間隔または設定した_カスタム_間隔を選択できます。最適化された集計では、選択したダッシュボードの時間範囲 (ダッシュボードの時間を上書きする場合はウィジェットの時間範囲) に基づいて、適切な時間間隔が自動的に選択されます。ダッシュボードまたはウィジェットの時間範囲が変更されると、間隔は動的に変化します。
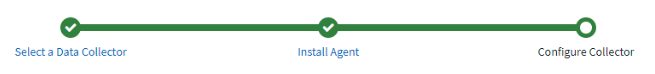
簡素化された「 Cloud Insightsを使い始める」プロセス
Cloud Insightsの使用を開始するためのプロセスが簡素化され、初回のセットアップがよりスムーズかつ簡単になりました。最初のデータコレクターを選択して、指示に従うだけです。 Cloud Insights、データ コレクターと、必要なエージェントまたは取得ユニットの構成手順を説明します。ほとんどの場合、1 つ以上の初期ダッシュボードがインポートされるため、環境の状況をすぐに把握できるようになります (ただし、 Cloud Insights が意味のあるデータを収集するまでに最大 30 分かかる場合があります)。
追加の改善点:
-
取得ユニットのインストールがより簡単になり、実行速度も速くなります。
-
アルファベット順のデータ コレクターの選択肢により、探しているデータ コレクターを簡単に見つけることができます。
-
改善されたデータ コレクターのセットアップ手順がわかりやすくなりました。
-
経験豊富なユーザーは、ボタンをクリックするだけで開始プロセスをスキップできます。
-
新しい進行状況バーに、プロセスの進行状況が表示されます。