

 Get started
Creating a report to view aggregates that have the most available IOPS
 Suggest changes
-
 PDF of this doc site
-
Perform configuration and administrative tasks
-
Monitor and manage storage
-
Monitor and manage cluster performance
-
Monitor and manage cluster health
-
Collection of separate PDF docs
Creating your file...
This report shows which aggregates have the most available IOPS per aggregate type on which you can provision new workloads.
What you'll need
-
You must have the Application Administrator or Storage Administrator role.
Use the following steps to open a Health: All Volumes view, download the view in Excel, create an available capacity chart, upload the customized Excel file, and schedule the final report.
-
In the left navigation pane, click Storage > Aggregates.
-
Select Performance: All Aggregates from the View drop-down.
-
Select Show/Hide to show the
Available IOPScolumn and hide theCluster FQDN, Inactive Data Reporting,andThreshold Policycolumns. -
Drag and drop the
Available IOPSandFree Capacitycolumns next to theTypecolumn. -
Name and save the custom view
Available IOPS Per Aggr. -
Select Reports > Download Excel.
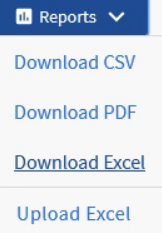
Depending on your browser, you might need to click OK to save the file.
-
If needed, click Enable Editing.
-
In Excel, open the downloaded file.
-
On the data sheet, click the little triangle at the top-left of the sheet to select the entire sheet.
-
On the Data ribbon, select Sort from the
Sort & Filter area. -
Set the following sort levels:
-
Specify the Sort by as
Available IOPS(IOPS), the Sort On asCell Values,and the Order asLargest to Smallest. -
Click Add Level.
-
Specify the Sort by as
Type, the Sort On asCell Values,and the Order asZ to A. -
Click Add Level.
-
Specify the Sort by as
Free Capacity (GB),the Sort On asCell Values,and the Order asLargest to Smallest. -
Click OK.
-
-
Save and close the Excel file.
-
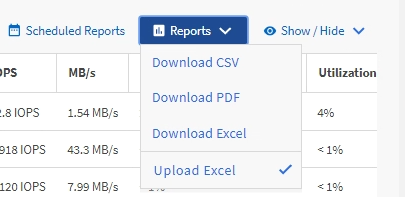
In Unified Manager, select Reports > Upload Excel.

Make sure you are in the same view where you downloaded the Excel file.
-
Select the Excel file you have modified, in this case
performance-aggregates-<date>.xlsx. -
Click Open.
-
Click Submit.
A check mark appears beside the Reports > Upload Excel menu item.
-
Click Scheduled Reports.
-
Click Add Schedule to add a new row to the Report Schedules page so that you can define the schedule characteristics for the new report.
-
Enter a name for the report schedule and complete the other report fields, then click the check mark (
 ) at the end of the row.
Select the XLSX format for the report.
The report is sent immediately as a test. After that, the report generates and is sent by email to the recipients listed using the specified frequency.
Based on the results shown in the report, you might want to provision new workloads on the aggregates that have the greatest available IOPS.