Understanding the Health overview dashboard
 Suggest changes


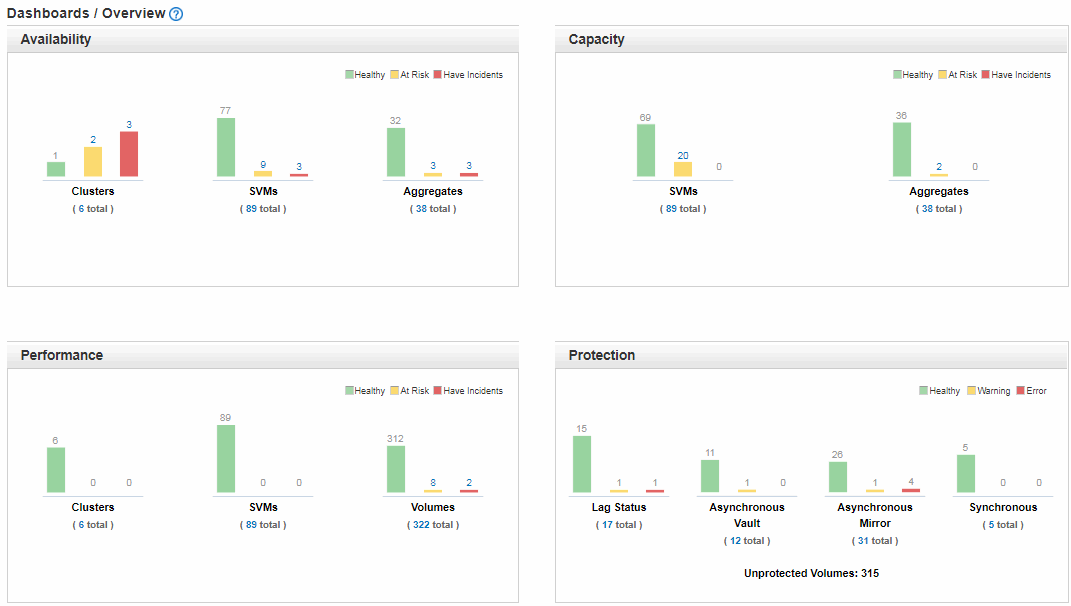
The Unified Manager Health overview dashboard provides cumulative at-a-glance information about the health of your storage and virtualized environment. The Dashboards/Overview page provides health information about your storage objects separated into four health categories; availability, capacity, performance, and protection of the storage objects.
The following image illustrates the panes that are displayed on Dashboards/Overview page:

Health Overview area
Displays, as a graph, information about the health of your storage objects such as clusters, aggregates, and storage virtual machines (SVMs), and the health of your protection relationships. The Dashboards/Overview page displays events generated for the following categories:
Clicking on the number above any of the yellow or red bar charts displays the Events inventory page including only those events. Clicking on the number below any of the charts displays the object inventory page including only those objects.
-
Availability
Displays information about the availability of clusters, SVMs, and aggregates that are monitored by Unified Manager. Based on the availability-related events that are generated, the storage objects are categorized as Healthy, At Risk, or Have Incidents.
-
Capacity
Displays information about the capacity of SVMs and aggregates that are monitored by Unified Manager. Based on the capacity-related events that are generated, the storage objects are categorized as Healthy, At Risk, or Have Incidents.
-
Performance
Displays information about the performance of clusters, SVMs, and volumes that are monitored by Unified Manager. Based on the performance-related incidents that are generated, the storage objects are categorized as Healthy, At Risk, or Have Incidents.
-
Protection
Displays information about the protection relationships that are monitored by Unified Manager. Based on the protection-related events that are generated, the protection relationships are categorized as Healthy, Warning, or Error.


