

Test results
 Suggest changes
Testing consisted of running the FIO workloads to measure the FC-NVMe performance in terms of IOPS and latency.
The following graph illustrates our findings when running a 100% random read workload using 8KB block sizes.
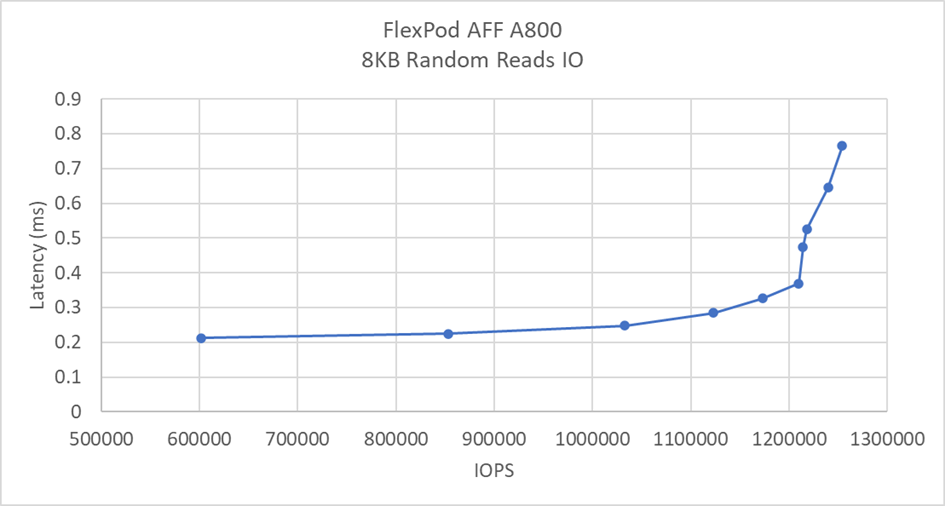
In our testing, we found that the system achieved over 1.2M IOPS while maintaining just under 0.35ms of server-side latency.
The following graph illustrates our findings when running a 100% random write workload using 8KB block sizes.
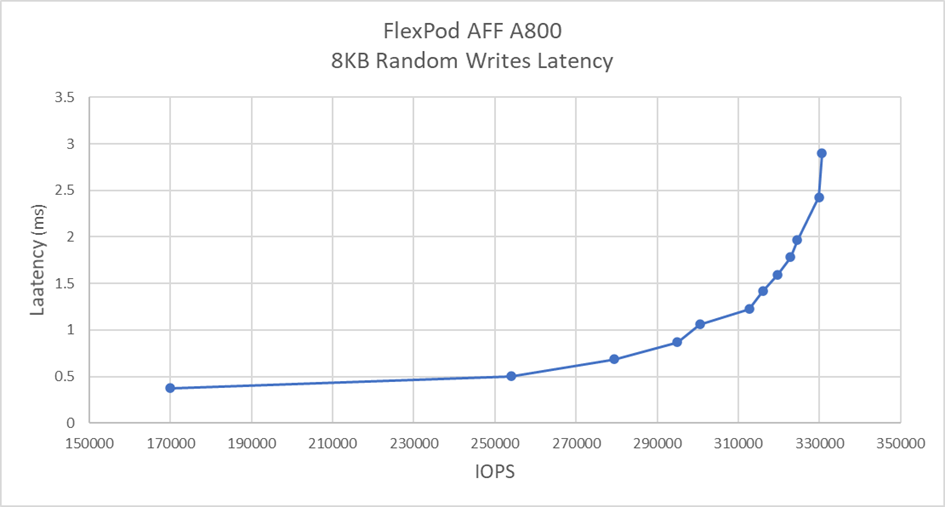
In our testing, we found that the system achieved close to 300k IOPS while maintaining just under 1ms of server-side latency.
For 8KB block size with 80% random reads and 20% writes, we observed the following results:
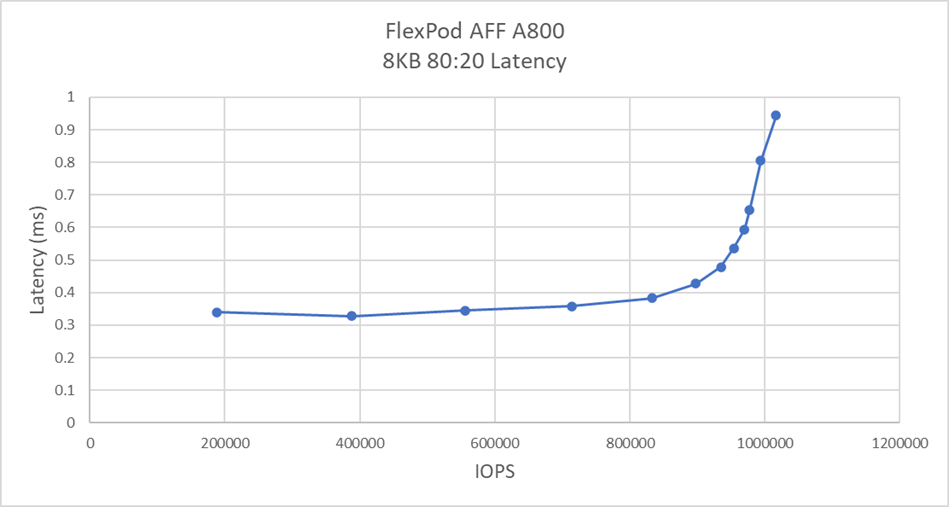
In our testing, we found that the system achieved over 1M IOPS while maintaining just under 1ms of server-side latency.
For 64KB block size and 100% sequential reads, we observed the following results:
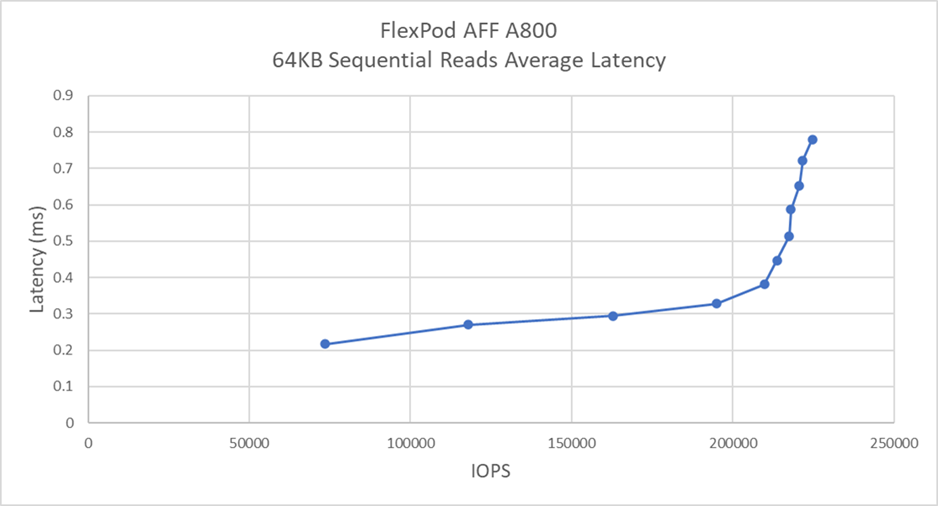
In our testing, we found that the system achieved around 250k IOPS while maintaining just under 1ms of server-side latency.
For 64KB block size and 100% sequential writes, we observed the following results:
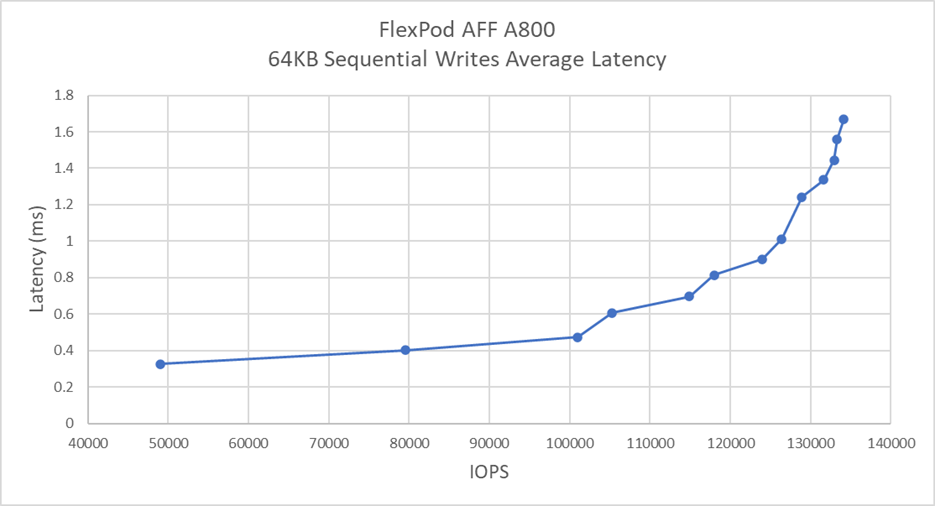
In our testing, we found that the system achieved around 120k IOPS while maintaining under 1ms of server-side latency.