Expert view
 Suggest changes


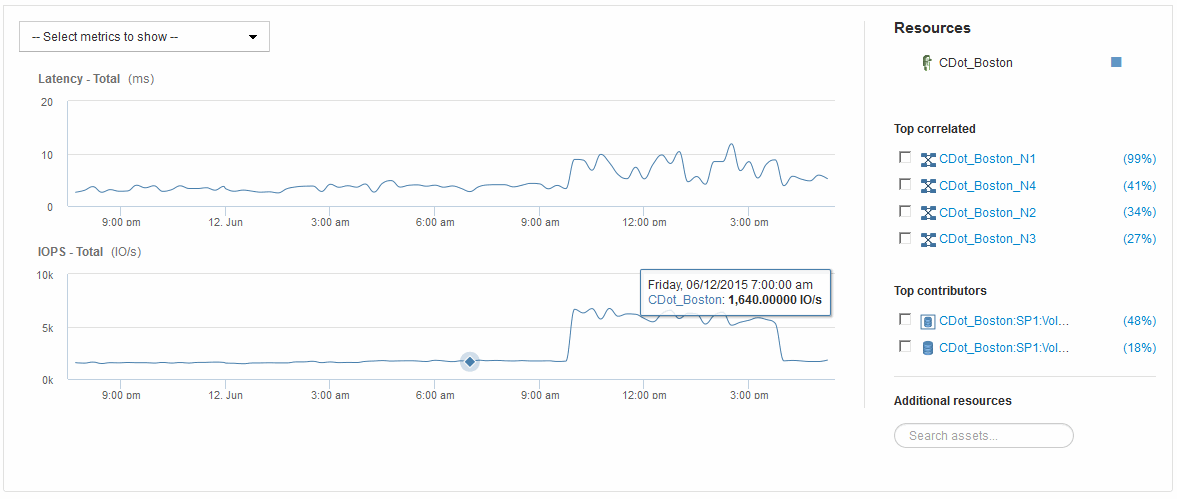
The Expert View section of an asset page enables you to view a performance sample for the base asset based on any number of applicable metrics in context with a chosen time period (3 hours, 24 hours, 3 days, 7 days, or a custom time period) in the performance chart and any assets related to it.
The following is an example of the Expert View section in a volume asset page:

You can select the metrics you want to view in the performance chart for the time period selected.
The Resources section shows the name of the base asset and the color representing the base asset in the performance chart. If the Top Correlated section does not contain an asset you want to view in the performance chart, you can use the Search assets box in the Additional resources section to locate the asset and add it to the performance chart. As you add resources, they appear in the Additional resources section.
Also shown in the Resources section, when applicable, are any assets related to the base asset in the following categories:
-
Top correlated
Shows the assets that have a high correlation (percentage) with one or more performance metrics to the base asset.
-
Top contributors
Shows the assets that contribute (percentage) to the base asset.
-
Greedy
Shows the assets that take away system resources from the asset through sharing the same resources, such as hosts, networks, and storage.
-
Degraded
Shows the assets that are depleted of system resources due to this asset.


