Create dashboards to monitor thin provisioned environments
 Suggest changes


OnCommand Insight's flexible dashboard widget design and display charting options allow deep analysis into capacity usage and utilization, strategic information for minimizing risks in thin provisioned data center infrastructures.
You can create dashboards that provide access to Datastore and Storage pool information that you want to monitor.
Using dashboards to access Datastore information
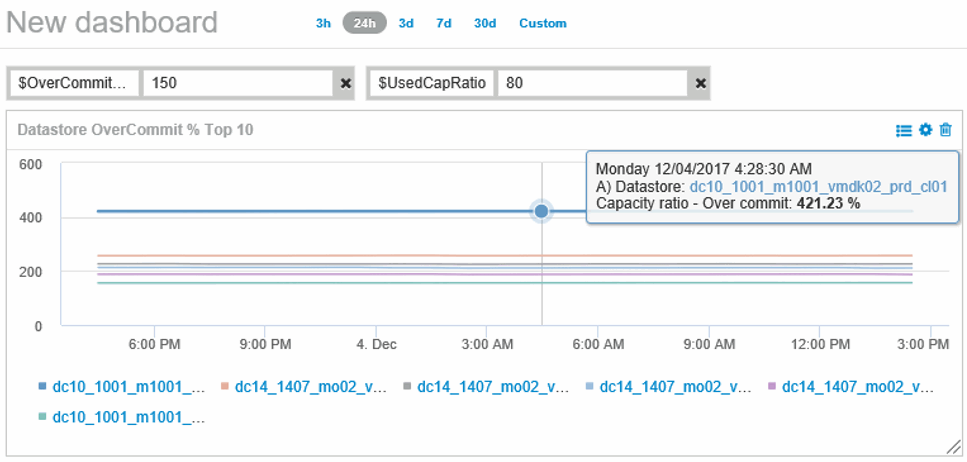
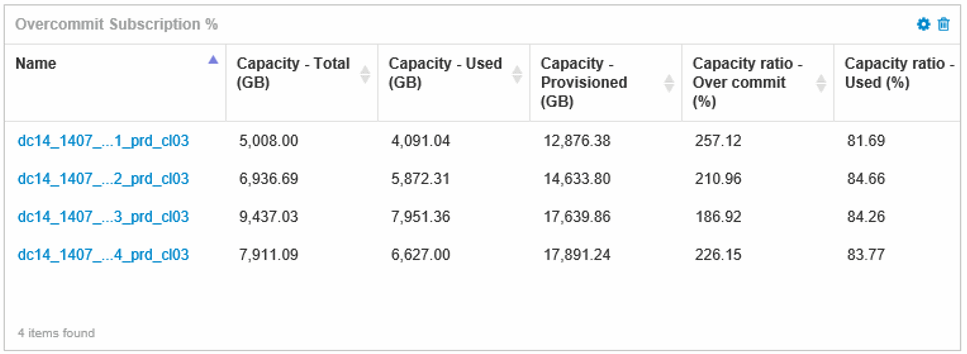
You might want to create dashboards that provide quick access to the data you want to monitor in your virtual infrastructure. A dashboard could include widgets similar to the following to identify the top 10 Datastores based on their overcommitted % and a widget showing the capacity data for Datastores. The dashboards use variables to highlight Datastores that are overcommitted by more than 150% and Datastores that have exceeded more than 80% used capacity.


Additional widgets that could be used to monitor your thin-provisioned environment could include some of the following information:
-
VMDK capacities correlated to Datastores
-
VM capacities
-
Data store capacity used trending
Using dashboards to access Storage pool information
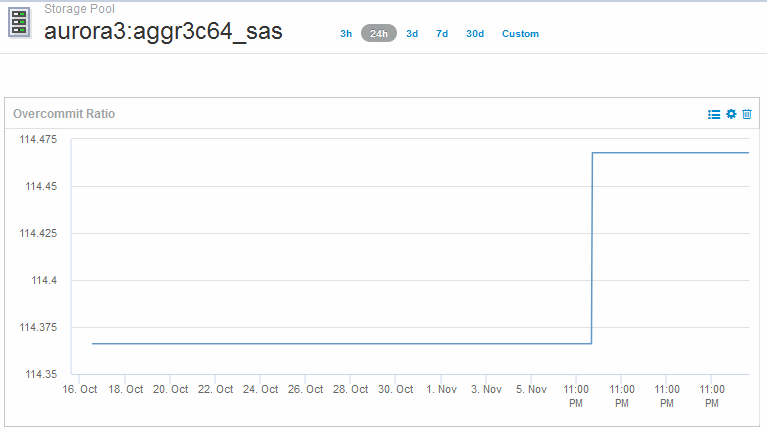
A dashboard could include widgets similar to the following, identifying the amount of physical storage capacity used, or identifying the overcommitted capacity for a Storage Pool.


