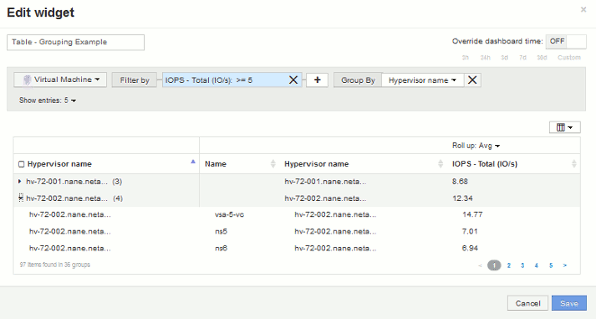
Grouping example (with rollup explained)
 Suggest changes


Table widgets allow you to group data for easier display.
About this task
In this example, we will create a table widget showing all VMs grouped by Data Center.
Steps
-
Create or open a dashboard, and add a Table widget.
-
Select Virtual Machine as the asset type for this widget.
-
Click on the Column Selector
 and choose Hypervisor name and IOPS - Total.
Those columns are now displayed in the table.
-
Let's disregard any VM's with no IOPS, and include only VMs that have total IOPS greater than 1. Click the Filter by + button and select IOPS - Total. Click on Any, and in the from field, type 1. Leave the to field empty. Click the check button to apply the filter.
The table now shows all VMs with Total IOPS greater than or equal to 1. Notice that there is no grouping in the table. All VMs are shown.
-
Glick the Group by + button.
Because All is selected as the grouping method by default, all VMs are moved into a single group named “All”.
-
Above the IOPS - Total column is now a Roll up option. The default roll up method is Avg. This means that the number shown for the group is the average of all the Total IOPS reported for each VM inside the group. You can choose to roll this column up by Avg, Sum, Min or Max. Each column that you display that contains performance metrics can be rolled up individually.
-
Click All and select Hypervisor name.
The VM list is now grouped by Hypervisor. You can expand each hypervisor to view the VMs hosted by it.

-
Click Save to save the table to the dashboard. You can resize the widget.
-
Click Save to save the dashboard.


