

Use an expression to identify alternate metrics
 Suggest changes
You can use expressions to view metrics not provided by the web UI, such as the IOPS that are system overhead generated.
About this task
You might want use an expression to show total IOPS generated by non-read or non-write operations, such as overhead operations for an internal volume.
Steps
-
Add a widget to the dashboard. Choose Area chart.
-
Change the default device to Internal volume: Click Storage > Internal volume > IOPS Write
-
Click the Convert to Expression button.
-
The IOPS - Write metric is now in the alphabetic variable field “a”.
-
In the “b” variable field, click Select and choose IOPS - Read.
-
In the Expression field, type a + b. In the Display section, chooseArea chart for the expression.
-
In the Filter by field, enter the name of the internal volume you are analyzing.
-
The Label field identifies the expression. Change the label to something meaningful like “R + W IOPS”.
-
Click +Addto add a line for total IOPS to the widget.
-
Change the default device to Internal volume: Click Storage > Internal volume > IOPS Total
-
In the Filter by field, enter the name of the internal volume you analyzing.
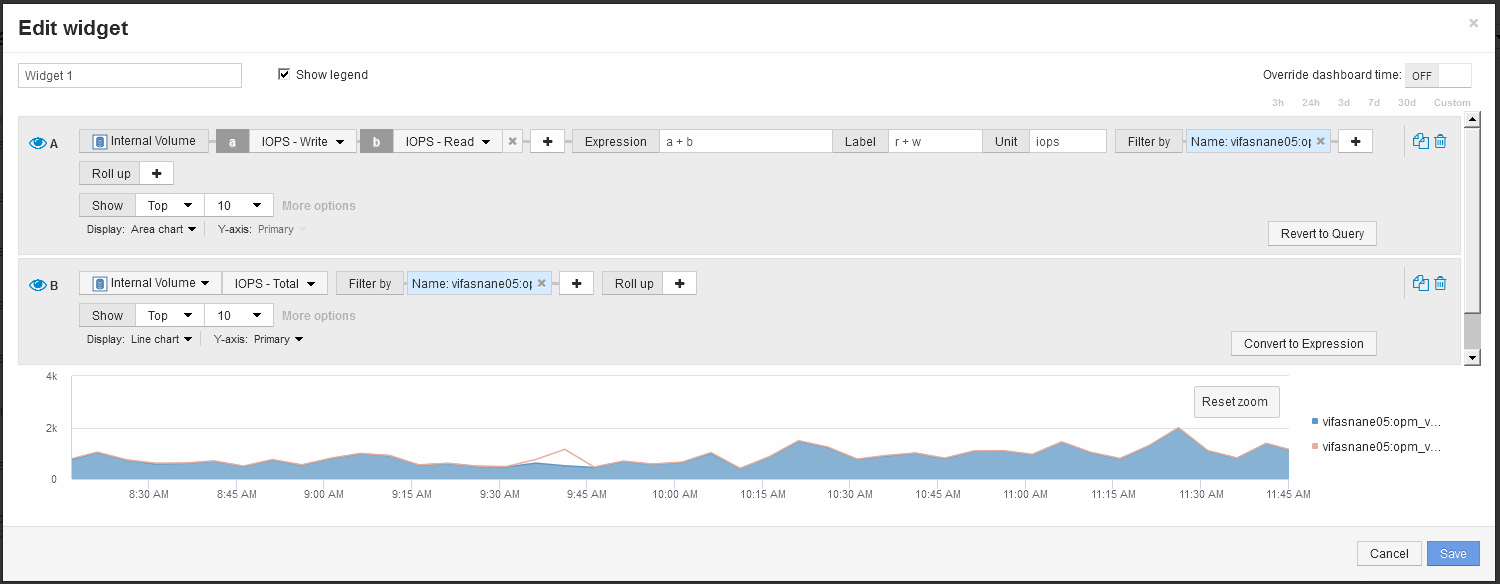
The chart displays the total IOPS as a line, with the chart showing the combination of read and write IOPS in blue. The gap between 9:30 and 9:45 shows non-read and non-write IO (overhead) operations.