

Displaying charts and graphs
 Suggest changes
The Nodes page contains the graphs and charts you should access regularly to monitor attributes such as storage capacity and throughput. In some cases, especially when working with technical support, you can use the Support > Tools > Grid Topology page to access additional charts.
You must be signed in to the Grid Manager using a supported browser.
-
Select Nodes. Then, select a node, a site, or the entire grid.
-
Select the tab for which you want to view information.
Some tabs include one or more Grafana charts, which are used to plot the values of Prometheus metrics over time. For example, the Nodes > Hardware tab for a node includes two Grafana charts.
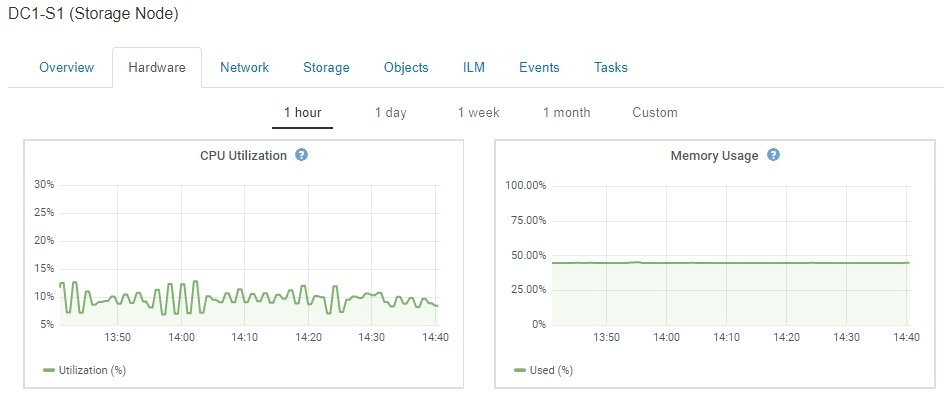
-
Optionally, hover your cursor over the chart to see more detailed values for a particular point in time.
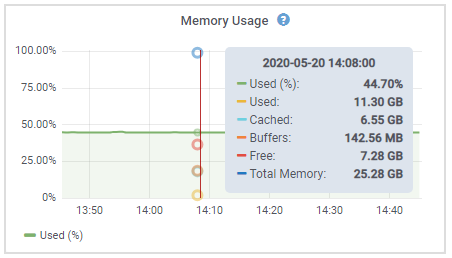
-
As required, you can often display a chart for a specific attribute or metric. From the table on the Nodes page, click the chart icon
 or
or  to the right of the attribute name.
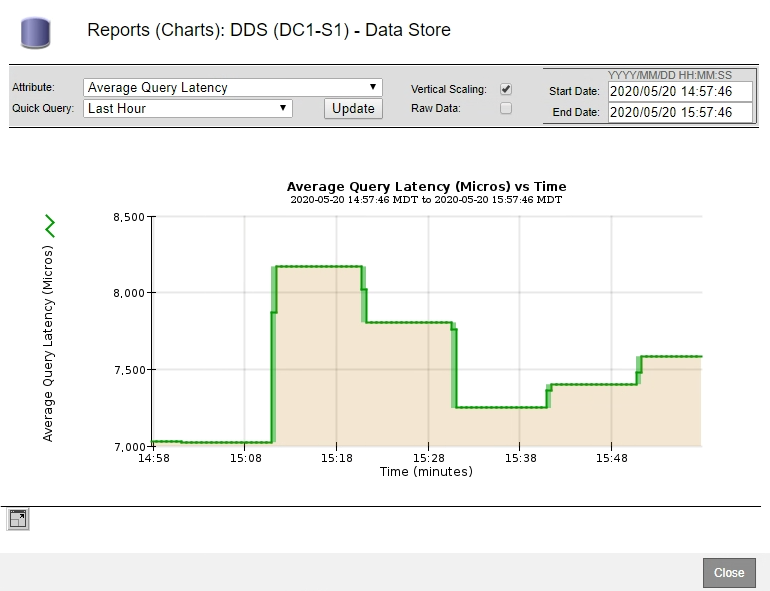
Charts are not available for all metrics and attributes. Example 1: From the Objects tab for a Storage Node, you can click the chart icon
to see the average latency for a metadata query over time.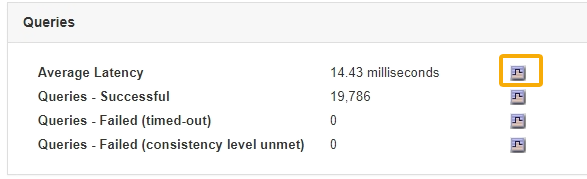
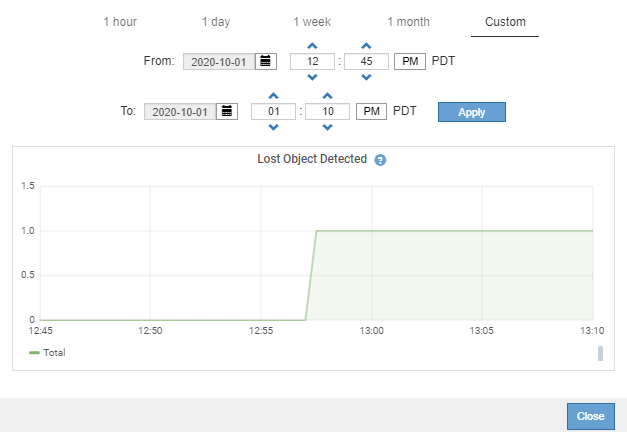
Example 2: From the Objects tab for a Storage Node, you can click the chart icon
to see the Grafana graph of the count of lost objects detected over time.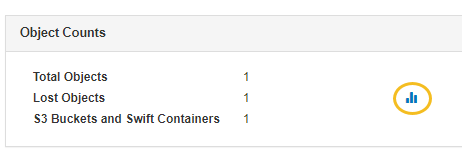
-
To display charts for attributes that are not shown on the Node page, select Support > Tools > Grid Topology.
-
Select grid node > component or service > Overview > Main.
-
Click the chart icon
next to the attribute.The display automatically changes to the Reports > Charts page. The chart displays the attribute's data over the past day.